Bridgend (UK Parliament constituency)
Coordinates: 51°30′25″N 3°34′52″W / 51.507°N 3.581°W
| Bridgend | |
|---|---|
|
County constituency for the House of Commons | |
|
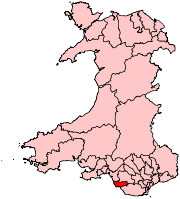
Boundary of Bridgend in Wales. | |
| Preserved county | Mid Glamorgan |
| Population | 79,873 (2011 census)[1] |
| Electorate | 59,533 (December 2010)[2] |
| Major settlements | Bridgend, Porthcawl |
| Current constituency | |
| Created | 1983 |
| Member of parliament | Madeleine Moon (Labour) |
| Number of members | One |
| Created from | Aberavon and Ogmore |
| Overlaps | |
| Welsh Assembly | South Wales West |
| European Parliament constituency | Wales |
Bridgend (Pen-y-bont ar Ogwr in Welsh) is a county constituency represented in the House of Commons of the Parliament of the United Kingdom. It returns one Member of Parliament (MP), elected by the first past the post voting system.
Boundaries
1983-1997: The Borough of Ogwr wards numbers 1, 2, 12 to 16, 18, and 20 to 23.
1997-2010: The Borough of Ogwr wards of Brackla, Cefn Cribwr, Coity Higher, Cornelly, Coychurch Lower, Laleston, Morfa, Newcastle, Newcastle Higher, Oldcastle, Porthcawl East, Porthcawl West, Pyle, and St Bride’s Major.
2010–present: The Bridgend County Borough electoral divisions of Brackla; Bryntirion, Laleston and Merthyr Mawr; Cefn Glas; Coity; Cornelly; Coychurch Lower; Litchard; Llangewydd and Brynhyfryd; Morfa; Newcastle; Newton; Nottage; Oldcastle; Pendre; Pen-y-fai; Porthcawl East Central; Porthcawl West Central; Pyle; and Rest Bay.
Members of Parliament
The Bridgend constituency was created in 1983 from parts of the seats of Ogmore & Aberavon. It normally elects Labour MPs although it went Conservative at the 1983 election landslide. Its current MP is Madeleine Moon of the Labour Party, who was first elected in 2005.
| Election | Member[3][4] | Party | |
|---|---|---|---|
| 1983 | Peter Hubbard-Miles | Conservative | |
| 1987 | Win Griffiths | Labour | |
| 2005 | Madeleine Moon | Labour | |
Elections
Elections in the 2010s
| Party | Candidate | Votes | % | ± | |
|---|---|---|---|---|---|
| Labour | Madeleine Moon | 14,624 | 37.1 | +0.7 | |
| Conservative | Meirion Jenkins | 12,697 | 32.2 | +1.8 | |
| UKIP | Caroline Jones | 5,911 | 15.0 | +12.9 | |
| Plaid Cymru | James Christopher Radcliffe [8] | 2,784 | 7.1 | +1.1 | |
| Liberal Democrat | Anita Dawn Davies [9] | 1,648 | 4.2 | −18.4 | |
| Independent | Les Tallon Morris | 763 | 1.9 | N/A | |
| Green | Tony White | 736 | 1.9 | N/A | |
| TUSC | Aaron David | 118 | 0.3 | N/A | |
| Pirate | David Anthony Elston | 106 | 0.3 | N/A | |
| National Front | Adam John Lloyd | 66 | 0.2 | N/A | |
| Majority | 1,927 | 4.9 | −1.0 | ||
| Turnout | 39,453 | 65.8 | +0.5 | ||
| Labour hold | Swing | −0.5 | |||
| Party | Candidate | Votes | % | ± | |
|---|---|---|---|---|---|
| Labour | Madeleine Moon | 13,931 | 36.3 | −6.6 | |
| Conservative | Helen Baker | 11,668 | 30.4 | +5.4 | |
| Liberal Democrat | Wayne Morgan | 8,658 | 22.6 | +0.5 | |
| Plaid Cymru | Nicholas Thomas | 2,269 | 5.9 | −1.0 | |
| BNP | Brian Urch | 1,020 | 2.7 | N/A | |
| UKIP | Dave Fulton | 801 | 2.1 | +0.9 | |
| Majority | 2,263 | 5.9 | |||
| Turnout | 38,347 | 65.3 | +5.6 | ||
| Labour hold | Swing | −6.0 | |||
Elections in the 2000s
| Party | Candidate | Votes | % | ± | |
|---|---|---|---|---|---|
| Labour | Madeleine Moon | 16,410 | 43.3 | −9.2 | |
| Conservative | Helen Baker | 9,887 | 26.1 | +0.8 | |
| Liberal Democrat | Paul Warren | 7,949 | 21.0 | +6.6 | |
| Plaid Cymru | Gareth Clubb | 2,527 | 6.7 | −0.5 | |
| Green | Jonathan Spink | 595 | 1.6 | N/A | |
| UKIP | Kunnathur Rajan | 491 | 1.3 | N/A | |
| Majority | 6,523 | 17.2 | |||
| Turnout | 37,859 | 59.2 | −1.0 | ||
| Labour hold | Swing | −5.0 | |||
| Party | Candidate | Votes | % | ± | |
|---|---|---|---|---|---|
| Labour | Win Griffiths | 19,423 | 52.5 | −5.6 | |
| Conservative | Mrs. Tania Alexandra Teofana Beatrice Brisby | 9,377 | 25.3 | +2.5 | |
| Liberal Democrat | Mrs. Jean Barraclough | 5,330 | 14.4 | +2.9 | |
| Plaid Cymru | Mrs. Monica Emma Mahoney | 2,653 | 7.2 | +3.4 | |
| ProLife Alliance | Mrs. Sara Hazel Jeremy | 223 | 0.6 | N/A | |
| Majority | 10,046 | 27.2 | |||
| Turnout | 37,006 | 60.2 | −12.1 | ||
| Labour hold | Swing | ||||
Elections in the 1990s
| Party | Candidate | Votes | % | ± | |
|---|---|---|---|---|---|
| Labour | Win Griffiths | 25,115 | 58.1 | +6.8 | |
| Conservative | David Thomas Charles Davies | 9,867 | 22.8 | −12.9 | |
| Liberal Democrat | Andrew Mckinlay | 4,968 | 11.5 | +1.2 | |
| Referendum | Tudor Greaves | 1,662 | 3.8 | N/A | |
| Plaid Cymru | Dennis R. Watkins | 1,649 | 3.8 | +1.0 | |
| Majority | 15,248 | 35.2 | |||
| Turnout | 43,261 | 72.3 | |||
| Labour hold | Swing | ||||
| Party | Candidate | Votes | % | ± | |
|---|---|---|---|---|---|
| Labour | Win Griffiths | 24,143 | 51.3 | +3.7 | |
| Conservative | David A. Unwin | 16,817 | 35.7 | −2.3 | |
| Liberal Democrat | David Mills | 4,827 | 10.3 | −1.9 | |
| Plaid Cymru | Alun Lloyd Jones | 1,301 | 2.8 | +0.5 | |
| Majority | 7,326 | 15.6 | +6.0 | ||
| Turnout | 47,088 | 80.5 | −0.1 | ||
| Labour hold | Swing | +3.0 | |||
Elections in the 1980s
| Party | Candidate | Votes | % | ± | |
|---|---|---|---|---|---|
| Labour | Win Griffiths | 21,893 | 47.5 | +12.3 | |
| Conservative | Peter Hubbard-Miles | 17,513 | 38.0 | −0.4 | |
| Social Democratic | Russell Smart | 5,590 | 12.1 | −11.1 | |
| Plaid Cymru | Laura McAllister | 1,065 | 2.3 | −0.9 | |
| Majority | 4,380 | 9.5 | |||
| Turnout | 46,061 | 80.3 | |||
| Labour gain from Conservative | Swing | +6.8 | |||
| Party | Candidate | Votes | % | ± | |
|---|---|---|---|---|---|
| Conservative | Peter Hubbard-Miles | 15,950 | 38.4 | N/A | |
| Labour | John A. Fellows | 14,623 | 35.2 | N/A | |
| Social Democratic | Russell Smart | 9,630 | 23.2 | N/A | |
| Plaid Cymru | Keith Bush | 1,312 | 3.2 | N/A | |
| Majority | 1,327 | 3.2 | N/A | ||
| Turnout | 41,515 | 77.0 | N/A | ||
| Conservative win (new seat) | |||||
See also
Notes and references
- ↑ "Bridgend: Usual Resident Population, 2011". Neighbourhood Statistics. Office for National Statistics. Retrieved 7 February 2015.
- ↑ "Beyond 20/20 WDS - Table view". 2011 Electorate Figures. StatsWales. 1 December 2010. Retrieved 13 March 2011.
- ↑ "Bridgend 1983-". Hansard 1803-2005. UK Parliament. Retrieved 2 February 2015.
- ↑ Leigh Rayment's Historical List of MPs – Constituencies beginning with "B" (part 5)
- ↑ "Election Data 2015". Electoral Calculus. Archived from the original on 17 October 2015. Retrieved 17 October 2015.
- ↑ "Bridgend and Ogmore results". Elections. Bridgend County Borough Council. Retrieved 21 September 2015.
- ↑ http://www.bbc.co.uk/news/politics/constituencies/W07000073
- ↑ "Archived copy". Archived from the original on 2015-03-21. Retrieved 2015-03-12.
- ↑ "List of selected candidates". Liberal Democrats. 4 March 2015. Retrieved 15 March 2015.
- ↑ "Election Data 2010". Electoral Calculus. Archived from the original on 17 October 2015. Retrieved 17 October 2015.
- ↑ Bridgend BBC Election - Bridgend
- ↑ "Election Data 2005". Electoral Calculus. Archived from the original on 15 October 2011. Retrieved 18 October 2015.
- ↑ "Election Data 2001". Electoral Calculus. Archived from the original on 15 October 2011. Retrieved 18 October 2015.
- ↑ "Election Data 1997". Electoral Calculus. Archived from the original on 15 October 2011. Retrieved 18 October 2015.
- ↑ "Election Data 1992". Electoral Calculus. Archived from the original on 15 October 2011. Retrieved 18 October 2015.
- ↑ "Politics Resources". Election 1992. Politics Resources. 9 April 1992. Retrieved 2010-12-06.
- ↑ "Election Data 1987". Electoral Calculus. Archived from the original on 15 October 2011. Retrieved 18 October 2015.
- ↑ "Election Data 1983". Electoral Calculus. Archived from the original on 15 October 2011. Retrieved 18 October 2015.
External links
- nomis Constituency Profile for Bridgend — presenting data from the ONS annual population survey and other official statistics.