Folsom Dam
- For the settlement formerly called Folsom Dam, see Morgans Landing, California.
| Folsom Dam | |
|---|---|
 Folsom Dam release | |
| Location | Folsom, California |
| Coordinates | 38°42′28″N 121°09′23″W / 38.707705°N 121.156526°WCoordinates: 38°42′28″N 121°09′23″W / 38.707705°N 121.156526°W |
| Construction began | 1948[1] |
| Opening date | 1956[1] |
| Construction cost | US$81.5 million |
| Operator(s) | U.S. Bureau of Reclamation |
| Dam and spillways | |
| Impounds | American River |
| Height | 340 ft (100 m)[2] |
| Length | 1,400 ft (430 m)[2] |
| Reservoir | |
| Creates | Folsom Lake |
| Total capacity | 1,120,000 acre·ft (1,380,000 dam3)[3] |
| Inactive capacity | 83,000 acre·ft (102,000 dam3)[4] |
| Catchment area | 1,875 sq mi (4,860 km2)[5] |
| Surface area | 11,930 acres (4,830 ha)[3] |
| Power station | |
| Commission date | 1955[6] |
| Hydraulic head | 300 ft (91 m) (rated)[6] |
| Turbines | 3x Francis |
| Installed capacity | 198.7 MW[6] |
| Annual generation | 691,358,000 KWh[1] |
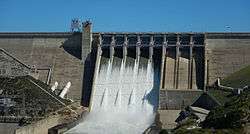
Folsom Dam is a concrete gravity dam on the American River of Northern California in the United States, about 25 mi (40 km) northeast of Sacramento. The dam is 340 ft (100 m) high and 1,400 ft (430 m) long, flanked by earthen wing dams. It was completed in 1955, officially opening the following year.
Located at the juncture of the north and south forks of the American River, the dam was built by the United States Army Corps of Engineers, and was transferred to the United States Bureau of Reclamation upon its completion. The dam and its reservoir, Folsom Lake, are part of the Central Valley Project, a multipurpose project that provides flood control, hydroelectricity, and irrigation and municipal water supply. In order to increase Sacramento's flood protection to 200 year flood protection (meaning that the area is protected from a flood that has a 0.5% chance of occurring in any given year) the US Army Corp of Engineers is constructing an auxiliary spillway.[7] The spillway is scheduled to be completed by October 2017, and will enable Folsom dam to release water before it reaches the height of the gates already in place.[8]
Another Central Valley Project dam, Nimbus Dam, is located further down river.
Specifications
Folsom Dam is located shortly north of the city of Folsom and consists of a 340 ft (100 m) high, 1,400 ft (430 m) long concrete gravity dam containing 1,170,000 cu yd (890,000 m3) of material.[2] The dam is flanked by two earthen wing dikes, and the reservoir is held in place by an additional nine saddle dams on the west and southeast sides.[9] The wing dams total a length of 8,800 ft (2,700 m),[10][11] and the saddle dams measure 16,530 ft (5,040 m) long combined.[12][13][14][15][16][17][18][19][20] The dam and appurtenant dikes total a length of 26,730 ft (8,150 m), more than 5 mi (8.0 km). Floodwaters are released by a spillway located on the main channel dam, controlled by eight radial gates with a capacity of 567,000 cu ft/s (16,100 m3/s), as well as a set of outlet works with a capacity of 115,000 cu ft/s (3,300 m3/s).[5]
The impounded water behind the dam forms Folsom Lake, with a normal maximum pool of 1,010,000 acre·ft (1,250,000 dam3)[1] and a surcharge capacity of 110,000 acre·ft (140,000 dam3), for a total capacity of 1,120,000 acre·ft (1,380,000 dam3).[3] At its maximum elevation of 480 ft (150 m), the reservoir covers 11,930 acres (4,830 ha),[3] with 75 mi (121 km) of shoreline.[21] The dam and reservoir control runoff from an area of 1,875 sq mi (4,860 km2), or 87.6% of the 2,140 sq mi (5,500 km2) American River watershed.[5][22] The average amount of runoff entering the reservoir is 2,700,000 acre ft, forcing the release of 1,700,000 acre ft for flood control.[23]
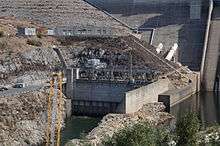
Folsom Power Plant is located on the north side of the river, at the base of the dam. It has three Francis turbines with a combined capacity of 198.72 megawatts (MW), uprated from its original capacity of 162 MW in 1972.[6] The power plant's electricity production is intermediate, between peaking and base load. It generally operates during the day, when the demand and price for electricity is the highest. The plant produces an average of 691,358,000 kilowatt hours each year.[1]
History
.jpg)
The current Folsom Dam, built in 1955, replaced an earlier, smaller dam that had been completed in 1893 by Horatio Gates Livermore. The earlier dam had fed the Folsom Powerhouse, generating electricity that was transmitted to Sacramento over a 22 mi (35 km)-long distribution line, the longest electrical distribution system in the world at the time.[24] The remains of the earlier dam can be seen downstream from the Folsom Lake Crossing.
The current dam was originally authorized by Congress in 1944 as a 355,000 acre·ft (438,000 dam3) flood control unit, and was reauthorized in 1949 as a 1,000,000 acre·ft (1,200,000 dam3) multiple-purpose facility.[25][26] Construction began in 1952 and it opened in 1955. Construction of the dam began in October 1948 and was completed in May 1956.[27]
Some old settlements and towns were flooded when the lake was filled, including Mormon Island and Salmon Falls.
Spillway gate failure
The hydraulic load on this type of spillway gate (Tainter gate) is transmitted from the cylindrical skin plate, which is in contact with the reservoir, through a number of struts to a convergence at the trunnion hub. The hub collects the load from the struts and transfers it across an interface to the trunnion pin, which is stationary and is connected to the dam. When the gate is operated, the hub rotates around the pin. The struts are primarily compression members, but friction at the pin-hub interface induces a bending stress during gate operation. Typically, and in this case, the struts are oriented such that the trunnion friction stress is applied to the weak axis of the struts (see Section modulus). In order to better handle these loads, the struts are connected with diagonal braces that take the stress as axial loads.
On the morning of July 17, 1995, the Folsom Dam power plant was shut down and Spillway Gate 3 was opened to maintain flows in the American River. As the gate was operated, the failure initiated at a diagonal brace between the lowest and second lowest struts. Increasing corrosion at the pin-hub interface raised the coefficient of friction and, therefore, the bending stress in the strut and the axial force in the brace. The capacity of the brace connection was exceeded and it failed. This caused the load to redistribute and the failure progressed, eventually buckling the struts.
After a year-long investigation, the United States Bureau of Reclamation attributed the failure to a design flaw: the Corps of Engineers, which designed the dam, did not consider trunnion friction (at the pin-hub interface) in the gate analyses. While this is true, this was one of five identical service gates that operated under the same circumstances for nearly 40 years without problems being observed. This suggests that the failure resulted from a condition that changed over time; specifically, there was a gradual increase in the coefficient of friction at the pin-hub interface. While one would expect maintenance frequency to increase as a gate ages, Reclamation decreased the frequency of regular maintenance and lubrication over time due to budget constraints. In addition, the lubricant used by Reclamation did not conform to the Corps' original design specifications; it was a new, environmentally-friendly lubricant that was not sufficiently waterproof, allowing water to enter the pin-hub interface and cause the corrosion that resulted in increased friction.[28]
The failure resulted in the uncontrolled release of nearly 40 percent of Folsom Lake at a peak rate of approximately 40,000 cubic feet per second (1,100 m3/s). The freshwater reaching San Francisco Bay was atypical for the summer season and confused salmon and striped bass, whose instincts told them that fall rains had arrived; they began their annual fall migrations months ahead of schedule.[29] However, this failure caused no fatalities and it had a significant positive impact on the dam industry. A renewed focus was placed on maintenance and monitoring of radial gates, many of which were retrofitted to strengthen struts and bracing and ensure sufficient lubrication.
Security
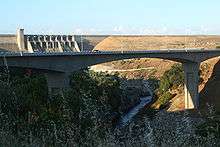

After the 2001 terrorist attacks, the Bureau of Reclamation analyzed potential targets for vulnerability and measures that could be taken to eliminate or reduce possible threats. With 500,000 residents in the vicinity of the Folsom Dam, the possibility of an attack on the dam was great enough concern for Bureau officials to close Folsom Dam Road. The road over the dam had been a major artery for the city of Folsom. With its closure, traffic became severely congested during rush hour. The impact was so great that residents and city officials petitioned the federal government to reconsider the road closure, which the government initially considered. Continued security concerns prevented them from re-opening the road and a new bridge, named Folsom Lake Crossing, was constructed and opened on March 28, 2009.[30]
Flood risk
During a severe storm in December 1964, the inflow into Folsom Lake reached a record high of 280,000 cu ft (7,900 m3) per second, with a river release of 115,000 cu ft (3,300 m3) per second. This exceeded the downriver levee capacity by 15,000 cu ft (420 m3) per second.[31]
In 1986, nearly 500,000 people faced the possibility of flooding when engineers at Folsom Dam were forced to open the spillway gates after heavy rains.[29]
The Bureau of Reclamation's Safety of Dams Program determined the risk of flooding in the Sacramento area made it one of the most at-risk communities in the United States.[32]
Two projects to increase flood protection are currently underway. The first will raise the surrounding dikes by 7 feet (2.1 m) to increase flood protection. The second, a new spillway, is designed to handle the runoff from large storms and snowmelt floods that might cause damage in the region. The new spillway is built with gates 50 ft (15 m) lower than the existing spillway, allowing for more efficient evacuation of reservoir storage before flooding events.[33][34]
See also
- List of dams and reservoirs in California
- List of power stations in California
- List of the tallest dams in the United States
- List of United States Bureau of Reclamation dams
References
- 1 2 3 4 5 "Folsom Dam General Information". Folsom and Sly Park Units Project. U.S. Bureau of Reclamation. 2009-06-04. Retrieved 2012-08-25.
- 1 2 3 "Folsom Dam Dimensions". Folsom and Sly Park Units Project. U.S. Bureau of Reclamation. 2009-06-04. Retrieved 2012-08-25.
- 1 2 3 4 Department of Civil & Environmental Engineering, National Performance of Dams Program (27 August 2012). "Folsom Dam". Stanford University. Retrieved 27 August 2012.
- ↑ Ritzema, Randall S.; Newlin, Brad D.; Van Lienden, Brian J. (October 2001). "Appendix H: Infrastructure" (PDF). CALVIN Project. University of California Davis. Retrieved 2014-01-25.
- 1 2 3 "Folsom Dam Hydraulics & Hydrology". Folsom and Sly Park Units Project. U.S. Bureau of Reclamation. 2009-06-04. Retrieved 2012-08-25.
- 1 2 3 4 "Folsom Powerplant". Folsom and Sly Park Units Project. U.S. Bureau of Reclamation. 2009-05-13. Retrieved 2012-08-25.
- ↑ "Sacramento District > Missions > Civil Works > Folsom Dam Auxiliary Spillway". www.spk.usace.army.mil. Retrieved 2016-02-29.
- ↑ "Water fill means big Folsom Dam spillway project hits milestone". sacbee. Retrieved 2016-02-29.
- ↑ Department of Civil & Environmental Engineering, National Performance of Dams Program (27 August 2012). "NPDP Dams Directory Query Result: Folsom". Stanford University. Retrieved 27 August 2012.
- ↑ Department of Civil & Environmental Engineering, National Performance of Dams Program (27 August 2012). "Folsom Left Wing". Stanford University. Retrieved 27 August 2012.
- ↑ Department of Civil & Environmental Engineering, National Performance of Dams Program (27 August 2012). "Folsom Right Wing". Stanford University. Retrieved 27 August 2012.
- ↑ Department of Civil & Environmental Engineering, National Performance of Dams Program (27 August 2012). "Mormon Island Auxiliary Dam". Stanford University. Retrieved 27 August 2012.
- ↑ Department of Civil & Environmental Engineering, National Performance of Dams Program (27 August 2012). "Folsom Dike 1". Stanford University. Retrieved 27 August 2012.
- ↑ Department of Civil & Environmental Engineering, National Performance of Dams Program (27 August 2012). "Folsom Dike 2". Stanford University. Retrieved 27 August 2012.
- ↑ Department of Civil & Environmental Engineering, National Performance of Dams Program (27 August 2012). "Folsom Dike 3". Stanford University. Retrieved 27 August 2012.
- ↑ Department of Civil & Environmental Engineering, National Performance of Dams Program (27 August 2012). "Folsom Dike 4". Stanford University. Retrieved 27 August 2012.
- ↑ Department of Civil & Environmental Engineering, National Performance of Dams Program (27 August 2012). "Folsom Dike 5". Stanford University. Retrieved 27 August 2012.
- ↑ Department of Civil & Environmental Engineering, National Performance of Dams Program (27 August 2012). "Folsom Dike 6". Stanford University. Retrieved 27 August 2012.
- ↑ Department of Civil & Environmental Engineering, National Performance of Dams Program (27 August 2012). "Folsom Dike 7". Stanford University. Retrieved 27 August 2012.
- ↑ Department of Civil & Environmental Engineering, National Performance of Dams Program (27 August 2012). "Folsom Dike 8". Stanford University. Retrieved 27 August 2012.
- ↑ "Folsom Lake State Recreation Area". California State Parks. California Department of Parks and Recreation. 27 August 2012. Retrieved 27 August 2012.
- ↑ "Boundary Descriptions and Names of Regions, Subregions, Accounting Units and Cataloging Units". U.S. Geological Survey. Retrieved 2012-08-25.
- ↑ "Folsom Dam F.A.Q.s". www.parks.ca.gov. Retrieved 2016-03-04.
- ↑ "Folsom Powerhouse State Historic Park".
- ↑ House Report 107-651
- ↑ American River Basin Development Act, Pub.L. 81–356, 63 Stat. 852, enacted October 14, 1949
- ↑ "The Treasured American River: Folsom Power House". Historical Marker Database. Retrieved 27 August 2012.
- ↑ http://www.usbr.gov/ssle/damsafety/Risk/BestPractices/16-RadialGatesTrunnionFrictionPP201108.pdf
- 1 2 "Building Big: Databank—Folsom Dam". Wonders of the World Databank. PBS. Retrieved 27 August 2012.
- ↑ "City of Folsom - New Folsom Bridge".
- ↑ Department of Parks and Recreation. "Folsom Dam". State of California. Retrieved 27 August 2012.
- ↑ "Folsom Dam Improvements Marker". Historical Marker Database. Retrieved 27 August 2012.
- ↑ "CDM Folsom Dam Environmental Planning". Retrieved 2009-11-24.
- ↑ "Dam Upgrades Will Double Flood Protection for Sacramento". Environment News Service. January 14, 2008. Retrieved 27 August 2012.
Further reading
- http://www.usbr.gov/mp/jfp/news-info/Final%20JFP%201-page%20Flyer%204-2-07.pdf
- United States Bureau of Reclamation - Folsom Power Plant
- United States Bureau of Reclamation - Central Valley Project