Castile-La Mancha parliamentary election, 1987

|
|
|
|
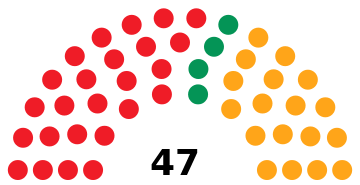
All 47 seats in the Courts of Castile-La Mancha
24 seats needed for a majority |
| Registered |
1,259,742  2.4% 2.4% |
| Turnout |
950,262 (75.4%)
2.1 pp |
| |
First party |
Second party |
Third party |
| |
.jpg) |
.jpg) |
 |
| Leader |
José Bono |
Arturo García-Tizón |
Francisco Ruiz Castillo |
| Party |
PSOE |
AP |
CDS |
| Leader since |
25 March 1983 |
23 June 1985 |
1987 |
| Last election |
23 seats, 46.7% |
21 seats, 40.9%[lower-alpha 1] |
0 seats, 3.0% |
| Seats won |
25 |
18 |
4 |
| Seat change |
2 |
 3 3 |
4 |
| Popular vote |
435,121 |
319,978 |
98,539 |
| Percentage |
46.3% |
34.1% |
10.5% |
| Swing |
0.4 pp |
6.8 pp |
7.5 pp |
|
|
|
The 1987 Castile-La Mancha parliamentary election was held on Wednesday, 10 June 1987, to elect the 2nd Courts of Castile-La Mancha, the regional legislature of the Spanish autonomous community of Castile-La Mancha. At stake were all seats in the Courts, determining the President of the Junta of Communities of Castile-La Mancha. The number of members increased from 44 to 47 compared to the previous election.
The election was won by the Spanish Socialist Workers' Party (PSOE), which gained 2 seats and enlarged its absolute majority from 52% to 53% of the seats; Castile-La Mancha thus became one of the few autonomous communities in the 1987 regional elections where the PSOE increased its parliamentary representation. The People's Alliance (AP), on the other hand, won just 34% of the share and 18 seats, after the People's Coalition had broken up in 1986. Both former AP partners, the People's Democratic Party (PDP) and the Liberal Party (PL), stood separately but failed to attract significant support.
The Democratic and Social Centre (CDS), a party founded by former Prime Minister Adolfo Suárez, entered the Courts for its first and only time, setting a record result for third parties in future regional elections with 4 seats and over 10% of the share. United Left (IU), an electoral coalition between the Communist Party of Spain and other left-wing parties formed in 1986, failed to gain any seats and dropped from the 6.9% it had in 1983 to 5.4%.
Electoral system
The number of seats in the Castile-La Mancha Courts was set to a fixed-number of 47. All Courts members were elected in 5 multi-member districts, corresponding to Castile-La Mancha's five provinces, using the D'Hondt method and a closed-list proportional representation system. Each district was assigned a fixed set of seats, distributed as follows: Albacete (10), Ciudad Real (11), Cuenca (8), Guadalajara (7) and Toledo (11).
Voting was on the basis of universal suffrage in a secret ballot. Only lists polling above 3% of valid votes in each district (which include blank ballots—for none of the above) were entitled to enter the seat distribution.[1]
Opinion polls
Seat projections
Opinion polls showing seat projections are displayed in the table below. The highest seat figures in each polling survey have their background shaded in the leading party's colour. In the instance that there is a tie, then no figure is shaded. 24 seats were required for an absolute majority in the Courts of Castile-La Mancha.
24 seats needed for majority (23/12/1986–10/06/1987)
23 seats needed for majority (08/05/1983–23/12/1986)
| Date |
Polling Firm/Source |
PSOE |
AP |
IU |
CDS |
Others |
|
|
|
|
| 10 Jun 1987 |
Regional Election |
25 |
18 |
0 |
4 |
0 |
| Exit polls |
| 20 May |
Typol |
23−25 |
19−21 |
0 |
2−3 |
0 |
| 1987 |
| 1986 |
| 1985 |
| 1984 |
| 8 May 1983 |
Regional Election |
23 |
21 |
0 |
0 |
0 |
Results
Overall
← Summary of the 10 June 1987 Castile-La Mancha Courts election results →
| |
| Party |
Vote |
Seats |
| Votes |
% |
±pp |
Won |
+/− |
|
Spanish Socialist Workers' Party (PSOE) |
435,121 | 46.33 | 0.37 |
25 | 2 |
|
People's Alliance (AP)[lower-alpha 1] |
319,978 | 34.07 | 6.85 |
18 | 3 |
|
Democratic and Social Centre (CDS) |
98,539 | 10.49 | 7.47 |
4 | 4 |
|
United Left (IU)[lower-alpha 2] |
50,366 | 5.36 | 1.50 |
0 | ±0 |
|
People's Democratic Party (PDP) |
15,863 | 1.69 | New |
0 | ±0 |
|
Workers' Party of Spain–Communist Unity (PTE-UC) |
3,871 | 0.41 | New |
0 | ±0 |
|
Humanist Platform (PH) |
1,778 | 0.19 | New |
0 | ±0 |
|
Liberal Party (PL) |
1,459 | 0.16 | New |
0 | ±0 |
|
Social Democratic Party of Castile-La Mancha (PSDCLM) |
1,317 | 0.14 | New |
0 | ±0 |
|
Regionalist Unitary Party (PUR) |
1,183 | 0.13 | New |
0 | ±0 |
|
Manchegan Regionalist Party (PRM) |
487 | 0.05 | New |
0 | ±0 |
|
Blank ballots |
9,247 | 0.98 | 0.33 |
|
| |
| Total |
939,209 | 100.00 | |
47 | 3 |
| |
| Valid votes |
939,209 | 98.84 | 0.02 |
|
| Invalid votes |
11,053 | 1.16 | 0.02 |
| Votes cast / turnout |
950,262 | 75.43 | 2.11 |
| Abstentions |
309,480 | 26.68 | 2.11 |
| Registered voters |
1,259,742 | |
| |
| Source: Argos Information Portal |
| Vote share |
|---|
|
|
|
|
|
| PSOE |
|
46.33% |
| AP |
|
34.07% |
| CDS |
|
10.49% |
| IU |
|
5.36% |
| PDP |
|
1.69% |
| Others |
|
1.51% |
| Blank ballots |
|
0.98% |
| Parliamentary seats |
|---|
|
|
|
|
|
| PSOE |
|
53.19% |
| AP |
|
38.30% |
| CDS |
|
8.51% |
Results by province
| Albacete |
| Party |
Vote |
Seats |
| Votes |
% |
±pp |
Won |
+/− |
|
Spanish Socialist Workers' Party (PSOE) |
87,833 | 48.54 | 4.30 |
6 | 1 |
|
People's Alliance (AP)[lower-alpha 1] |
55,425 | 30.63 | 6.31 |
3 | 1 |
|
Democratic and Social Centre (CDS) |
19,471 | 10.76 | 8.79 |
1 | 1 |
|
United Left (IU)[lower-alpha 2] |
11,854 | 6.55 | 0.72 |
0 | ±0 |
|
People's Democratic Party (PDP) |
2,090 | 1.16 | New |
0 | ±0 |
|
Workers' Party of Spain–Communist Unity (PTE-UC) |
1,609 | 0.89 | New |
0 | ±0 |
|
Manchegan Regionalist Party (PRM) |
487 | 0.27 | New |
0 | ±0 |
|
Humanist Platform (PH) |
380 | 0.21 | New |
0 | ±0 |
|
Blank ballots |
1,789 | 0.99 | 0.34 |
|
| |
| Total |
180,938 | 100.00 | |
10 | 1 |
| |
| Valid votes |
180,938 | 98.98 | 0.15 |
|
| Invalid votes |
1,861 | 1.02 | 0.15 |
| Votes cast / turnout |
182,799 | 73.19 | 2.30 |
| Abstentions |
66,962 | 26.81 | 2.30 |
| Registered voters |
249,761 | |
| |
| Source: Argos Information Portal |
|
| Ciudad Real |
| Party |
Vote |
Seats |
| Votes |
% |
±pp |
Won |
+/− |
|
Spanish Socialist Workers' Party (PSOE) |
129,581 | 50.11 | 0.37 |
6 | ±0 |
|
People's Alliance (AP)[lower-alpha 1] |
74,690 | 28.88 | 10.21 |
4 | ±0 |
|
Democratic and Social Centre (CDS) |
29,773 | 11.51 | 8.02 |
1 | 1 |
|
United Left (IU)[lower-alpha 2] |
14,272 | 5.52 | 0.74 |
0 | ±0 |
|
People's Democratic Party (PDP) |
5,734 | 2.22 | New |
0 | ±0 |
|
Workers' Party of Spain–Communist Unity (PTE-UC) |
3,871 | 0.41 | New |
0 | ±0 |
|
Regionalist Unitary Party (PUR) |
1,183 | 0.46 | New |
0 | ±0 |
|
Social Democratic Party of Castile-La Mancha (PSDCLM) |
805 | 0.31 | New |
0 | ±0 |
|
Blank ballots |
2,568 | 0.99 | 0.31 |
|
| |
| Total |
258,606 | 100.00 | |
11 | 1 |
| |
| Valid votes |
258,606 | 98.89 | 0.13 |
|
| Invalid votes |
2,909 | 1.11 | 0.13 |
| Votes cast / turnout |
261,515 | 72.07 | 2.45 |
| Abstentions |
101,323 | 27.93 | 2.45 |
| Registered voters |
362,838 | |
| |
| Source: Argos Information Portal |
|
| Cuenca |
| Party |
Vote |
Seats |
| Votes |
% |
±pp |
Won |
+/− |
|
Spanish Socialist Workers' Party (PSOE) |
56,445 | 44.13 | 2.28 |
4 | ±0 |
|
People's Alliance (AP)[lower-alpha 1] |
48,731 | 38.10 | 6.00 |
4 | ±0 |
|
Democratic and Social Centre (CDS) |
11,142 | 8.71 | 6.87 |
0 | ±0 |
|
People's Democratic Party (PDP) |
3,750 | 2.93 | New |
0 | ±0 |
|
United Left (IU)[lower-alpha 2] |
3,304 | 2.58 | 2.89 |
0 | ±0 |
|
Liberal Party (PL) |
1,459 | 1.14 | New |
0 | ±0 |
|
Workers' Party of Spain–Communist Unity (PTE-UC) |
1,329 | 1.04 | New |
0 | ±0 |
|
Humanist Platform (PH) |
360 | 0.28 | New |
0 | ±0 |
|
Blank ballots |
1,384 | 1.08 | 0.36 |
|
| |
| Total |
127,904 | 100.00 | |
8 | ±0 |
| |
| Valid votes |
127,904 | 98.81 | 0.11 |
|
| Invalid votes |
1,546 | 1.19 | 0.11 |
| Votes cast / turnout |
129,450 | 77.14 | 1.88 |
| Abstentions |
38,353 | 22.86 | 1.88 |
| Registered voters |
167,803 | |
| |
| Source: Argos Information Portal |
|
| Guadalajara |
| Party |
Vote |
Seats |
| Votes |
% |
±pp |
Won |
+/− |
|
People's Alliance (AP)[lower-alpha 1] |
35,900 | 41.69 | 4.47 |
3 | 1 |
|
Spanish Socialist Workers' Party (PSOE) |
32,549 | 37.80 | 1.88 |
3 | ±0 |
|
Democratic and Social Centre (CDS) |
9,021 | 10.48 | 6.21 |
1 | 1 |
|
United Left (IU)[lower-alpha 2] |
4,382 | 5.09 | 2.05 |
0 | ±0 |
|
People's Democratic Party (PDP) |
2,571 | 2.99 | New |
0 | ±0 |
|
Humanist Platform (PH) |
526 | 0.61 | New |
0 | ±0 |
|
Blank ballots |
1,154 | 1.34 | 0.48 |
|
| |
| Total |
86,103 | 100.00 | |
7 | ±0 |
| |
| Valid votes |
86,103 | 98.53 | 0.08 |
|
| Invalid votes |
1,281 | 1.47 | 0.08 |
| Votes cast / turnout |
87,384 | 77.07 | 2.59 |
| Abstentions |
25,997 | 22.93 | 2.59 |
| Registered voters |
113,381 | |
| |
| Source: Argos Information Portal |
|
| Toledo |
| Party |
Vote |
Seats |
| Votes |
% |
±pp |
Won |
+/− |
|
Spanish Socialist Workers' Party (PSOE) |
128,713 | 45.06 | 1.40 |
6 | 1 |
|
People's Alliance (AP)[lower-alpha 1] |
105,232 | 36.84 | 5.27 |
4 | 1 |
|
Democratic and Social Centre (CDS) |
29,132 | 10.20 | 6.77 |
1 | 1 |
|
United Left (IU)[lower-alpha 2] |
16,554 | 5.80 | 1.88 |
0 | ±0 |
|
People's Democratic Party (PDP) |
1,718 | 0.60 | New |
0 | ±0 |
|
Workers' Party of Spain–Communist Unity (PTE-UC) |
933 | 0.33 | New |
0 | ±0 |
|
Humanist Platform (PH) |
512 | 0.18 | New |
0 | ±0 |
|
Social Democratic Party of Castile-La Mancha (PSDCLM) |
512 | 0.18 | New |
0 | ±0 |
|
Blank ballots |
2,352 | 0.82 | 0.28 |
|
| |
| Total |
285,658 | 100.00 | |
11 | 1 |
| |
| Valid votes |
285,658 | 98.80 | 0.21 |
|
| Invalid votes |
3,456 | 1.20 | 0.21 |
| Votes cast / turnout |
289,114 | 79.00 | 1.53 |
| Abstentions |
76,845 | 21.00 | 1.53 |
| Registered voters |
365,959 | |
| |
| Source: Argos Information Portal |
|
Notes
References