Brighton and Hove City Council election, 2007
Elections to Brighton and Hove City Council on the south coast of England were held on 3 May 2007. The whole council (a unitary authority) was up for election and all 54 councillors were elected.
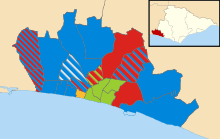
The Conservative Party replaced the Labour Party as the largest party on the council. However, the council remained under "no overall control" (i.e., no absolute majority for any party): the Conservatives won 26 out of the 54 seats in the city. This result was to some extent in line with the general pattern of results throughout England that day, with Conservatives gaining seats at the expense of Labour and the Liberal Democrats. The Green Party increased its number of seats from 6 to 12.
Following the election, the composition of the council was as follows:
| Party | Seats | ± | |
|---|---|---|---|
| Conservative | 26 | +6 | |
| Labour | 13 | -10 | |
| Green Party | 12 | +6 | |
| Liberal Democrat | 2 | –1 | |
| Independent | 1 | –1 | |
Election result
| Brighton & Hove Election Result 2007 | ||||||||||
|---|---|---|---|---|---|---|---|---|---|---|
| Party | Seats | Gains | Losses | Net gain/loss | Seats % | Votes % | Votes | +/− | ||
| Conservative | 26 | 6 | 0 | 6 | 48.15 | 34.58 | 28,444 | +0.09 | ||
| Labour Co-op | 13 | 0 | 10 | -10 | 24.07 | 24.72 | 20,331 | -7.64 | ||
| Green | 12 | 6 | 0 | 6 | 22.22 | 20.72 | 17,046 | +4.14 | ||
| Liberal Democrat | 2 | 0 | 1 | -1 | 3.70 | 10.56 | 8,686 | -4.57 | ||
| Independent | 1 | 0 | 1 | -1 | 1.85 | 5.32 | 4,378 | +3.84 | ||
| Brighton and Hove Independents | 0 | 0 | 0 | 0 | 0 | 1.88 | 1,545 | N/A | ||
| Respect | 0 | 0 | 0 | 0 | 0 | 0.78 | 643 | N/A | ||
| Protest Vote | 0 | 0 | 0 | 0 | 0 | 0.41 | 338 | N/A | ||
| UKIP | 0 | 0 | 0 | 0 | 0 | 0.35 | 291 | +0.26 | ||
| Alliance for Green Socialism | 0 | 0 | 0 | 0 | 0 | 0.28 | 232 | N/A | ||
| Socialist Alternative | 0 | 0 | 0 | 0 | 0 | 0.19 | 159 | N/A | ||
| Socialist Labour | 0 | 0 | 0 | 0 | 0 | 0.13 | 109 | -0.03 | ||
| English Democrat | 0 | 0 | 0 | 0 | 0 | 0.07 | 56 | N/A | ||
Ward results
Brunswick and Adelaide
| Party | Candidate | Votes | % | ± | |
|---|---|---|---|---|---|
| Liberal Democrat | Paul Elgood | 942 | 23.18 | -6.22 | |
| Liberal Democrat | David Watkins | 729 | 17.94 | -8.90 | |
| Green | Phelim MacCafferty | 482 | 11.86 | +4.86 | |
| Green | Hazel Ellison | 431 | 10.61 | +10.61 | |
| Conservative | Joanne Heard | 368 | 9.06 | +2.59 | |
| Conservative | Roz Rawcliffe | 357 | 8.78 | +2.38 | |
| Labour Co-op | David Boyle | 284 | 6.99 | -7.98 | |
| Labour Co-op | Simon Gulliver | 263 | 6.47 | -6.57 | |
| Independent | Brian Ralfe | 152 | 3.74 | N/A | |
| English Democrat | Ben Potter | 56 | 1.38 | N/A | |
| Turnout | 3,335 | 28.0 | -4.9 | ||
| Liberal Democrat hold | Swing | ||||
| Liberal Democrat hold | Swing | ||||
Central Hove
| Party | Candidate | Votes | % | ± | |
|---|---|---|---|---|---|
| Conservative | Averil Older | 964 | 20.48 | +0.84 | |
| Conservative | Jan Young | 901 | 19.14 | +0.04 | |
| Liberal Democrat | Simon Doyle | 692 | 14.70 | -1.20 | |
| Liberal Democrat | Benjamin Herbert | 667 | 14.17 | -1.06 | |
| Green | Dave Walsh | 420 | 8.92 | +3.04 | |
| Green | Jacqueline Da Costa | 333 | 7.07 | +1.84 | |
| Labour Co-op | Rachel Lyons | 317 | 6.73 | -3.05 | |
| Labour Co-op | Bernie Katz | 304 | 6.46 | -2.77 | |
| Protest Vote | Christopher Kilburn | 109 | 2.32 | N/A | |
| Turnout | 4,707 | 34.0 | -7.6 | ||
| Conservative hold | Swing | ||||
| Conservative hold | Swing | ||||
East Brighton
| Party | Candidate | Votes | % | ± | |
|---|---|---|---|---|---|
| Labour Co-op | Gill Mitchell | 1,539 | 15.78 | +1.66 | |
| Labour Co-op | Warren Morgan | 1,401 | 13.73 | +0.47 | |
| Labour Co-op | Craig Turton | 1,262 | 12.36 | +1.18 | |
| Conservative | Simon Hackett | 1,000 | 9.80 | +0.09 | |
| Conservative | Victor Mower | 997 | 9.77 | +0.47 | |
| Conservative | David Van Day | 931 | 9.12 | +0.20 | |
| Green | Nigel Tart | 621 | 6.08 | +0.39 | |
| Green | Eliza Fakhr | 467 | 4.58 | +0.24 | |
| Green | Hugh Miller | 445 | 4.36 | +0.74 | |
| Liberal Democrat | James Ledward | 401 | 3.93 | -3.11 | |
| Liberal Democrat | Tim Hodlin | 400 | 3.92 | -2.31 | |
| Liberal Democrat | Trefor Hunter | 377 | 3.69 | -1.36 | |
| Brighton and Hove Independents | Vicki Davies | 257 | 2.52 | N/A | |
| Socialist Labour | John McLeod | 109 | 1.07 | -0.46 | |
| Turnout | 10,207 | 35.4 | -3.2 | ||
| Labour Co-op hold | Swing | ||||
| Labour Co-op hold | Swing | ||||
| Labour Co-op hold | Swing | ||||
Goldsmid
| Party | Candidate | Votes | % | ± | |
|---|---|---|---|---|---|
| Conservative | Paul Lainchbury | 1,330 | 10.67 | -0.25 | |
| Conservative | Ayas Fallon-Khan | 1,238 | 9.93 | -0.52 | |
| Labour Co-op | Melanie Davis | 1,231 | 9.87 | -0.86 | |
| Labour Co-op | Vince Meegan | 1,201 | 9.63 | -1.07 | |
| Conservative | Stephen Wade | 1,189 | 9.54 | -0.88 | |
| Labour Co-op | Alun Jones | 1,098 | 8.81 | -1.69 | |
| Green | Rob Jarrett | 1,010 | 8.10 | +1.77 | |
| Green | Martin Grimshaw | 833 | 6.68 | +2.13 | |
| Green | Sue Baumgardt | 760 | 6.10 | +2.22 | |
| Liberal Democrat | Bob Bailey | 720 | 5.77 | -2.13 | |
| Liberal Democrat | Andrew Mailing | 609 | 4.88 | -2.44 | |
| Liberal Democrat | Stephen Potts | 506 | 4.06 | -2.24 | |
| Brighton and Hove Independents | Anne Giebeler | 314 | 2.52 | N/A | |
| Independent | Gemma Furness | 134 | 1.07 | N/A | |
| Independent | Nigel Furness | 114 | 0.91 | N/A | |
| Brighton and Hove Independents | David Jeal | 109 | 0.87 | N/A | |
| Independent | Peter Poole | 73 | 0.59 | N/A | |
| Turnout | 12,469 | 37.5 | -6.2 | ||
| Conservative hold | Swing | ||||
| Conservative gain from Labour Co-op | Swing | ||||
| Labour Co-op hold | Swing | ||||
Hangleton and Knoll
| Party | Candidate | Votes | % | ± | |
|---|---|---|---|---|---|
| Conservative | Dawn Barnett | 2,651 | 18.73 | +4.88 | |
| Conservative | Tony Janio | 2,237 | 15.80 | +1.15 | |
| Conservative | David Smart | 2,215 | 15.65 | +2.95 | |
| Labour Co-op | Brian Fitch | 1,820 | 12.86 | -2.39 | |
| Labour Co-op | Tony Meadows | 1,514 | 10.70 | -3.62 | |
| Labour Co-op | Eddy Sears | 1,509 | 10.66 | -2.35 | |
| Liberal Democrat | David Patrick | 335 | 2.37 | -0.48 | |
| Green | Andy Player | 321 | 2.27 | -0.41 | |
| Respect | Maggie Clifford | 297 | 2.10 | +0.84 | |
| UKIP | Stuart Bower | 291 | 2.06 | N/A | |
| Liberal Democrat | David Sears | 261 | 1.84 | -1.25 | |
| Green | Tim Goodall | 255 | 1.80 | +0.18 | |
| Green | Nicola Hodgson | 251 | 1.77 | +0.53 | |
| Liberal Democrat | Lee Shingles | 198 | 1.40 | -1.20 | |
| Turnout | 14,155 | 45.6 | -10.7 | ||
| Conservative hold | Swing | ||||
| Conservative gain from Labour Co-op | Swing | ||||
| Conservative gain from Labour Co-op | Swing | ||||
Hanover and Elm Grove
| Party | Candidate | Votes | % | ± | |
|---|---|---|---|---|---|
| Green | Bill Randall | 2,182 | 18.61 | +2.56 | |
| Green | Georgia Wrighton | 2,102 | 17.93 | +4.09 | |
| Green | Vicky Wakefield-Jarrett | 1,945 | 16.59 | +6.50 | |
| Labour Co-op | Joyce Edmond-Smith | 1,321 | 11.27 | -2.50 | |
| Labour Co-op | Leo Barraclough | 1,030 | 8.78 | -3.79 | |
| Labour Co-op | Brendan Hanlon | 945 | 8.06 | -2.97 | |
| Conservative | James Mortimer | 482 | 4.11 | +0.54 | |
| Conservative | Guy Gilmour | 459 | 3.91 | +0.51 | |
| Conservative | Luke Foster | 411 | 3.51 | +0.19 | |
| Liberal Democrat | Matthew Barker | 333 | 2.84 | -0.93 | |
| Liberal Democrat | Ellen Woolley | 260 | 2.22 | -1.14 | |
| Liberal Democrat | Beulah Town | 256 | 2.18 | -1.11 | |
| Turnout | 11,466 | 36.6 | -8.2 | ||
| Green hold | Swing | ||||
| Green hold | Swing | ||||
| Green gain from Labour Co-op | Swing | ||||
Hollingdean and Stanmer (until 2008 known as Hollingbury and Stanmer)
| Party | Candidate | Votes | % | ± | |
|---|---|---|---|---|---|
| Labour Co-op | Jeane Lepper | 1,326 | 15.10 | -1.26 | |
| Labour Co-op | Christine Simpson | 1,056 | 12.02 | -2.59 | |
| Labour Co-op | Patricia Hawkes | 1,049 | 11.94 | -2.94 | |
| Conservative | Carol Ramsden | 838 | 9.54 | +0.79 | |
| Conservative | Nick Garside | 832 | 9.47 | +0.98 | |
| Conservative | Karen Miles | 825 | 9.39 | +1.44 | |
| Green | Tom Druitt | 685 | 7.80 | +1.98 | |
| Green | Amelia Mills | 561 | 6.39 | +2.23 | |
| Green | Guy Richardson | 426 | 4.85 | +1.90 | |
| Independent | Nick Savvides | 408 | 4.65 | N/A | |
| Liberal Democrat | Vanessa Blackwell | 381 | 4.34 | +0.04 | |
| Liberal Democrat | Trevor Freeman | 285 | 3.25 | -0.72 | |
| Liberal Democrat | John Riddington | 267 | 3.04 | -0.22 | |
| Alliance for Green Socialism | Tony Greenstein | 232 | 2.64 | -0.22 | |
| Socialist Alternative | Andrew Clarke | 159 | 1.81 | N/A | |
| Socialist Alternative | Phillip Clarke | 137 | 1.56 | N/A | |
| Turnout | 9,467 | 30.63 | -7.28 | ||
| Labour Co-op hold | Swing | ||||
| Labour Co-op hold | Swing | ||||
| Labour Co-op hold | Swing | ||||
Hove Park (until 2009 known as Stanford)
| Party | Candidate | Votes | % | ± | |
|---|---|---|---|---|---|
| Conservative | Vanessa Brown | 2,357 | 31.80 | +0.41 | |
| Independent | Jayne Bennett | 2,250 | 30.35 | +8.08 | |
| Conservative | Michael Switzer | 1,514 | 20.42 | -0.95 | |
| Green | Mike Butler | 302 | 4.07 | +1.04 | |
| Labour Co-op | Jacqueline Teeboon | 277 | 3.74 | -2.13 | |
| Labour Co-op | Lisa Buckingham | 234 | 3.16 | -2.32 | |
| Liberal Democrat | Roy Alldred | 209 | 2.82 | -2.42 | |
| Green | Liz Petty | 137 | 1.85 | -0.04 | |
| Liberal Democrat | Jo Lake | 133 | 1.79 | -1.67 | |
| Turnout | 4,010 | 50.43 | -5.51 | ||
| Conservative hold | Swing | ||||
| Independent hold | Swing | ||||
Moulsecoomb and Bevendean
| Party | Candidate | Votes | % | ± | |
|---|---|---|---|---|---|
| Labour Co-op | Mo Marsh | 1,018 | 12.52 | -2.96 | |
| Labour Co-op | Anne Meadows | 1,018 | 12.52 | -2.73 | |
| Conservative | Maria Caulfield | 984 | 12.10 | +3.40 | |
| Conservative | Mel Grundy | 983 | 12.09 | +3.66 | |
| Conservative | Elizabeth Kirby | 964 | 11.85 | +3.54 | |
| Labour | Lis Telcs | 848 | 10.43 | -4.80 | |
| Green | Matt Dunton | 468 | 5.76 | +0.73 | |
| Green | Barry Mills | 357 | 4.39 | +0.67 | |
| Respect | David Bangs | 346 | 4.25 | N/A | |
| Green | Morgan Daniels-Yeoman | 333 | 4.09 | +1.09 | |
| Liberal Democrat | Richard Bowden | 320 | 3.94 | -1.79 | |
| Liberal Democrat | Paul Chandler | 268 | 3.30 | -1.36 | |
| Liberal Democrat | Bruce Neave | 225 | 2.77 | -1.85 | |
| Turnout | 2,949 | 27.18 | -9.73 | ||
| Labour Co-op hold | Swing | ||||
| Labour Co-op hold | Swing | ||||
| Conservative gain from Labour Co-op | Swing | ||||
North Portslade
| Party | Candidate | Votes | % | ± | |
|---|---|---|---|---|---|
| Labour Co-op | Bob Carden | 1,141 | 22.75 | -6.62 | |
| Conservative | Trevor Alford | 1,082 | 21.57 | +8.21 | |
| Conservative | Theo Brake-Child | 1,039 | 20.71 | +9.44 | |
| Labour Co-op | Nicole Murphy | 980 | 19.54 | -7.63 | |
| Liberal Democrat | Neville Reginald Searle | 244 | 4.86 | -1.46 | |
| Green | Anthony Ackroyd | 179 | 3.57 | -1.18 | |
| Liberal Democrat | Coreen Sears | 176 | 3.51 | -1.91 | |
| Green | Janette Ackroyd | 175 | 3.49 | +1.14 | |
| Turnout | 2,692 | 35.85 | -12.27 | ||
| Labour Co-op hold | Swing | ||||
| Conservative gain from Labour Co-op | Swing | ||||
Patcham
| Party | Candidate | Votes | % | ± | |
|---|---|---|---|---|---|
| Conservative | Brian Pidgeon | 2,792 | 20.77 | +1.11 | |
| Conservative | Carol Theobald | 2,743 | 20.41 | +1.48 | |
| Conservative | Geoffrey Theobald | 2,702 | 20.10 | +1.38 | |
| Labour Co-op | Peggy Betts | 942 | 7.01 | -1.95 | |
| Labour Co-op | Christine Moody | 821 | 6.11 | -0.72 | |
| Labour Co-op | Rosemary Collins | 803 | 5.98 | -0.68 | |
| Green | Geraldine Keenan | 656 | 4.88 | +2.41 | |
| Green | Mike Sells | 451 | 3.36 | +0.61 | |
| Liberal Democrat | Peter Edward Hughes Bailey | 432 | 3.21 | -1.43 | |
| Green | Julia Wilde | 427 | 3.18 | +0.87 | |
| Liberal Democrat | Bill Taylor | 364 | 2.71 | N/A | |
| Liberal Democrat | Thomas Stokes | 308 | 2.29 | -1.37 | |
| Turnout | 4,742 | 43.94 | -9.28 | ||
| Conservative hold | Swing | ||||
| Conservative hold | Swing | ||||
| Conservative hold | Swing | ||||
Preston Park
| Party | Candidate | Votes | % | ± | |
|---|---|---|---|---|---|
| Green | Amy Kennedy | 1,633 | 12.37 | -1.06 | |
| Labour Co-op | Juliet McCaffery | 1,630 | 12.35 | +1.17 | |
| Labour Co-op | Kevin Allen | 1,474 | 11.16 | +0.48 | |
| Labour Co-op | Nick Jarvis | 1,324 | 10.03 | +0.06 | |
| Green | Simon Williams | 1,185 | 8.98 | -1.09 | |
| Independent | Tracey-Ann Ross | 1,057 | 8.01 | N/A | |
| Green | Andrew Knott | 1,027 | 7.78 | -1.46 | |
| Conservative | Clive Brimmell | 755 | 5.72 | -0.61 | |
| Conservative | Dan Kaufer | 746 | 5.65 | -0.24 | |
| Conservative | Jon Perrin | 724 | 5.48 | -0.21 | |
| Independent | Jo Offer | 644 | 4.88 | N/A | |
| Liberal Democrat | Paul Durden | 438 | 3.32 | -2.77 | |
| Liberal Democrat | Lawrence Eke | 298 | 2.26 | -3.74 | |
| Liberal Democrat | Billy Tipping | 267 | 2.02 | -3.41 | |
| Turnout | 4,767 | 44.91 | -5.00 | ||
| Green hold | Swing | ||||
| Labour Co-op hold | Swing | ||||
| Labour Co-op hold | Swing | ||||
Queen's Park
| Party | Candidate | Votes | % | ± | |
|---|---|---|---|---|---|
| Green | Rachel Fryer | 1,826 | 14.26 | +5.21 | |
| Green | Paul Steedman | 1,549 | 12.10 | +5.04 | |
| Green | Ben Duncan | 1,473 | 11.50 | +5.11 | |
| Labour Co-op | Delia Forester | 1,458 | 11.39 | -1.34 | |
| Labour Co-op | Kenneth Bodfish | 1,455 | 11.36 | -2.15 | |
| Labour Co-op | Simon Burgess | 1,418 | 11.07 | -1.92 | |
| Conservative | Nick Maskell | 926 | 7.23 | -0.24 | |
| Conservative | Ariane Poulain | 820 | 6.40 | -0.87 | |
| Conservative | Gail Woodcock | 752 | 5.87 | -1.32 | |
| Liberal Democrat | Elizabeth Robinson | 369 | 2.88 | -3.23 | |
| Liberal Democrat | Joe Blease | 364 | 2.84 | N/A | |
| Liberal Democrat | Graham Arthur Bucknall | 304 | 2.37 | -2.38 | |
| Independent | John Walshe | 91 | 0.71 | N/A | |
| Turnout | 12,805 | 39.99 | -1.49 | ||
| Green gain from Labour Co-op | Swing | +3.1 | |||
| Green gain from Labour Co-op | Swing | +3.2 | |||
| Green gain from Labour Co-op | Swing | +3.8 | |||
Regency
| Party | Candidate | Votes | % | ± | |
|---|---|---|---|---|---|
| Green | Sven Rufus | 863 | 17.19 | +3.17 | |
| Green | Hermione Roy | 781 | 16.10 | +7.78 | |
| Labour Co-op | Roy Pennington | 565 | 11.65 | -3.17 | |
| Conservative | Michael Macfarlane | 525 | 10.82 | +1.47 | |
| Conservative | Robert Nemeth | 516 | 10.64 | +1.88 | |
| Liberal Democrat | Sue Bucknall | 454 | 9.36 | -6.15 | |
| Labour Co-op | Daniel Yates | 447 | 9.21 | -5.29 | |
| Liberal Democrat | Kevin Donnelly | 425 | 8.76 | -5.96 | |
| Brighton and Hove Independents | Corinne Attwood | 218 | 4.49 | N/A | |
| Brighton and Hove Independents | Tony Davenport | 57 | 1.18 | N/A | |
| Turnout | 2,569 | 33.75 | -1.35 | ||
| Green gain from Liberal Democrat | Swing | ||||
| Green gain from Labour Co-op | Swing | ||||
Rottingdean Coastal
| Party | Candidate | Votes | % | ± | |
|---|---|---|---|---|---|
| Conservative | Lynda Hyde | 2,803 | 20.68 | +0.07 | |
| Conservative | David Smith | 2,679 | 19.77 | +1.43 | |
| Conservative | Mary Mears | 2,665 | 19.66 | +1.51 | |
| Green | Geoffrey Bowden | 932 | 6.88 | +2.16 | |
| Green | Anita Gilson | 827 | 6.10 | +2.66 | |
| Green | Janet Hale | 777 | 5.73 | +2.74 | |
| Labour Co-op | Neil Mercer | 580 | 4.28 | -1.64 | |
| Liberal Democrat | Dawn Davidson | 558 | 4.12 | -0.95 | |
| Liberal Democrat | Birgit Hunter | 490 | 3.62 | -1.45 | |
| Labour Co-op | Mohammed Asaduzzaman | 454 | 3.35 | -1.94 | |
| Labour Co-op | Ian Tinlin | 452 | 3.34 | -1.35 | |
| Liberal Democrat | Shervin Sharghy | 336 | 2.48 | -1.24 | |
| Turnout | 4,422 | 41.75 | -12.01 | ||
| Conservative hold | Swing | ||||
| Conservative hold | Swing | ||||
| Conservative hold | Swing | ||||
South Portslade
| Party | Candidate | Votes | % | ± | |
|---|---|---|---|---|---|
| Labour Co-op | Leslie Hamilton | 1,119 | 21.34 | -1.89 | |
| Conservative | Steve Harmer-Strange | 1,061 | 20.23 | +5.83 | |
| Conservative | Peter Lockyer | 1,041 | 19.85 | +7.47 | |
| Labour Co-op | Sue John | 998 | 19.03 | +0.32 | |
| Green | Kate Chapman | 315 | 6.01 | +2.32 | |
| Liberal Democrat | Ken Rist | 279 | 5.32 | +0.09 | |
| Liberal Democrat | Peter Denyer | 242 | 4.61 | -0.34 | |
| Green | Steve Watson | 189 | 3.60 | +0.05 | |
| Turnout | 2,781 | 40.70 | -5.91 | ||
| Labour Co-op hold | Swing | ||||
| Conservative gain from Labour Co-op | Swing | ||||
St Peter's and North Laine
| Party | Candidate | Votes | % | ± | |
|---|---|---|---|---|---|
| Green | Keith Taylor | 2,303 | 19.20 | +1.93 | |
| Green | Pete West | 2,112 | 17.60 | +0.92 | |
| Green | Ian Davey | 2,099 | 17.50 | +0.91 | |
| Labour Co-op | Sarah Ogden | 979 | 8.16 | -0.67 | |
| Labour Co-op | Greg Hadfeild | 921 | 7.68 | -0.44 | |
| Labour Co-op | George Moody | 883 | 7.36 | -0.69 | |
| Conservative | Mike Long | 505 | 4.21 | +0.72 | |
| Conservative | Hans Miles | 499 | 4.16 | +0.67 | |
| Conservative | Jo Woodward | 444 | 3.70 | +0.23 | |
| Liberal Democrat | Martin Lindsay-Hills | 371 | 3.10 | -1.59 | |
| Liberal Democrat | Graham Hunnable | 310 | 2.58 | -1.93 | |
| Independent | Debbie Dawes | 286 | 2.38 | N/A | |
| Liberal Democrat | William Parker | 285 | 2.38 | -1.43 | |
| Turnout | 4,204 | 34.12 | -6.47 | ||
| Green hold | Swing | ||||
| Green hold | Swing | ||||
| Green hold | Swing | ||||
Westbourne
| Party | Candidate | Votes | % | ± | |
|---|---|---|---|---|---|
| Conservative | Brian Oxley | 1,488 | 26.67 | +3.61 | |
| Conservative | Denise Cobb | 1,458 | 26.13 | +3.86 | |
| Labour Co-op | Debbie Lunn | 670 | 12.01 | -2.06 | |
| Labour Co-op | Alan Robins | 544 | 9.75 | -2.90 | |
| Green | Louisa Greenbaum | 450 | 8.06 | +2.49 | |
| Green | Ollie Sykes | 450 | 8.06 | +4.56 | |
| Liberal Democrat | Clive Jarvis | 268 | 4.80 | -5.48 | |
| Liberal Democrat | Howard Spencer | 253 | 2.53 | -6.07 | |
| Turnout | 2,881 | 38.86 | -8.07 | ||
| Conservative hold | Swing | ||||
| Conservative hold | Swing | ||||
Wish
| Party | Candidate | Votes | % | ± | |
|---|---|---|---|---|---|
| Conservative | Garry Peltzer Dunn | 1,596 | 25.70 | +2.74 | |
| Conservative | Ted Kemble | 1,523 | 24.52 | +2.89 | |
| Labour Co-op | Mark Wright | 814 | 13.11 | -6.33 | |
| Labour Co-op | Malcolm Prescott | 801 | 12.90 | -4.75 | |
| Green | Liz Wakefield | 458 | 7.37 | +4.31 | |
| Green | Sally Glaskin | 271 | 4.36 | -0.24 | |
| Liberal Democrat | Mark Lawrence Collins | 269 | 4.33 | -2.12 | |
| Liberal Democrat | Dinah Staples | 350 | 4.03 | -0.18 | |
| Protest Vote | Mark Stack | 229 | 3.69 | N/A | |
| Turnout | 3,237 | 46.58 | -8.47 | ||
| Conservative hold | Swing | ||||
| Conservative hold | Swing | ||||
Withdean
| Party | Candidate | Votes | % | ± | |
|---|---|---|---|---|---|
| Conservative | Pat Drake | 2,094 | 15.57 | -1.50 | |
| Conservative | Ann Norman | 2,066 | 15.36 | -1.45 | |
| Conservative | Ken Norman | 2,004 | 14.90 | -1.72 | |
| Brighton and Hove Independents | Michael Whitty | 756 | 5.62 | N/A | |
| Labour Co-op | Mike Middleton | 751 | 5.58 | -0.52 | |
| Labour Co-op | Gary Thurston | 729 | 5.42 | -1.50 | |
| Green | Eddie Wearing | 719 | 5.35 | +0.81 | |
| Labour Co-op | Jack Kiffin | 692 | 5.14 | -1.40 | |
| Brighton and Hove Independents | James Simister | 679 | 5.05 | N/A | |
| Green | Lynn Mackenzie | 668 | 4.97 | +0.83 | |
| Brighton and Hove Independents | Simon Swan | 605 | 4.50 | N/A | |
| Green | Omar Jebari | 509 | 3.78 | +0.90 | |
| Liberal Democrat | John Lovatt | 434 | 3.23 | -2.87 | |
| Liberal Democrat | Robert Stockman | 384 | 2.86 | -2.81 | |
| Liberal Democrat | Hyder Khalil | 360 | 2.68 | -2.78 | |
| Turnout | 4,714 | 43.68 | -10.06 | ||
| Conservative hold | Swing | ||||
| Conservative hold | Swing | ||||
| Conservative hold | Swing | ||||
Woodingdean
| Party | Candidate | Votes | % | ± | |
|---|---|---|---|---|---|
| Conservative | Dee Simson | 1,843 | 33.15 | +1.46 | |
| Conservative | Geoff Wells | 1,840 | 33.09 | +0.83 | |
| Labour Co-op | Karen Barford | 549 | 9.87 | -2.47 | |
| Labour Co-op | Mark Maguire | 502 | 9.03 | -2.39 | |
| Liberal Democrat | Joy DeSouza | 237 | 4.26 | +0.53 | |
| Green | Alan Pegg | 221 | 3.97 | +1.16 | |
| Green | Nellie Jones | 192 | 3.45 | +1.48 | |
| Liberal Democrat | Rosemary Lovatt | 176 | 3.17 | -0.60 | |
| Turnout | 2,902 | 38.84 | -16.49 | ||
| Conservative hold | Swing | ||||
| Conservative hold | Swing | ||||
External links
- Results on council site
- Results on BBC site
- Images and video from inside the polling stations and count
| East Sussex County Council | |
|---|---|
| Brighton and Hove City Council | |
| Eastbourne Borough Council | |
| Hastings Borough Council | |
| Lewes District Council |
|
| Rother District Council | |
| Wealden District Council | |
| Brighton Borough Council |
|
| Hove Borough Council |
|
| |