Aberdeen City Council election, 2007
Aberdeen City Council election, 2007
|
|
|
|
|
|
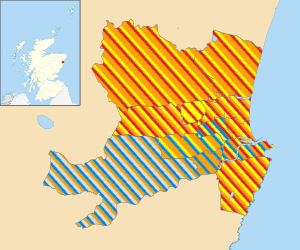
| The 13 multi-member wards |
|
Council Leader after election
TBD
|
|
|
The 2007 Aberdeen City Council election took place on 3 May 2007 to elect members of Aberdeen City Council, at the same time as the Scottish Parliament general election. The election was the first one using 13 new wards created as a result of the Local Governance (Scotland) Act 2004, with each ward electing three or four councillors using the single transferable vote system a form of proportional representation. The new wards replaced 43 single-member wards, which used the plurality (first past the post) system of election.
The results saw the council remain under no overall control.[1]
Election results
Ward results
| Airyhall/Broomhill/Garthdee - 3 seats[2][3] |
| Party | Candidate | % 1st Pref | Count 1 | Count 2 | Count 3 | Count 4 |
|
Conservative |
Jill Wisely |
27.4 |
1,911 |
|
|
|
|
Liberal Democrats |
Scott Cassie |
19.6 |
1,365 |
1,381 |
1,446 |
1,695 |
|
Liberal Democrats |
Ian Yuill |
18.0 |
1,257 |
1,310 |
1,385 |
1,565 |
|
SNP |
Rigg Robertson |
17.3 |
1,207 |
1,220 |
1,296 |
1,399 |
|
Labour |
Allan McIntosh |
12.8 |
894 |
901 |
940 |
|
|
Independent |
Graham Bennett |
4.8 |
332 |
352 |
|
|
| Electorate: Valid: 6,966 Spoilt: 80 Quota: 1,742 Turnout: 7,046 |
| Bridge of Don - 4 seats[2][3] |
| Party | Candidate | % 1st Pref | Count 1 | Count 2 | Count 3 | Count 4 | Count 5 | Count 6 |
|
SNP |
Muriel Jaffrey |
36.3 |
2,805 |
|
|
|
|
|
|
Labour |
Willie Young |
20.9 |
1,615 |
1,615 |
|
|
|
|
|
Liberal Democrats |
John Reynolds† |
18.3 |
1,411 |
1,573 |
1,573 |
|
|
|
|
Liberal Democrats |
Gordon Leslie††††† |
9.5 |
731 |
921 |
929 |
938 |
977 |
1,316 |
|
Conservative |
Brian Davidson |
7.9 |
610 |
726 |
731 |
733 |
783 |
827 |
|
Liberal Democrats |
Millie McLeod |
5.2 |
404 |
509 |
523 |
535 |
587 |
|
|
Independent |
Hamish Mackay |
1.9 |
146 |
267 |
272 |
273 |
|
|
| Electorate: Valid: 7,722 Spoilt: 92 Quota: 1,545 Turnout: 7,814 |
| Dyce/Buckburn/Danestone - 4 seats[2][3] |
| Party | Candidate | % 1st Pref | Count 1 | Count 2 | Count 3 | Count 4 | Count 5 | Count 6 | Count 7 |
|
SNP |
Mark McDonald |
36.2 |
2,620 |
|
|
|
|
|
|
|
Labour |
Barney Crockett |
24.9 |
1,801 |
1,801 |
|
|
|
|
|
|
Liberal Democrats |
Ron Clark |
21.2 |
1,534 |
1,534 |
1,534 |
|
|
|
|
|
Liberal Democrats |
George Penny |
5.0 |
360 |
593 |
667 |
713 |
727 |
769 |
885 |
|
Conservative |
Avril MacKenzie |
8.3 |
603 |
701 |
730 |
738 |
752 |
781 |
833 |
|
Scottish Green |
Rhonda Reekie |
2.0 |
147 |
298 |
330 |
335 |
348 |
409 |
|
|
Independent |
Angela Dunn |
1.6 |
116 |
190 |
211 |
214 |
260 |
|
|
|
Independent |
Dennis Grattan |
0.8 |
57 |
117 |
131 |
133 |
|
|
|
| Electorate: Valid: 7,238 Spoilt: 111 Quota: 1,448 Turnout: 7,349 |
| George Street/Harbour - 3 seats[2][3] |
| Party | Candidate | % 1st Pref | Count 1 | Count 2 | Count 3 | Count 4 | Count 5 |
|
SNP |
Andrew May |
32.4 |
1,272 |
|
|
|
|
|
Labour |
Jim Hunter†††††† |
24.5 |
960 |
994 |
|
|
|
|
Liberal Democrats |
John Stewart |
20.4 |
801 |
859 |
860 |
963 |
1,071 |
|
Scottish Green |
Clive Kempe |
7.8 |
306 |
364 |
365 |
414 |
492 |
|
Labour |
George Penny |
8.2 |
322 |
343 |
351 |
382 |
|
|
Conservative |
Alexander Olsen |
6.7 |
261 |
282 |
282 |
|
|
| Electorate: Valid: 3,922 Spoilt: 91 Quota: 981 Turnout: 4,013 |
| Hazlehead/Ashley/Queens Cross - 4 seats[2][3] |
| Party | Candidate | % 1st Pref | Count 1 | Count 2 | Count 3 | Count 4 | Count 5 | Count 6 | Count 7 |
|
Liberal Democrats |
Martin Greig |
24.0 |
1,901 |
|
|
|
|
|
|
|
Conservative |
Jim Farquharson††† |
21.8 |
1,728 |
1,728 |
|
|
|
|
|
|
Liberal Democrats |
Jennifer Stewart |
20.4 |
1,614 |
1,614 |
1,614 |
|
|
|
|
|
SNP |
John West |
14.2 |
1,126 |
1,168 |
1,172 |
1,175 |
1,195 |
1,273 |
1,352 |
|
Labour |
Timothy Harris |
10.8 |
855 |
904 |
906 |
910 |
917 |
972 |
1,041 |
|
Conservative |
Fraser Forsyth |
5.1 |
406 |
457 |
573 |
578 |
583 |
614 |
|
|
Scottish Green |
Rachel Shanks |
2.8 |
220 |
264 |
266 |
270 |
285 |
|
|
|
Scottish Socialist |
Howard Chandler |
0.8 |
65 |
69 |
69 |
70 |
|
|
|
| Electorate: Valid: 7,915 Spoilt: 83 Quota: 1,584 Turnout: 7,998 |
| Hilton/Stockethill - 3 seats[2][3] |
| Party | Candidate | % 1st Pref | Count 1 | Count 2 | Count 3 | Count 4 |
|
SNP |
Kirsty West |
33.9 |
1,761 |
|
|
|
|
Labour |
George Adam |
30.6 |
1,589 |
1,589 |
|
|
|
Liberal Democrats |
Neil Fletcher |
20.6 |
1,068 |
1,195 |
1,219 |
1,388 |
|
Labour |
Charlie Pirie |
8.6 |
444 |
532 |
745 |
792 |
|
Conservative |
Frank Webster |
6.3 |
329 |
371 |
375 |
|
| Electorate: Valid: 5,191 Spoilt: 130 Quota: 1,298 Turnout: 5,321 |
| Kincorth/Loirston - 3 seats[2][3] |
| Party | Candidate | % 1st Pref | Count 1 | Count 2 | Count 3 | Count 4 | Count 5 | Count 6 | Count 7 |
|
SNP |
Callum McCaig |
32.0 |
1,883 |
|
|
|
|
|
|
|
Liberal Democrats |
Katharine Dean |
20.2 |
1,190 |
1,262 |
1,270 |
1,309 |
1,462 |
1,610 |
|
|
Labour |
Neil Cooney |
19.8 |
1,162 |
1,205 |
1,214 |
1,237 |
1,260 |
1,298 |
1,321 |
|
Labour |
Sue Rae |
12.7 |
748 |
782 |
792 |
826 |
843 |
889 |
992 |
|
Conservative |
Graeme Webster |
7.2 |
423 |
441 |
447 |
473 |
493 |
|
|
|
Liberal Democrats |
Angus Easton |
4.1 |
239 |
260 |
266 |
283 |
|
|
|
|
Independent |
Daniel Yeats |
3.0 |
179 |
206 |
224 |
|
|
|
|
|
Solidarity |
Paul Mitcheson |
1.0 |
58 |
84 |
|
|
|
|
|
| Electorate: Valid: 5,882 Spoilt: 132 Quota: 1,471 Turnout: 6,024 |
| Kingswells/Sheddocksley - 3 seats[2][3] |
| Party | Candidate | % 1st Pref | Count 1 | Count 2 | Count 3 | Count 4 | Count 5 | Count 6 |
|
SNP |
Wendy Stuart |
33.6 |
1,746 |
|
|
|
|
|
|
Liberal Democrats |
Peter Stephen |
24.3 |
1,260 |
1,312 |
|
|
|
|
|
Labour |
Len Ironside |
16.3 |
848 |
899 |
900 |
910 |
935 |
987 |
|
Labour |
Rose Clayton |
14.6 |
758 |
810 |
811 |
826 |
872 |
958 |
|
Conservative |
Bill Berry |
7.0 |
364 |
388 |
389 |
407 |
454 |
|
|
Liberal Democrats |
David Young |
2.6 |
135 |
180 |
187 |
210 |
|
|
|
BNP |
Steven Thomson |
1.6 |
81 |
111 |
112 |
|
|
|
| Electorate: Valid: 5,192 Spoilt: 98 Quota: 1,299 Turnout: 5,290 |
| Lower Deeside - 3 seats[2][3] |
| Party | Candidate | % 1st Pref | Count 1 | Count 2 | Count 3 | Count 4 | Count 5 |
|
Liberal Democrats |
Aileen Malone |
23.9 |
1,536 |
1,660 |
|
|
|
|
Conservative |
Alan Milne†††† |
24.0 |
1,546 |
1,588 |
1,592 |
1,745 |
|
|
Independent |
Marie Boulton |
17.1 |
1,097 |
1,173 |
1,176 |
1,353 |
1,399 |
|
SNP |
David Adams |
16.6 |
1,068 |
1,125 |
1,127 |
1,234 |
1,253 |
|
Liberal Democrats |
Brian Malone |
9.4 |
603 |
692 |
726 |
|
|
|
Labour |
Marianne Stewart |
9.1 |
583 |
|
|
|
|
| Electorate: Valid: 6,435 Spoilt: 69 Quota: 1,609 Turnout: 6,504 |
| Midstocket/Rosemount - 3 seats[2][3] |
| Party | Candidate | % 1st Pref | Count 1 | Count 2 | Count 3 | Count 4 | Count 5 |
|
Conservative |
John Porter |
27.7 |
1,503 |
|
|
|
|
|
SNP |
Bill Cormie |
26.3 |
1,431 |
1,431 |
|
|
|
|
Labour |
Jenny Laing |
21.1 |
1,144 |
1,164 |
1,176 |
1,223 |
1,281 |
|
Liberal Democrats |
Steve Delaney |
12.4 |
671 |
689 |
702 |
753 |
1,201 |
|
Liberal Democrats |
Jim Donaldson |
9.7 |
529 |
563 |
570 |
586 |
|
|
Scottish Socialist |
Christine Chandler |
2.8 |
153 |
155 |
167 |
|
|
| Electorate: Valid: 5,431 Spoilt: 60 Quota: 1,358 Turnout: 5,491 |
| Northfield - 3 seats[2][3] |
| Party | Candidate | % 1st Pref | Count 1 | Count 2 | Count 3 | Count 4 |
|
SNP |
Jackie Dunbar |
30.9 |
1,557 |
|
|
|
|
Labour |
Gordon Graham |
27.8 |
1,401 |
1,401 |
|
|
|
SNP |
Kevin Stewart |
20.8 |
1,050 |
1,249 |
1,258 |
1,281 |
|
Labour |
Ramsey Milne |
11.6 |
587 |
603 |
698 |
722 |
|
Liberal Democrats |
Karen Freel |
6.0 |
302 |
320 |
326 |
368 |
|
Conservative |
Pat Wokoma |
2.8 |
143 |
145 |
146 |
|
| Electorate: Valid: 5,040 Spoilt: 203 Quota: 1,261 Turnout: 5,243 |
| Tillydrone/Seaton/Old Aberdeen - 3 seats[2][3] |
| Party | Candidate | % 1st Pref | Count 1 | Count 2 | Count 3 | Count 4 | Count 5 | Count 6 |
|
SNP |
Jim Noble |
31.9 |
1,365 |
|
|
|
|
|
|
Labour |
Norman Collie†† |
25.1 |
1,074 |
1,074 |
|
|
|
|
|
Liberal Democrats |
Richard Robertson |
13.7 |
585 |
638 |
638 |
659 |
799 |
926 |
|
Labour |
Sandra Macdonald |
13.9 |
595 |
634 |
635 |
648 |
718 |
791 |
|
Conservative |
Hannah Dolan |
7.8 |
333 |
347 |
347 |
354 |
377 |
|
|
Scottish Green |
Daniel Johnston |
5.7 |
244 |
289 |
289 |
329 |
|
|
|
Solidarity |
Angela McLeman |
2.1 |
88 |
110 |
110 |
|
|
|
| Electorate: Valid: 4,284 Spoilt: 109 Quota: 1,072 Turnout: 4,393 |
| Torry/Ferryhill - 4 seats[2][3] |
| Party | Candidate | % 1st Pref | Count 1 | Count 2 | Count 3 | Count 4 | Count 5 | Count 6 | Count 7 | Count 8 |
|
SNP |
Jim Kiddie |
30.9 |
1,900 |
|
|
|
|
|
|
|
|
Labour |
Yvonne Allan |
20.7 |
1,275 |
1,275 |
|
|
|
|
|
|
|
Liberal Democrats |
Irene Cormack |
17.5 |
1,077 |
1,155 |
1,160 |
1,169 |
1,202 |
1,397 |
|
|
|
Conservative |
Alan Donnelly |
11.9 |
729 |
757 |
758 |
762 |
796 |
818 |
846 |
889 |
|
Scottish Green |
John Reekie |
4.7 |
287 |
386 |
388 |
431 |
476 |
528 |
564 |
672 |
|
Labour |
Ted Harris |
5.7 |
348 |
415 |
440 |
458 |
478 |
511 |
538 |
|
|
Liberal Democrats |
Tony Petchey |
4.4 |
270 |
334 |
335 |
345 |
364 |
|
|
|
|
Independent |
Chris Cowie |
2.6 |
163 |
198 |
199 |
219 |
|
|
|
|
|
Solidarity |
Shug Falconer |
1.7 |
102 |
150 |
151 |
|
|
|
|
|
| Electorate: Valid: 6,151 Spoilt: 112 Quota: 1,231 Turnout: 6,263 |
Changes since 2007 Election
- † In March 2012, Bridge of Don Cllr John Reynolds resigned from the Liberal Democrats and now sits as an Independent.
- †† In January 2011, Tillydrone/Seaton/Old Aberdeen Cllr Norman Collie resigned from the Labour Party and now sits as an Independent.
- ††† In June 2011, Hazlehead/Ashley/Queens Cross Cllr Jim Farquaharson was expelled from the Conservative Party and now sits as an Independent.
- †††† In June 2011, Lower Deeside Cllr Alan Milne was expelled from the Conservative Party and now sits as an Independent.
- ††††† In September 2011, Bridge of Don Cllr Gordon Leslie was suspended from the Liberal Democrats. He subsequently resigned from the party and now sits as an Independent.
- †††††† In February 2012, George Street/Harbour Cllr Jim Hunter was suspended from the Labour Party. He subsequently resigned from the party and now sits as an Independent.
By-Elections since 3 May 2007
- A by-election was held in the Midstocket/Rosemount Ward following the death of the Conservative's John Porter on 23 May 2007. The by-election was won by the SNP's John Corall on 16 August 2007
| Midstocket/Rosemount by-election 16 August 2007 - 1 Seat[4] |
| Party | Candidate | % 1st Pref | Count 1 | Count 2 | Count 3 | Count 4 | Count 5 |
|
SNP |
John Corall |
29.5 |
873 |
875 |
885 |
984 |
1,258 |
|
Conservative |
Fraser Forsyth |
27.8 |
821 |
825 |
826 |
873 |
1,122 |
|
Liberal Democrats |
Steve Delaney |
23.4 |
693 |
700 |
708 |
869 |
|
|
Labour |
Allan McIntosh |
17.5 |
518 |
520 |
529 |
|
|
|
Solidarity |
Stephen Haddan |
1.1 |
31 |
33 |
|
|
|
|
Independent |
Dennis Grattan |
0.7 |
20 |
|
|
|
|
|
SNP gain from Conservative |
Swing |
|
|
| Electorate: 10,288 Valid: 2,956 Spoilt: 21 Quota: 1,479 Turnout: 2,977 (28.9%) |
- A by-election was held in the Dyce/Bucksburn/Danestone Ward following the death of the Liberal Democrat's Ron Clark on 21 February 2011. The by-election was won by the SNP's Neil MacGregor on 19 May 2011
- A by-election was held in the Airyhall/Broomhill/Garthdee Ward following the resignation of the Liberal Democrat's Scott Cassie on 27 April 2011 after he was jailed for embezzlement. The by-election was won by the SNP's Gordon Scott Townson on 23 June 2011.
| Airyhall/Broomhill/Garthdee by-election 23 June 2011 - 1 Seat[6] |
| Party | Candidate | % 1st Pref | Count 1 | Count 2 | Count 3 | Count 4 | Count 5 | Count 6 | Count 7 | Count 8 |
|
SNP |
Gordon Scott Townson |
33.2 |
1,112 |
1,115 |
1,120 |
1,136 |
1,161 |
1,263 |
1,441 |
1,792 |
|
Labour |
Angela Taylor |
23.3 |
783 |
783 |
784 |
810 |
829 |
956 |
1,068 |
|
|
Conservative |
Bill Berry |
19.4 |
649 |
652 |
654 |
656 |
676 |
801 |
|
|
|
Liberal Democrats |
Gregor McAbery |
16.5 |
554 |
558 |
562 |
584 |
599 |
|
|
|
|
Independent |
Graham Murray Bennett |
2.9 |
98 |
99 |
109 |
122 |
|
|
|
|
|
Scottish Green |
Richie Brian |
3.0 |
101 |
103 |
104 |
|
|
|
|
|
|
Independent |
Hamish Hay Mackay |
1.0 |
32 |
34 |
|
|
|
|
|
|
|
National Front |
Dave Macdonald |
0.7 |
25 |
|
|
|
|
|
|
|
|
SNP gain from Liberal Democrats |
Swing |
18.5% |
|
| Electorate: 11,623 Valid: 3,354 Spoilt: 32 Quota: 1,678 Turnout: 3,386 (29.1%) |
References