Brighton and Hove City Council election, 2003
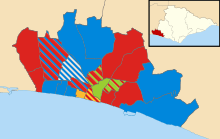
Map of results of the 2003 election, by ward.
Elections to Brighton and Hove City Council on the south coast of England were held on 1 May 2003. The whole council (a unitary authority) was up for election and all 54 councillors were elected from 21 wards.[1] Labour lost control of the council and no party had majority of seats so the council came under no overall control.
Following the election, the composition of the council was as follows:
| Party | Seats | ± | |
|---|---|---|---|
| Labour | 24 | -10 | |
| Conservative | 20 | –3 | |
| Green Party | 6 | +3 | |
| Liberal Democrat | 3 | –2 | |
| Independent | 1 | –2 | |
Results
| Brighton & Hove Election Result 2003 | ||||||||||
|---|---|---|---|---|---|---|---|---|---|---|
| Party | Seats | Gains | Losses | Net gain/loss | Seats % | Votes % | Votes | +/− | ||
| Labour Co-op | 24 | -20 | 44.44% | 31.71% | 70,412 | |||||
| Conservative | 20 | -3 | 37.04% | 34.49% | 76,578 | |||||
| Green | 6 | +3 | 11.11% | 16.58% | 36,810 | |||||
| Liberal Democrat | 3 | -2 | 5.56% | 15.13% | 33,586 | |||||
| Independent | 1 | -2 | 1.85% | 1.48% | 3,286 | |||||
| Socialist Alliance | 0 | 0 | 0 | 0 | 0% | 0.21% | 476 | |||
| Socialist Labour | 0 | 0 | 0 | 0 | 0% | 0.16% | 357 | |||
| BNP | 0 | 0 | 0 | 0 | 0% | 0.14% | 314 | |||
| UKIP | 0 | 0 | 0 | 0 | 0% | 0.09% | 197 | |||
- note: Socialist Alliance stood as Socialist Alliance Against The War
Ward Results
Brunswick and Adelaide
| Party | Candidate | Votes | % | ± | |
|---|---|---|---|---|---|
| Liberal Democrat | Paul Elgood | 1,222 | 29.40 | ||
| Liberal Democrat | David Watkins | 1,103 | 26.54 | ||
| Labour Co-op | Daniel Fox | 622 | 14.97 | ||
| Labour Co-op | John Warmington | 542 | 13.04 | ||
| Green | Felicity Tanous | 291 | 7.00 | ||
| Conservative | Harry Haynes | 269 | 6.47 | ||
| Conservative | Debra Wade | 266 | 6.40 | ||
| Independent | Nigel Furness | 63 | 1.16 | ||
| Independent | Valentine Hogan | 47 | 1.13 | ||
| Turnout | 32.98 | ||||
Central Hove
| Party | Candidate | Votes | % | ± | |
|---|---|---|---|---|---|
| Conservative | Averil Older | 1,092 | 19.64 | ||
| Conservative | Jan Young | 1,062 | 19.10 | ||
| Liberal Democrat | Jenny Barnard-Langston | 884 | 15.90 | ||
| Liberal Democrat | Mark Barnard | 847 | 15.23 | ||
| Labour Co-op | Christopher Wainwright | 544 | 9.78 | ||
| Labour Co-op | Alun Jones | 513 | 9.23 | ||
| Green | Michael Butler | 327 | 5.88 | ||
| Green | Jacqueline DaCosta | 291 | 5.23 | ||
| Turnout | 41.58 | ||||
East Brighton
| Party | Candidate | Votes | % | ± | |
|---|---|---|---|---|---|
| Labour Co-op | Gilliam Mitchell | 1,545 | 14.12 | ||
| Labour Co-op | Warren Morgan | 1,451 | 13.26 | ||
| Labour Co-op | Craig Turton | 1,223 | 11.18 | ||
| Conservative | Edward Faulkner | 1,062 | 9.71 | ||
| Conservative | Sally Wells | 1,017 | 9.30 | ||
| Conservative | Ian Middleton | 976 | 8.92 | ||
| Liberal Democrat | Richard Bowden | 770 | 7.04 | ||
| Liberal Democrat | John Barrow | 682 | 6.23 | ||
| Green | Diana Hicks | 623 | 5.69 | ||
| Liberal Democrat | Thomas William Stokes | 553 | 5.05 | ||
| Green | Julia Knowles | 475 | 4.34 | ||
| Green | Stephen McLaren Watson | 396 | 3.62 | ||
| Socialist Labour | John McLeod | 167 | 1.53 | ||
| Turnout | 38.6 | ||||
Goldsmid
| Party | Candidate | Votes | % | ± | |
|---|---|---|---|---|---|
| Conservative | Anne Giebeler | 1,521 | 10.92 | ||
| Labour Co-op | Simon Battle | 1,495 | 10.73 | ||
| Labour Co-op | Vincent Meegan | 1,490 | 10.70 | ||
| Labour Co-op | Frieda Warman-Brown | 1,463 | 10.50 | ||
| Conservative | Steven Harmer-Strange | 1,456 | 10.45 | ||
| Conservative | Brian Rowe | 1,451 | 10.42 | ||
| Liberal Democrat | Bob Bailey | 1,100 | 7.90 | ||
| Liberal Democrat | Josephine Lake | 1,019 | 7.32 | ||
| Green | Susan Board | 881 | 6.33 | ||
| Liberal Democrat | Ronald Bakere | 877 | 6.30 | ||
| Green | Jenny Deadman | 633 | 4.55 | ||
| Green | Gordon Hudson | 541 | 3.88 | ||
| Turnout | 43.73 | ||||
Hangleton and Knoll
| Party | Candidate | Votes | % | ± | |
|---|---|---|---|---|---|
| Labour Co-op | Brian Fitch | 2,550 | 15.25 | ||
| Labour Co-op | Gerry Kielty | 2,394 | 14.32 | ||
| Conservative | Peter Willows | 2,449 | 14.65 | ||
| Conservative | Dawn Barnett | 2,315 | 13.85 | ||
| Labour Co-op | James Edward | 2,175 | 13.01 | ||
| Conservative | Stephen Wade | 2,123 | 12.70 | ||
| Liberal Democrat | David Sears | 517 | 3.09 | ||
| Liberal Democrat | Emily Pearson | 477 | 2.85 | ||
| Green | Lucette Forrest | 448 | 2.68 | ||
| Liberal Democrat | Lee Shingles | 434 | 2.60 | ||
| Green | Jean Jones | 270 | 1.62 | ||
| Socialist Alliance | Maggie Clifford | 210 | 1.26 | ||
| Green | Matthew Dunton | 207 | 1.24 | ||
| Independent | Gregory McAusland | 149 | 0.89 | ||
| Turnout | 56.31 | ||||
Hanover and Elm Grove
| Party | Candidate | Votes | % | ± | |
|---|---|---|---|---|---|
| Green | Joseph Randall | 2,198 | 16.05 | ||
| Green | Georgia Wrighton | 1,895 | 13.84 | ||
| Labour Co-op | Joyce Edmond-Smith | 1,886 | 13.77 | ||
| Labour Co-op | John Ballance | 1,722 | 12.57 | ||
| Labour Co-op | John Newington | 1,510 | 11.03 | ||
| Green | Robert Jarrett | 1,382 | 10.09 | ||
| Liberal Democrat | Diana Owen | 517 | 3.77 | ||
| Conservative | James Roochove | 489 | 3.57 | ||
| Conservative | Luke McCabe | 466 | 3.40 | ||
| Liberal Democrat | Martin Lindsay-Hills | 460 | 3.36 | ||
| Conservative | Peter Neish | 455 | 3.32 | ||
| Liberal Democrat | Graham Hunnable | 450 | 3.29 | ||
| Socialist Alliance | David Fellows | 266 | 1.94 | ||
| Turnout | 44.76 | ||||
Hollingbury and Stanmer
| Party | Candidate | Votes | % | ± | |
|---|---|---|---|---|---|
| Labour Co-op | Jeane Lepper | 1,882 | 16.36 | ||
| Labour Co-op | Pat Hawkes | 1,711 | 14.88 | ||
| Labour Co-op | Tehmtan Framroze | 1,680 | 14.61 | ||
| Conservative | Carol Ramsden | 1,006 | 8.75 | ||
| Conservative | Roger McCabe | 977 | 8.49 | ||
| Conservative | Michael Weatherley | 914 | 7.95 | ||
| Green | Anthony Ackroyd | 669 | 5.82 | ||
| Liberal Democrat | Matthew Barker | 494 | 4.30 | ||
| Green | Amelia Mills | 478 | 4.16 | ||
| Liberal Democrat | Ellen Woolley | 457 | 3.97 | ||
| Liberal Democrat | Hector Gow | 375 | 3.26 | ||
| Green | Steven Sorrell | 339 | 2.95 | ||
| Independent | Anthony Greenstein | 329 | 2.86 | ||
| Socialist Labour | Ian Fyvie | 190 | 1.65 | ||
| Turnout | 37.91 | ||||
Moulsecoomb and Bevendean
| Party | Candidate | Votes | % | ± | |
|---|---|---|---|---|---|
| Labour Co-op | Francis Tonks | 1,659 | 15.48 | ||
| Labour Co-op | Anne Meadows | 1,635 | 15.25 | ||
| Labour | Jack Hazelgrove | 1,632 | 15.23 | ||
| Conservative | Joan Champion | 933 | 8.70 | ||
| Conservative | Brian Dando | 903 | 8.43 | ||
| Conservative | Martin Smith | 891 | 8.31 | ||
| Liberal Democrat | Andrea Bain | 614 | 5.73 | ||
| Green | Kate Chapman | 539 | 5.03 | ||
| Liberal Democrat | Paul Durden | 500 | 4.66 | ||
| Liberal Democrat | Bernard Huggins | 495 | 4.62 | ||
| Green | Barry Mills | 399 | 3.72 | ||
| Green | Ian Needham | 322 | 3.00 | ||
| UKIP | Ian Hills | 197 | 1.84 | ||
| Turnout | 36.91 | ||||
North Portslade
| Party | Candidate | Votes | % | ± | |
|---|---|---|---|---|---|
| Labour Co-op | Robert Carden | 1,897 | 29.37 | ||
| Labour Co-op | Donald Turner | 1,755 | 27.17 | ||
| Conservative | Timothy Catt | 863 | 13.36 | ||
| Conservative | Harinder Gill | 728 | 11.27 | ||
| Liberal Democrat | Ann Barnard | 408 | 6.32 | ||
| Liberal Democrat | Anthony Barnard | 350 | 5.42 | ||
| Green | Deborah McElroy | 307 | 4.75 | ||
| Green | Guy Richardson | 152 | 2.35 | ||
| Turnout | 48.12 | ||||
Patcham
| Party | Candidate | Votes | % | ± | |
|---|---|---|---|---|---|
| Conservative | Brian Pidgeon | 3,120 | 19.66 | ||
| Conservative | Carol Theobald | 3,003 | 18.93 | ||
| Conservative | Geoffrey Theobald | 2,970 | 18.72 | ||
| Labour Co-op | Derek Betts | 1,421 | 8.96 | ||
| Labour Co-op | William Chalmers | 1,083 | 6.83 | ||
| Labour Co-op | Phillip Jones | 1,057 | 6.66 | ||
| Liberal Democrat | Daphne Latimer | 736 | 4.64 | ||
| Liberal Democrat | David Latimer | 702 | 4.42 | ||
| Liberal Democrat | John Lovatt | 580 | 3.66 | ||
| Green | Elizabeth Fakhr | 436 | 2.75 | ||
| Green | Geraldine Keenan | 392 | 2.47 | ||
| Green | Alison Varey | 367 | 2.31 | ||
| Turnout | 53.22 | ||||
Preston Park
| Party | Candidate | Votes | % | ± | |
|---|---|---|---|---|---|
| Green | George Mallender | 1,951 | 13.43 | ||
| Labour Co-op | Juliet McCaffery | 1,623 | 11.18 | ||
| Labour Co-op | Kevin Allen | 1,551 | 10.68 | ||
| Green | Alison Plaumer | 1,462 | 10.07 | ||
| Labour Co-op | Michael Middleton | 1,448 | 9.97 | ||
| Green | Laurence Littman | 1,342 | 9.24 | ||
| Conservative | Andrew Garrood | 919 | 6.33 | ||
| Liberal Democrat | Christopher Anderson | 885 | 6.09 | ||
| Liberal Democrat | Birgit Gutheridge | 871 | 6.00 | ||
| Conservative | Marie-Anne Bezencon | 856 | 5.89 | ||
| Conservative | Pamela Stiles | 827 | 5.69 | ||
| Liberal Democrat | Trefor Hunter | 788 | 5.43 | ||
| Turnout | 49.91 | ||||
Queen's Park
| Party | Candidate | Votes | % | ± | |
|---|---|---|---|---|---|
| Labour Co-op | Kenneth Bodfish | 1,713 | 13.51 | ||
| Labour Co-op | Simon Burgess | 1,647 | 12.99 | ||
| Labour Co-op | Delia Forester | 1,614 | 12.73 | ||
| Green | Nigel Tart | 1,147 | 9.05 | ||
| Conservative | Robin Cecil | 947 | 7.47 | ||
| Conservative | Patricia Smith | 922 | 7.27 | ||
| Conservative | Michael Williams | 911 | 7.19 | ||
| Green | Mjka Scott | 895 | 7.06 | ||
| Green | Rebecca Whale | 810 | 6.39 | ||
| Liberal Democrat | Elizabeth Robinson | 775 | 6.11 | ||
| Liberal Democrat | Joseph Blease | 695 | 5.48 | ||
| Liberal Democrat | Douglas Janke | 602 | 4.75 | ||
| Turnout | 41.48 | ||||
Regency
| Party | Candidate | Votes | % | ± | |
|---|---|---|---|---|---|
| Liberal Democrat | Dawn Davidson | 770 | 15.51 | ||
| Labour Co-op | Roy Pennington | 736 | 14.82 | ||
| Liberal Democrat | Kevin Donnelly | 731 | 14.72 | ||
| Labour Co-op | Michael Fisher | 720 | 14.50 | ||
| Green | Ian Poyser | 696 | 14.02 | ||
| Conservative | John Hutchinson | 464 | 9.35 | ||
| Conservative | Joyce Pidgeon | 435 | 8.76 | ||
| Green | Hugh Miller | 413 | 8.32 | ||
| Turnout | 35.10 | ||||
Rottingdean Coastal
| Party | Candidate | Votes | % | ± | |
|---|---|---|---|---|---|
| Conservative | Lynda Hyde | 3,270 | 20.61 | ||
| Conservative | David Smith | 2,910 | 18.34 | ||
| Conservative | Mary Mears | 2,880 | 18.15 | ||
| Labour Co-op | Norman William | 940 | 5.92 | ||
| Labour Co-op | Roger Page | 839 | 5.29 | ||
| Liberal Democrat | Harold DeSouza | 805 | 5.07 | ||
| Liberal Democrat | Joy DeSouza | 805 | 5.07 | ||
| Green | Geoffrey Bowden | 749 | 4.72 | ||
| Labour Co-op | Hitesh Tailor | 744 | 4.69 | ||
| Liberal Democrat | Lisa Winter | 591 | 3.72 | ||
| Green | Susan Gilson | 545 | 3.44 | ||
| Green | Gregory Taylor | 474 | 2.99 | ||
| BNP | Renzo Ferrari | 314 | 1.98 | ||
| Turnout | 53.76 | ||||
South Portslade
| Party | Candidate | Votes | % | ± | |
|---|---|---|---|---|---|
| Labour Co-op | Leslie Hamilton | 1,347 | 23.23 | ||
| Labour Co-op | Sue John | 1,085 | 18.71 | ||
| Conservative | Richard Biggs | 835 | 14.40 | ||
| Independent | Steve Collier | 804 | 13.86 | ||
| Conservative | Michael Long | 718 | 12.38 | ||
| Liberal Democrat | Nicola Searle | 303 | 5.23 | ||
| Liberal Democrat | Neville Searle | 287 | 4.95 | ||
| Green | Christopher Fry | 214 | 3.69 | ||
| Green | Janette Ackroyd | 206 | 3.55 | ||
| Turnout | 46.61 | ||||
Stanford
| Party | Candidate | Votes | % | ± | |
|---|---|---|---|---|---|
| Conservative | Vanesse Brown | 2,497 | 31.39 | ||
| Independent | Jayne Bennett | 1,771 | 22.27 | ||
| Conservative | Michael Switzer | 1,700 | 21.37 | ||
| Labour Co-op | Patrick Gill | 467 | 5.87 | ||
| Labour Co-op | Nicole Murphy | 436 | 5.48 | ||
| Liberal Democrat | Roy Alldred | 417 | 5.24 | ||
| Liberal Democrat | Peter Denyer | 275 | 3.46 | ||
| Green | Alan Pegg | 241 | 3.03 | ||
| Green | Molly Taylor | 150 | 1.89 | ||
| Turnout | 55.94 | ||||
St Peter's and North Laine
| Party | Candidate | Votes | % | ± | |
|---|---|---|---|---|---|
| Green | Keith Taylor | 2,347 | 17.27 | ||
| Green | Susan Paskins | 2,266 | 16.68 | ||
| Green | Simon Williams | 2,254 | 16.59 | ||
| Labour Co-op | Christine Simpson | 1,200 | 8.83 | ||
| Labour Co-op | Harry Spillman | 1,103 | 8.12 | ||
| Labour Co-op | Robert Stephenson | 1,094 | 8.05 | ||
| Liberal Democrat | Madelaine Hunter | 637 | 4.69 | ||
| Liberal Democrat | Ruth Berry | 627 | 4.61 | ||
| Liberal Democrat | William Parker | 517 | 3.81 | ||
| Conservative | Paul Bowes | 474 | 3.49 | ||
| Conservative | Carole Franklin | 474 | 3.49 | ||
| Conservative | James Gowans | 471 | 3.47 | ||
| Independent | Gerald O’Brien | 123 | 0.91 | ||
| Turnout | 40.59 | ||||
Westbourne
| Party | Candidate | Votes | % | ± | |
|---|---|---|---|---|---|
| Conservative | Brian Oxley | 1,482 | 23.06 | ||
| Conservative | Denise Cobb | 1,431 | 22.27 | ||
| Labour Co-op | Don Brown | 904 | 14.07 | ||
| Labour Co-op | David Jones | 813 | 12.65 | ||
| Liberal Democrat | Valerie Paynter | 661 | 10.28 | ||
| Liberal Democrat | Brian Ralfe | 553 | 8.60 | ||
| Green | Philip Dymond | 358 | 5.57 | ||
| Green | Anita Phillips | 225 | 3.50 | ||
| Turnout | 46.93 | ||||
Wish
| Party | Candidate | Votes | % | ± | |
|---|---|---|---|---|---|
| Conservative | Garry Dunn | 1,616 | 22.96 | ||
| Conservative | Edward Kemble | 1,522 | 21.63 | ||
| Labour Co-op | Heather James | 1,368 | 19.44 | ||
| Labour Co-op | Patrick Murphy | 1,242 | 17.65 | ||
| Liberal Democrat | Stephen Potts | 454 | 6.45 | ||
| Green | Susan Baumgardt | 324 | 4.60 | ||
| Liberal Democrat | Robert Stockman | 296 | 4.21 | ||
| Green | Elizabeth Wakefield | 215 | 3.06 | ||
| Turnout | 55.05 | ||||
Withdean
| Party | Candidate | Votes | % | ± | |
|---|---|---|---|---|---|
| Conservative | Patricia Drake | 2,800 | 17.07 | ||
| Conservative | Ann Norman | 2,758 | 16.81 | ||
| Conservative | Kenneth Norman | 2,726 | 16.62 | ||
| Labour Co-op | Iain Findlay | 1,192 | 7.27 | ||
| Labour Co-op | Jane Peckham | 1,135 | 6.92 | ||
| Labour Co-op | Gareth Jones | 1,073 | 6.54 | ||
| Liberal Democrat | Peter Garratt | 1,000 | 6.10 | ||
| Liberal Democrat | Donald McBeth | 930 | 5.67 | ||
| Liberal Democrat | Derek Hall | 895 | 5.46 | ||
| Green | James Lea | 745 | 4.54 | ||
| Green | Lynn MacKenzie | 680 | 4.14 | ||
| Green | Fiona Williams | 472 | 2.88 | ||
| Turnout | 53.74 | ||||
Woodingdean
| Party | Candidate | Votes | % | ± | |
|---|---|---|---|---|---|
| Conservative | Geoffrey Wells | 2,500 | 32.26 | ||
| Conservative | Deirdre Simson | 2,456 | 31.69 | ||
| Labour Co-op | Raymond Blackwood | 956 | 12.34 | ||
| Labour Co-op | Malcolm Prescott | 885 | 11.42 | ||
| Liberal Democrat | Season Prater | 289 | 3.73 | ||
| Liberal Democrat | Tim Prater | 292 | 3.77 | ||
| Green | Stella Pentecost | 218 | 2.81 | ||
| Green | Paul Ward | 153 | 1.97 | ||
| Turnout | 55.33 | ||||
References
| East Sussex County Council | |
|---|---|
| Brighton and Hove City Council | |
| Eastbourne Borough Council | |
| Hastings Borough Council | |
| Lewes District Council |
|
| Rother District Council | |
| Wealden District Council | |
| Brighton Borough Council |
|
| Hove Borough Council |
|
| |
| Metropolitan boroughs |
|
|---|---|
| Unitary authorities |
|
| District councils (England) |
|
| Scottish councils |
|
| National Assembly elections | |
This article is issued from Wikipedia - version of the 7/18/2016. The text is available under the Creative Commons Attribution/Share Alike but additional terms may apply for the media files.