St Helens Metropolitan Borough Council election, 2007
The 2007 St Helens Metropolitan Borough Council election took place on 3 May 2007 to elect members of St Helens Metropolitan Borough Council in Merseyside, England. One third of the council was up for election and the council stayed under no overall control.[1]
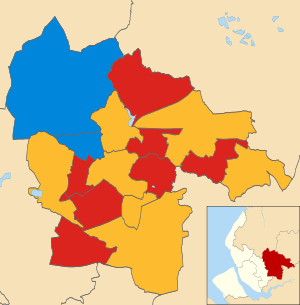
After the election, the composition of the council was
- Labour 21
- Liberal Democrats 20
- Conservative 6
- Independent 1[2]
Background
After the last election in 2006, Labour were the largest party with 23 councillors, compared to 19 for the Liberal Democrats and 6 for the Conservatives.[3] However following the election the Liberal Democrats and Conservatives reached an agreement to run the council together.[4] In June 2006 2 Labour councillors, Bessie Griffin and Pat Robinson, left the party to sit as independent councillors,[5] with Pat Robinson going on to join the Liberal Democrats early in 2007.[6] This meant that before the 2007 election Labour had 21 seats, the Liberal Democrats had 19, the Conservatives 6, there was 1 independent and 1 seat was vacant,[4] after the retirement of Liberal Democrat councillor Julie Jones.[7]
17 seats were contested at the election, including 2 seats in Sutton,[7] with both Labour and the Liberal Democrats defending 7, the Conservatives defended 2 seats, and 1 former Liberal Democrat seat was vacant.[4] Key seats were expected before the election to be in Bold, Haydock, Town Centre and West Park wards.[4] Candidates at the election included four from the British National Party,[8] up from one in 2006, while a former Labour leader of the council in the 1980s, Brian Green, stood for the Community Action Party in Bold.[6]
Election result
The Labour and Liberal Democrat parties both gained 2 seats from each other to leave the party balance on the council unchanged.[9] Labour gained seats from the Liberal Democrats in Thatto Heath and West Park to leave Labour on 21 seats, with the winner in West Park, Marlene Quinn, being the sister of the Labour group leader Marie Rimmer.[9] However the Liberal Democrats took seats in Haydock and Town Centre from Labour to leave them just one seat behind Labour with 20 councillors.[9] Meanwhile, the Conservatives held the 2 seats they had been defending to remain with 6 seats and the only independent councillor was not defending their seat in 2007.[2]
Following the election the independent councillor Bessie Griffin joined the Liberal Democrats, which meant both the Labour and Liberal Democrat groups had 21 seats.[10] The Liberal Democrats and Conservatives continued to run the council, after agreeing to renew their pact.[10]
| St Helens local election result 2007[11] | ||||||||||
|---|---|---|---|---|---|---|---|---|---|---|
| Party | Seats | Gains | Losses | Net gain/loss | Seats % | Votes % | Votes | +/− | ||
| Liberal Democrat | 8 | 2 | 2 | 0 | 47.1 | 41.4 | 19,781 | +1.8% | ||
| Labour | 7 | 2 | 2 | 0 | 41.2 | 37.7 | 18,030 | -2.7% | ||
| Conservative | 2 | 0 | 0 | 0 | 11.8 | 17.0 | 8,146 | -0.3% | ||
| BNP | 0 | 0 | 0 | 0 | 0 | 1.8 | 879 | +1.1% | ||
| Community Action | 0 | 0 | 0 | 0 | 0 | 1.2 | 561 | -0.7% | ||
| Community Performance First | 0 | 0 | 0 | 0 | 0 | 0.7 | 313 | +0.7% | ||
| Green | 0 | 0 | 0 | 0 | 0 | 0.2 | 110 | +0.2% | ||
Ward results
| Party | Candidate | Votes | % | ± | |
|---|---|---|---|---|---|
| Labour | Joe Pearson | 1,321 | 42.5 | -5.3 | |
| Conservative | Michael Hodgson | 922 | 29.7 | -1.1 | |
| Liberal Democrat | Charles Gadsden | 551 | 17.7 | -3.7 | |
| Community Performance First | Vinny Kay | 313 | 10.1 | +10.1 | |
| Majority | 399 | 12.8 | -4.2 | ||
| Turnout | 3,107 | 34.0 | -0.8 | ||
| Labour hold | Swing | ||||
| Party | Candidate | Votes | % | ± | |
|---|---|---|---|---|---|
| Labour | Linda Maloney | 1,266 | 63.7 | +15.0 | |
| Liberal Democrat | Ruth Smith | 299 | 15.0 | -12.6 | |
| Conservative | Judith Collins | 259 | 13.0 | +4.4 | |
| Community Action | Janet Smee | 164 | 8.2 | -4.5 | |
| Majority | 967 | 48.6 | +27.5 | ||
| Turnout | 1,988 | 28.9 | -1.4 | ||
| Labour hold | Swing | ||||
| Party | Candidate | Votes | % | ± | |
|---|---|---|---|---|---|
| Liberal Democrat | Stephen Topping | 933 | 43.9 | -4.8 | |
| Labour | Charlie Preston | 911 | 42.9 | -2.0 | |
| Conservative | Charmian Pyke | 165 | 7.8 | +1.4 | |
| Community Action | Brian Green | 117 | 5.5 | +5.5 | |
| Majority | 22 | 1.0 | -2.8 | ||
| Turnout | 2,126 | 28.7 | -2.2 | ||
| Liberal Democrat hold | Swing | ||||
| Party | Candidate | Votes | % | ± | |
|---|---|---|---|---|---|
| Labour | Keith Deakin | 1,090 | 44.8 | -3.8 | |
| Liberal Democrat | David Smith | 1,000 | 41.1 | +0.9 | |
| Conservative | Brian Honey | 234 | 9.6 | -1.6 | |
| Green | Andie Pennington | 110 | 4.5 | +4.5 | |
| Majority | 90 | 3.7 | -4.7 | ||
| Turnout | 2,434 | 30.2 | +0.5 | ||
| Labour hold | Swing | ||||
| Party | Candidate | Votes | % | ± | |
|---|---|---|---|---|---|
| Liberal Democrat | Shirley Evans | 2,696 | 69.8 | +2.5 | |
| Conservative | Kathleen Barton | 587 | 15.2 | -2.2 | |
| Labour | Lynn Glover | 577 | 14.9 | -0.4 | |
| Majority | 2,109 | 54.6 | +4.8 | ||
| Turnout | 3,860 | 41.4 | -1.4 | ||
| Liberal Democrat hold | Swing | ||||
| Party | Candidate | Votes | % | ± | |
|---|---|---|---|---|---|
| Liberal Democrat | Janet Sheldon | 1,820 | 59.6 | +4.5 | |
| Labour | Ken Cleary | 1,022 | 33.5 | -5.6 | |
| Conservative | Anthony Rigby | 211 | 6.9 | +1.1 | |
| Majority | 798 | 26.1 | +10.1 | ||
| Turnout | 3,053 | 33.6 | -2.9 | ||
| Liberal Democrat gain from Labour | Swing | ||||
| Party | Candidate | Votes | % | ± | |
|---|---|---|---|---|---|
| Liberal Democrat | Anne Heyes | 1,707 | 54.2 | +1.9 | |
| Labour | Roy Litherland | 1,189 | 37.7 | -2.5 | |
| Conservative | William Highcock | 254 | 8.1 | +0.6 | |
| Majority | 518 | 16.4 | +4.3 | ||
| Turnout | 3,150 | 35.8 | -0.3 | ||
| Liberal Democrat hold | Swing | ||||
| Party | Candidate | Votes | % | ± | |
|---|---|---|---|---|---|
| Liberal Democrat | Peter Astbury | 2,003 | 69.7 | +5.6 | |
| Labour | Louise Hazelby | 613 | 21.3 | -5.8 | |
| Conservative | Margaret Harvey | 257 | 8.9 | +0.1 | |
| Majority | 1,390 | 48.4 | +11.4 | ||
| Turnout | 2,873 | 34.9 | +0.3 | ||
| Liberal Democrat hold | Swing | ||||
| Party | Candidate | Votes | % | ± | |
|---|---|---|---|---|---|
| Labour | Keith Roberts | 1,379 | 69.2 | +3.2 | |
| Liberal Democrat | Gary Pulfer | 466 | 23.4 | -5.0 | |
| Conservative | Madeleine Wilcock | 148 | 7.4 | +1.8 | |
| Majority | 913 | 45.8 | +8.2 | ||
| Turnout | 1,993 | 23.2 | -2.4 | ||
| Labour hold | Swing | ||||
| Party | Candidate | Votes | % | ± | |
|---|---|---|---|---|---|
| Conservative | David Grice | 2,099 | 71.7 | +11.8 | |
| Labour | David Wood | 634 | 21.7 | -5.8 | |
| Liberal Democrat | Frederick Barret | 194 | 6.6 | -6.1 | |
| Majority | 1,465 | 50.1 | +17.7 | ||
| Turnout | 2,927 | 42.9 | +0.2 | ||
| Conservative hold | Swing | ||||
| Party | Candidate | Votes | % | ± | |
|---|---|---|---|---|---|
| Labour | Joseph De Asha | 1,508 | 45.9 | -0.2 | |
| Conservative | Henry Spriggs | 872 | 26.5 | -3.8 | |
| Liberal Democrat | Christina Duncan | 629 | 19.1 | -4.5 | |
| BNP | Frances Chesney | 278 | 8.5 | +8.5 | |
| Majority | 636 | 19.3 | +3.5 | ||
| Turnout | 3,287 | 35.8 | +1.1 | ||
| Labour hold | Swing | ||||
| Party | Candidate | Votes | % | ± | |
|---|---|---|---|---|---|
| Liberal Democrat | Kenneth Knowles | 2,198 | |||
| Liberal Democrat | Stephanie Topping | 1,797 | |||
| Labour | Mike Glover | 817 | |||
| Labour | Derek Maylor | 747 | |||
| Conservative | Barbara Johnson | 225 | |||
| Turnout | 5,784 | 30.3 | +4.7 | ||
| Liberal Democrat hold | Swing | ||||
| Liberal Democrat hold | Swing | ||||
| Party | Candidate | Votes | % | ± | |
|---|---|---|---|---|---|
| Labour | Patricia Martinez-Williams | 1,274 | 48.3 | -7.6 | |
| Liberal Democrat | Patricia Robinson | 794 | 30.1 | +10.7 | |
| Conservative | Barbara Woodcock | 201 | 7.6 | -1.7 | |
| BNP | Damian Smith | 187 | 7.1 | +7.1 | |
| Community Action | Michael Perry | 180 | 6.8 | -8.7 | |
| Majority | 480 | 18.2 | -18.3 | ||
| Turnout | 2,636 | 29.2 | +2.5 | ||
| Labour gain from Liberal Democrat | Swing | ||||
| Party | Candidate | Votes | % | ± | |
|---|---|---|---|---|---|
| Liberal Democrat | Janet Hennessy | 1,099 | 45.2 | +4.2 | |
| Labour | Martin Bond | 959 | 39.4 | +0.2 | |
| BNP | Kevin Devine | 194 | 8.0 | -4.0 | |
| Conservative | Jill Jones | 129 | 5.3 | +0.9 | |
| Community Action | Leslie Teeling | 50 | 2.1 | -1.4 | |
| Majority | 140 | 5.8 | +4.0 | ||
| Turnout | 2,431 | 29.5 | -1.8 | ||
| Liberal Democrat gain from Labour | Swing | ||||
| Party | Candidate | Votes | % | ± | |
|---|---|---|---|---|---|
| Labour | Marlene Quinn | 1,741 | 52.2 | +0.4 | |
| Liberal Democrat | David Evans | 1,150 | 34.5 | -4.8 | |
| BNP | Eric Swindells | 220 | 6.6 | +6.6 | |
| Conservative | Richard Barton | 174 | 5.2 | -0.5 | |
| Community Action | Tracy Lavelle | 50 | 1.5 | -1.7 | |
| Majority | 591 | 17.7 | +5.2 | ||
| Turnout | 3,335 | 37.1 | -4.5 | ||
| Labour gain from Liberal Democrat | Swing | ||||
| Party | Candidate | Votes | % | ± | |
|---|---|---|---|---|---|
| Conservative | Nancy Ashcroft | 1,409 | 49.7 | +0.8 | |
| Labour | Geoffrey Almond | 982 | 34.6 | +0.6 | |
| Liberal Democrat | Noreen Knowles | 445 | 15.7 | -1.3 | |
| Majority | 427 | 15.1 | +0.2 | ||
| Turnout | 2,836 | 35.2 | -1.3 | ||
| Conservative hold | Swing | ||||
References
- ↑ "St Helens". BBC News Online. 4 May 2007. Retrieved 28 February 2015.
- 1 2 "Results - Election 2007". The Times. NewsBank. 5 May 2007. p. 83.
- ↑ "Local elections: St Helens". BBC News Online. 5 May 2006. Retrieved 28 February 2015.
- 1 2 3 4 Traynor, Luke (27 April 2007). "Battle for power and for your vote". Liverpool Echo. NewsBank.
- ↑ Kilmurray, Andrew (15 June 2006). "Two quit Labour". Cheshire, Greater Manchester, and Merseyside Counties Publications. NewsBank.
- 1 2 "Can Labour stage comeback or will the Lib Dem/Tory alliance prosper?". St Helens Star. 28 April 2007. Retrieved 28 February 2015.
- 1 2 "Election results in full". St Helens Reporter. 4 May 2007. Retrieved 28 February 2015.
- ↑ Lister, Sam (5 April 2007). "BNP plans poll push". Liverpool Daily Post. NewsBank.
- 1 2 3 "Labour aims for 2008". Liverpool Echo. NewsBank. 4 May 2007.
- 1 2 "St Helens leadership unchanged". Liverpool Daily Post. NewsBank. 17 May 2007.
- 1 2 3 4 5 6 7 8 9 10 11 12 13 14 15 16 17 "Declaration of Result of Poll" (PDF). St. Helens Council. Retrieved 28 February 2015.