2010 Atlantic hurricane season
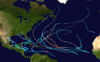 | |
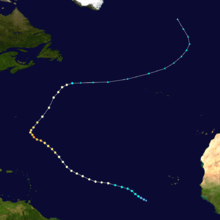
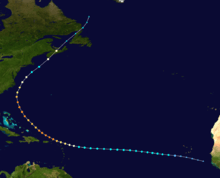
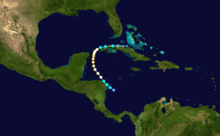
| Season summary map | |
| First system formed | June 25, 2010 |
|---|---|
| Last system dissipated | November 7, 2010 |
| Strongest storm1 | Igor – 924 mbar (hPa) (27.29 inHg), 155 mph (250 km/h) |
| Total depressions | 21 |
| Total storms | 19 |
| Hurricanes | 12 |
| Major hurricanes (Cat. 3+) | 5 |
| Total fatalities | 287 direct, 27 indirect |
| Total damage | ≥ $4.53 billion (2010 USD) |
| 1Strongest storm is determined by lowest pressure | |
2008, 2009, 2010, 2011, 2012 | |
| Related article | |
The 2010 Atlantic hurricane season was the third most active Atlantic hurricane season on record (behind only the 2005 and 1933 seasons), tying with the 1887, 1995, 2011, and 2012 Atlantic hurricane seasons. It had the most named storms since the 2005 season, and also ties with the 1969 season for the second-largest number of hurricanes.[1] In addition, the 2010 Atlantic hurricane season was more active than the year's Pacific typhoon season, only the second time this is known to have occurred (the first being in 2005).[2]
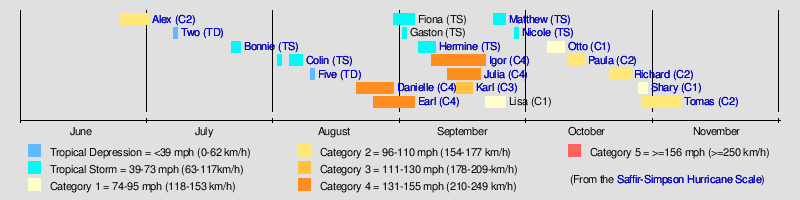
The season began with Hurricane Alex, a Category 2 storm on the Saffir–Simpson Hurricane Scale, which struck the Yucatán Peninsula as a tropical storm and northeastern Mexico south of the Texas border at peak intensity. Following Alex, a series of relatively weak systems occurred into the month of July and early August. In the latter part of August and September, the season became much more active with the formation of eleven named storms in about 40 days, six of which were Cape Verde-type storms. Four of those Cape Verde storms (Danielle, Earl, Igor, and Julia) each reached Category 4 intensity and a fifth in the Bay of Campeche (Karl) also became a major hurricane. Danielle and Earl were back-to-back major hurricanes, followed by several weak tropical storms, and then another series of three consecutive major hurricanes. From August 21 to September 26, there was not a single full day without at least one tropical cyclone active for a total of 36 days, starting with the formation of Tropical Depression Six (which became Hurricane Danielle) and ending with the dissipation of Tropical Storm Matthew, the longest period since the 2005 Atlantic hurricane season. In the month of September, eight named storms formed, which is the highest ever recorded, tying with the 2002 and 2007 seasons.
In addition, there were three occasions when three tropical cyclones were active simultaneously, with the first set being Danielle, Earl, and Fiona co-existing on August 30 – August 31. The second occasion was when Earl, Fiona, and Gaston co-existed on September 1 – September 2. The third and most notable was when Igor, Julia, and Karl were active September 14 – September 18. During a brief period, on September 15, Igor and Julia were simultaneously Category 4 hurricanes. Both were still hurricanes when Karl was upgraded to a hurricane on September 16, the first time since the 2005 season that there were at least three simultaneous hurricanes in the North Atlantic.
Seasonal forecasts
| Source | Date | Named storms |
Hurricanes | Major hurricanes | |
| Average (1950–2005[3]) | 10.3 | 6.2 | 2.7 | ||
| Record high activity | 28 | 15 | 8 | ||
| Record low activity | 4 | 2 | 0† | ||
| ––––––––––––––––––––––––––––––––––––––––––––––––––––––– | |||||
| CSU | December 10, 2009 | 11–16 | 8–9 | 3–5 | |
| CSU | April 7, 2010 | 15 | 8 | 4 | |
| NCSU | April 26, 2010 | 15–18 | 8–11 | N/A | |
| NOAA | May 27, 2010 | 14–23 | 8–14 | 3–7 | |
| FSU COAPS | June 1, 2010 | 17 | 10 | N/A | |
| CSU | June 2, 2010 | 18 | 10 | 5 | |
| UKMO | June 17, 2010 | 20* | N/A | N/A | |
| NOAA | August 5, 2010 | 14–20 | 8–12 | 4–6 | |
| ––––––––––––––––––––––––––––––––––––––––––––––––––––––– | |||||
| Actual activity |
19 | 12 | 5 | ||
| * July–November only. † Most recent of several such occurrences. (See all) | |||||
Philip J. Klotzbach's team at Colorado State University (formerly led by William M. Gray) defined the average number of storms per season (1950 to 2000) as 9.6 tropical storms, 5.9 hurricanes, 2.3 major hurricanes (storms reaching at least Category 3 strength in the Saffir-Simpson Hurricane Scale) and an Accumulated Cyclone Energy (ACE) index of 96.1.[4] NOAA defines a season as above-normal, near-normal or below-normal by a combination of the number of named storms, the number reaching hurricane strength, the number reaching major hurricane strength and the ACE index.[5]
Pre-season forecasts
On December 9, 2009, Klotzbach's team issued their first extended-range forecast for the 2010 season, predicting average to above-average activity (11 to 16 named storms, six to eight hurricanes and three to five major hurricanes of Category 3 or higher and ACE Index of 100–162), citing that the 2009–10 El Niño event is likely to dissipate by the start of the season.[4] On April 7, 2010, Klotzbachs's team issued an updated forecast for the 2010 season, predicting above-average activity (15 named storms, eight hurricanes and four major hurricanes of Category 3 or higher), citing the dissipating 2009–10 El Niño, the possibility of current weak to moderate La Niña and warming Atlantic sea surface temperatures as potential factors.[6] North Carolina State University professor Lian Xie and a team of colleagues and students predicted that 2010 would see 15 to 18 named storms, with 8–11 potentially becoming hurricanes.[7] Xie’s team predicts that 3–6 storms will make landfall in the Gulf of Mexico, with one storm making landfall at hurricane status. However, no prediction was made for the number of major hurricanes.[7]
On May 27, 2010, NOAA released their forecast for the season, predicting an "extremely active" season (14 to 23 named storms, eight to fourteen hurricanes, and three to seven major hurricanes of Category 3 or higher). NOAA based its forecast on weaker wind shear, warmer temperatures in the region and the continuance of the "high activity era" (i.e. Atlantic multidecadal oscillation warm phase) which began in 1995. Gerry Bell, lead seasonal hurricane forecaster at NOAA’s Climate Prediction Center, added the main uncertainty in the outlook was how much above normal the 2010 season will be, and whether the high end of the predicted range is reached "depends partly on whether or not La Niña develops this summer. At present we are in a neutral state, but conditions are becoming increasingly favorable for La Niña to develop."[8]
Mid-season outlooks
On June 1, 2010, the Florida State University Center for Ocean-Atmospheric Prediction Studies (FSU COAPS) issued its second annual Atlantic hurricane season forecast. The FSU COAPS forecast predicted 17 named storms, including 10 hurricanes, and an ACE Index of 156.[9] On June 2, 2010, Klotzbach's team issued their second updated forecast for the 2010 season, predicting 18 named storms, 10 hurricanes, and 5 major hurricanes.[10] The university said it now believes there will be more storms than they believed earlier. The university also said the chance of a major hurricane hitting the U.S. coast is 76 percent, compared to an average of 52 percent for the last 100 years. The chance of a major hurricane hitting the Florida peninsula and the U.S. east coast is 51 percent, compared to an average of 30 percent for the last 100 years.[11] On June 17, the UK Met Office (UKMO) issued a forecast of an above-average season. They predicted 20 tropical storms with a 70% chance that the number would be between 13 and 27. However, they do not issue forecasts on the number of hurricanes and major hurricanes. They also predicted an ACE Index of 204 with a 70% chance that the index would be in the range 90 to 319.[12]
On August 5, NOAA released its mid-season forecast. It was revised slightly downwards, to 14–20 named storms, 8–12 hurricanes, and 4–6 major hurricanes. The agency noted that the new estimate was revised downwards from the initial estimate since the latter included the possibility of even more early season activity. However, NOAA indicated that a La Niña event had in fact developed, and that the conditions for an active season remained in place.[13]
Season summary
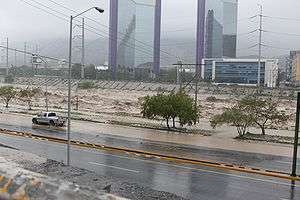
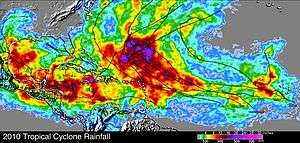
Most of the damage in the season occurred in Mexico. The first hurricane, Hurricane Alex, was the wettest tropical cyclone in the state of Nuevo León, producing 35.04 in (890 mm) on the mountains in the outskirts of Monterrey.[15][16] Heavy damage was reported in the state, totaling $16.9 billion (2010 MXN; 1.35 billion USD).[17] In Tamaulipas where it made landfall, Alex and its ensuing floods damaged at least 6,000 homes, 202 schools, and 500 businesses,[18] leaving damage of around $1.084 billion (2010 MXN; 83.8 million USD).[19] There were at least 12 deaths in the country.[20]
Due to the prevailing atmospheric steering currents and the placement of the jet stream, most hurricanes remained away from the United States.[21] No hurricanes struck the country, compared to the average of two, although several storms affected the country.[22] In late June, Tropical Storm Alex moved through the area affected by the Deepwater Horizon oil spill, causing tarballs as large as apples to wash onshore portions of the Gulf Coast from high storm tides created by the storm.[23][24] Later it produced heavy rainfall in south Texas,[25] causing flooding along the Rio Grande[26] and $10 million in damage (2010 USD).[20] About a week after Alex, Tropical Depression Two struck southern Texas, producing additional rainfall in the region.[27] Tropical Storm Bonnie was one of two named storms to hit the country, striking south Florida in July and causing light rainfall and winds.[28] A few weeks later, Tropical Depression Five developed in the eastern Gulf of Mexico, causing two indirect deaths off the west of Florida due to heavy surf.[29] Along the east coast of the United States, Tropical Storm Colin caused one drowning death in early August,[30] followed by Hurricane Danielle causing two deaths from rip currents later in the month.[31]
Overall, the season's activity was reflected with a high accumulated cyclone energy (ACE) rating of 166, the highest since 2005.[32] ACE is, broadly speaking, a measure of the power of the hurricane multiplied by the length of time it existed, so storms that last a long time, as well as particularly strong hurricanes, have high ACEs. ACE is only calculated for full advisories on tropical systems at or exceeding 34 knots (39 mph, 63 km/h) or tropical storm strength. Subtropical cyclones are excluded from the total.[33]
Storms
Hurricane Alex
| Category 2 hurricane (SSHWS) | |||
|---|---|---|---|
| |||
| Duration | June 25 – July 2 | ||
| Peak intensity | 110 mph (175 km/h) (1-min) 946 mbar (hPa) | ||
On June 12, a tropical wave emerged off Western Africa, and eventually traveled along the Intertropical Convergence Zone. It was first noted by the National Hurricane Center (NHC) on June 20, while it was crossing the Windward Islands. The next day, it organized itself, and the NHC assessed a 50% chance of development into a tropical depression within the next two days. It became less organized the next day; however, conditions were still favorable for development. On June 24, it moved south of Jamaica as a poorly organized system. Later that day, shower activity increased, and pressures began to fall. Hurricane Hunters flew inside it the next day and found a well-defined circulation, and based on that data, the NHC began issuing advisories on Tropical Depression One, the first tropical depression of the season.[34]
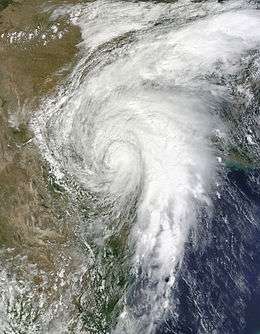
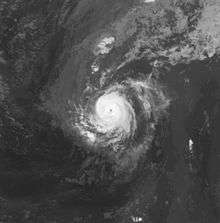
Early on June 26, the NHC upgraded the depression to a tropical storm and named it Alex. Alex moved west and strengthened before making landfall in Belize with 65 mph (105 km/h) winds on June 26. On June 27, Alex emerged into the Bay of Campeche and began to strengthen again. On June 29, after continuous drops in pressure, the Hurricane Hunters found that Alex had strong enough winds to be upgraded to hurricane status. Accordingly, late that night, Alex was upgraded to a Category 1 hurricane. This made the storm the first hurricane of the season, and the first June hurricane in the Atlantic since 1995's Hurricane Allison.[35]
Continuing to strengthen, Alex later went on to make landfall at peak intensity as a strong Category 2 hurricane in Soto la Marina with an unusually low barometric pressure reading of 946 millibars (27.96 inHg) due to its large size, typical of a Category 3 or 4 hurricane on the Saffir-Simpson Hurricane Scale.[36]
Tropical Depression Two
| Tropical depression (SSHWS) | |||
|---|---|---|---|
| |||
| Duration | July 8 – July 9 | ||
| Peak intensity | 35 mph (55 km/h) (1-min) 1005 mbar (hPa) | ||

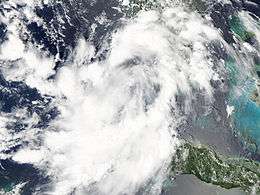
By July 3, the day after Alex dissipated, a tropical wave was producing two areas of convection across the western Caribbean Sea.[37] The next day, the system began showing signs of organization concurrently with decreasing pressures across the region.[38] After crossing the Yucatán Peninsula and entering the Gulf of Mexico, however, the system became disorganized, although its upper-level environment was forecast to become more favorable.[39] On July 7, the convection became more concentrated,[40] and by July 8 the system organized enough for the National Hurricane Center to initiate advisories on Tropical Depression Two, about 245 miles (495 km) east of La Pesca, Tamaulipas.[41]
Upon developing, the depression was located in an area of warm water temperatures, with relatively low amounts of wind shear. Initially, its inner core of convection was diminishing, coinciding with an increase in outer banding features. With the cyclone forecast to remain over waters for about 24 hours before moving ashore, intensification to tropical storm status was forecast.[41] Tropical storm warnings were immediately put up for the coast of northeastern Mexico and South Texas, the same area impacted heavily by Alex. However, that afternoon, the depression made landfall on South Padre Island, Texas with winds of 35 mph (55 km/h), never having reached tropical storm strength.[42]
Tropical Storm Bonnie
| Tropical storm (SSHWS) | |||
|---|---|---|---|
| |||
| Duration | July 22 – July 24 | ||
| Peak intensity | 45 mph (75 km/h) (1-min) 1005 mbar (hPa) | ||

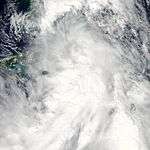
In early July, a tropical wave emerged from Africa. On July 17, it started to show signs of development while located northeast of the Lesser Antilles. It slowly increased in organization for a few days, moving west-northwestward, until it showed signs of a closed surface circulation and on July 22, it was officially classified by the NHC as Tropical Depression Three while located over the Southeastern Bahamas. That afternoon, the NHC upgraded the tropical depression to a tropical storm and named it "Bonnie".[43] The same day, governor Bobby Jindal issued a state of emergency for Louisiana in preparation for the newly formed storm.[44]
Bonnie crossed over the Bahamas as a minimal tropical storm, and further went on to make landfall on the southeastern coast of Florida on the morning of July 23.[45] Downgraded to a tropical depression, Bonnie moved into the Gulf of Mexico on July 23.[46] Bonnie was expected to strengthen in the Gulf, bringing it close to hurricane intensity. However, on July 24, the National Hurricane Center stated that Bonnie dissipated over the northern Gulf of Mexico. The remnants of the storm moved ashore in southeastern Louisiana and southwest Mississippi early on the morning of July 25,[47] prompting severe thunderstorm and tornado warnings in the area.
Tropical Storm Colin
| Tropical storm (SSHWS) | |||
|---|---|---|---|
| |||
| Duration | August 2 – August 8 | ||
| Peak intensity | 60 mph (95 km/h) (1-min) 1005 mbar (hPa) | ||


On July 29, the National Hurricane Center began monitoring a Tropical Wave located in the Eastern Atlantic. After organizing considerably, this wave was upgraded to the fourth tropical depression of the season, while located in the Central Atlantic.[48] Early the next day, the depression strengthened further into a tropical storm and was named "Colin". Tracking rapidly westward, the system experienced little strengthening as the unusually small storm, estimated to have gale-force winds covering an area 70 mi (110 km) in diameter, moved through a region of strong wind shear. It degenerated into a remnant low on the afternoon of August 3, however it was mentioned that regeneration into a tropical cyclone was possible.
After almost two days had passed, on August 4, the low reorganized with tropical storm-force winds and strong convection northeast of the Lesser Antilles but no well-defined closed circulation.[49] The circulation closed off once again on the afternoon of August 5 south of Bermuda, and Colin was once again declared a tropical storm. Tropical Storm Colin was downgraded to a tropical depression late morning on August 8,[50] and by 2100 UTC had dissipated 60 mi (100 km) northwest of Bermuda.
Tropical Depression Five
| Tropical depression (SSHWS) | |||
|---|---|---|---|
| |||
| Duration | August 10 – August 11 | ||
| Peak intensity | 35 mph (55 km/h) (1-min) 1008 mbar (hPa) | ||

Tropical Depression Five originated from a surface trough on August 7, extending from the northeast Gulf of Mexico across Florida, connected to a weak non-tropical low-pressure area located several hundred miles east-southeast of Jacksonville, Florida. Initially, development was not expected due to its close proximity to land, and strong wind shear.[51] However, it gradually became better organized, and 24 hours later the National Hurricane Center gave it a 50% chance of developing within the next two days.[52] After additional development, the low became a tropical depression late on August 10.[53] It was forecast to become a minimal tropical storm; however, it dissipated the next day as it moved into the southeastern United States. In preparation for the depression, BP suspended operations on a drill for a relief well in the Gulf of Mexico to help plug the oil leak for good.[54]
The remnants then tracked Southward, and moved back into the Gulf of Mexico. NHC stated there was an 80% chance of redevelopment. Although conditions were at first favorable for redevelopment into a tropical depression, the lingering remnant low did not reorganize itself significantly, and eventually moved onshore into Louisiana. Early on August 18, the remnants of the system dissipated over Southwestern Mississippi.[55]
Hurricane Danielle
| Category 4 hurricane (SSHWS) | |||
|---|---|---|---|
| |||
| Duration | August 21 – August 30 | ||
| Peak intensity | 130 mph (215 km/h) (1-min) 942 mbar (hPa) | ||
On August 19, an area of low pressure moved off the West coast of Africa. Moving through favorable conditions, it developed into Tropical Depression Six near the Cape Verde Islands on August 21, the first of the series of Cape Verde-type storms.[56] On August 22 the system attained tropical storm status, thus earning the name "Danielle". The next day it attained hurricane status, becoming the second of the season and strengthened further to a Category 2 hurricane. On August 24, Danielle suddenly weakened from a Category 2 hurricane to a Category 1 due to unexpected dry air intrusions and westerly shear. Later that day, Danielle briefly weakened to a tropical storm, before restrengthening into a Category 1 hurricane several hours later. Hours later, Danielle restrengthened into a Category 2 and developed an eye in the morning hours of August 26.
On August 27, Danielle strengthened to a Category 3 hurricane, becoming the first major hurricane of the season, and further strengthened to a Category 4 hurricane shortly after. Danielle later weakened to a Category 3, then Category 2 hurricane, and later became a Category 1 hurricane due to an eyewall replacement cycle, while avoiding land areas. As the storm was moving in a northerly manner, it was not expected to strengthen any more as it would be experiencing increasing wind shear and colder surface waters. It became extratropical late on August 30 southeast of Newfoundland without having directly impacted land. It was fully absorbed by a larger extratropical low on September 3 south of Iceland.
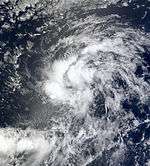
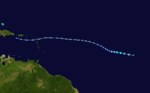
Hurricane Earl
| Category 4 hurricane (SSHWS) | |||
|---|---|---|---|
| |||
| Duration | August 25 – September 4 | ||
| Peak intensity | 145 mph (230 km/h) (1-min) 927 mbar (hPa) | ||

On August 22, an area of disturbed weather moved off the west coast of Africa. Three days later, Tropical Depression Seven formed east of Hurricane Danielle. Later that day it was upgraded to Tropical Storm Earl. Unlike its predecessor, it was expected to follow a more southerly track, similar to Tropical Storm Colin in early August. After strengthening to a tropical storm, Earl maintained a minimum pressure of 1,003 mb (29.6 inHg) and winds of 45 mph (75 km/h) for nearly two days until it deepened slightly. Its winds increased to 60 mph (100 km/h), and remained that way for 12 hours. By August 29, Earl strengthened into a hurricane. Earl then rapidly intensified into a Category 4 as it approached to Puerto Rico and U.S.Virgin Islands; the island of Puerto Rico was battered with maintained tropical storm winds with higher gusts. On September 1, the hurricane weakened to a Category 3 hurricane after an eyewall replacement cycle before becoming a Category 4 again. Earl then weakened back to a Category 3 and further into a Category 2 hurricane. On September 2, Earl brushed past Cape Hatteras, with conditions being slightly less severe than expected. However, Earl still brought very heavy rain, winds gusting up to hurricane force, and very large waves. Due to strict design requirements of buildings along Cape Hatteras, damage was minimal, with no structural damage reported along the North Carolina coast.[57] By the following day, the storm had weakened even further to a Category 1 and curved northeastward along the New England coastline.
Areas such as the states of New Jersey, Delaware, Pennsylvania, and Southern New York experienced only minimal impact.[58] It weakened further to a tropical storm on September 3 as it passed to the south-southeast of the New England coastline. Again, conditions were much less severe than expected near Cape Cod, with only minor flooding, beach erosion, and winds gusting up to tropical storm force.[59] Earl made landfall in Nova Scotia as a restrengthened Category 1 hurricane before passing over Prince Edward Island (PEI) as a strong tropical storm.[60] The city of Halifax and regions of the province, as well as eastern PEI, experienced many uprooted trees and power outages reminiscent of Hurricane Juan in 2003, although overall damage was considerably less. Throughout the Caribbean, Hurricane Earl wrought up to $150 million in damage.[61] Two deaths were directly attributable to the storm, one in Nova Scotia, one in the Leeward Islands.[62]
Tropical Storm Fiona
| Tropical storm (SSHWS) | |||
|---|---|---|---|
| |||
| Duration | August 30 – September 3 | ||
| Peak intensity | 65 mph (100 km/h) (1-min) 998 mbar (hPa) | ||
A tropical wave exited western Africa late on August 25, accompanied by a well-defined circulation and copious convection.[63] Late on August 30, the NHC classified the system as Tropical Storm Fiona about 890 miles (1435 km) to the east of the Leeward Islands.[64] However, post-analysis indicates that Fiona developed as a tropical depression at 1200 UTC that day, after convection became more persistent over the center. Due to a ridge to the north, Fiona tracked quickly westward.[63] Initially, the strongest convection was displaced from the center due to wind shear and upwelling by Hurricane Earl.[65] By August 31, convection became more persistent near the slightly-elongated center.[66] While moving near the Lesser Antilles, Fiona reached peak winds of 65 mph (105 km/h), as reported by the Hurricane Hunters.[63] The storm turned to the northwest and passed about 65 mi (105 km) northeast of Barbuda on September 1. Wind shear from Earl removed the deep convection, causing Fiona to weaken. The storm turned northeast and early on September 3, it was no longer a tropical cyclone. The remnants passed near Bermuda and dissipated on September 5.[63]
On August 31, tropical storm watches and warnings were issued for several islands in the eastern Caribbean, and all were canceled the next day. A tropical storm watch and later a warning was issued for Bermuda on September 2, which was canceled after Fiona became a post-tropical cyclone.[63] The storm passed near the island, producing light winds and about 0.78 inches (19.81 mm) of rainfall.[67]
Tropical Storm Gaston
| Tropical storm (SSHWS) | |||
|---|---|---|---|
| |||
| Duration | September 1 – September 2 | ||
| Peak intensity | 40 mph (65 km/h) (1-min) 1005 mbar (hPa) | ||
A vigorous tropical wave emerged from the west coast of Africa on August 28. Post-analysis data indicated that the ninth tropical depression of the season developed at 0600 UTC September 1,[68] although the National Hurricane Center did not operationally initiate advisories until 1500 UTC that day.[69] Nine hours thereafter, the National Hurricane Center upgraded the depression to Tropical Storm Gaston,[70] but post-analysis revealed that the system had been a tropical storm for twelve hours. In the Tropical Cyclone Report, the NHC noted that Gaston may not have attained tropical storm status, as ASCAT scatterometer data only supported an intensity around 35 mph (55 km/h). The tropical storm force winds for Gaston's peak were derived mainly from Dvorak intensity estimates.[68]
In contrast to predictions,[71] no further intensification occurred, and dry air began to impact Gaston, causing deep convection to start diminishing. The storm quickly weakened from dry air, and was no longer a tropical storm by 0000 UTC on September 2,[68] however it was initially reported that the system deteriorated into a tropical depression fifteen hours later.[72] Gaston further deteriorated from the effects of dry air, and dissipated back into a tropical wave on September 2. The system associated with the remnants of Gaston nearly re-developed as it tracked generally westward, but eventually dissipated in the vicinity of the Lesser Antilles on September 8, without regaining a closed low-level circulation.[68] Gaston had no effects on land as a tropical cyclone; however, the remnant system brought light rainfall to Puerto Rico, peaking at 3.03 inches (77 mm) in Naguabo.[73]
Tropical Storm Hermine
| Tropical storm (SSHWS) | |||
|---|---|---|---|
| |||
| Duration | September 5 – September 9 | ||
| Peak intensity | 70 mph (110 km/h) (1-min) 989 mbar (hPa) | ||

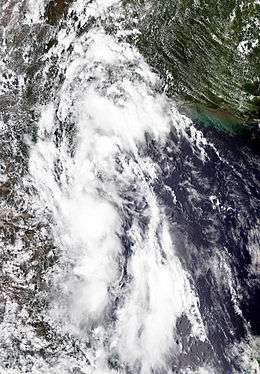
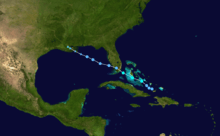
Hermine formed out of the remnants of the 2010 Pacific hurricane season's Tropical Depression Eleven-E in the Bay of Campeche. Organization continued and by the very early morning hours on September 6, a tropical depression formed. Later, during the morning hours, the system achieved enough organization to be classified as the eighth tropical storm of the season, and was named Hermine. Significant strengthening took place later that morning, then slow strengthening continued in the afternoon and evening. Before landfall, Hermine had an eye-like feature. Hermine made landfall that evening in northeastern Mexico, south of Matamoros, Tamaulipas, as a strong tropical storm with 70 mph (110 km/h) winds. After landfall, Hermine maintained an eye-like feature until shortly after weakening into a depression.
Damage was reported in the Rio Grande Valley region, primarily due to downed trees and power lines and scattered to widespread power outages.[74] A woman drowned in a rip current related to Hermine in Jamaica Beach, Texas.[75] On the evening of September 7, 2010, multiple Tornado Warnings were issued in Austin, Texas, with two confirmed touchdowns east of the city and one in the city. By 10:00 pm (CDT) the NHC issued its final advisory on Hermine as it weakened to a tropical depression.[76] Hermine slowly weakened some more as it continued farther inland, and then it became extratropical over Oklahoma early on September 9. Hermine's remnants continued to produce heavy rain and tornadoes as it continued inland, with the circulation dissipating on September 10 over Kansas.
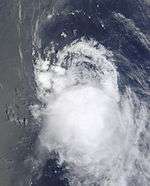
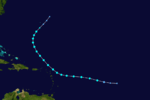
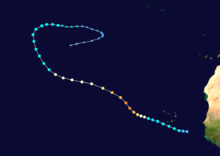
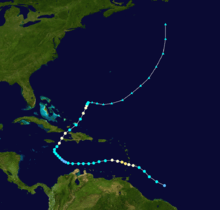
Hurricane Igor
| Category 4 hurricane (SSHWS) | |||
|---|---|---|---|
| |||
| Duration | September 8 – September 21 | ||
| Peak intensity | 155 mph (250 km/h) (1-min) 924 mbar (hPa) | ||


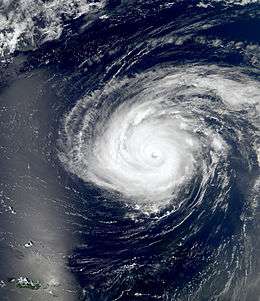
Following the pattern of a classic Cape Verde-type storm, a large and strong area of low pressure associated with broad tropical disturbance wave emerged off Western Africa on September 6. It quickly organized and became a tropical depression during the very early morning hours of September 8 and soon became the ninth tropical storm of the season, Tropical Storm Igor. It formed farther to the east than the previous tropical cyclones in 2010, being named while southeast of the Cape Verde islands.
Interaction with another vigorous tropical low and eastern wind shear weakened the storm on September 9. The interaction and weak steering currents brought the storm almost to a halt, meandering around the Cape Verde islands before weakening to a tropical depression as it absorbed the secondary low. The storm regained tropical storm status on September 10, and began to organize again. It rapidly deepened and briefly developed an eye-like feature early on September 11, which persisted for two hours. As Igor absorbed dry air, a process called entrainment, convection decreased, and much of the convection was displaced south of Igor. The storm strengthened into a hurricane, though, late on September 11.
After some slight strengthening, the storm rapidly strengthened early on September 12, and became a Category 4 hurricane that afternoon. Further intensification continued although at a somewhat slower rate in the evening before leveling out in intensity the next morning as a strong Category 4 storm. As Igor entered an eyewall replacement cycle, its winds decreased a little, but still maintained Category 4 status. However, almost a day later, the eye became better defined, and Igor continued its strengthening streak again, nearly reaching Category 5 intensity early on September 15. However, several hours later, Igor entered another larger eyewall replacement cycle, this time much more obvious, and weakened down to a lower-end Category 4 hurricane. On September 16, Igor reached a diameter of 505 miles (813 kilometres). As it headed toward Bermuda, the storm fluctuated between a moderate to strong Category 2 Hurricane. On September 19, the weakened storm battered Bermuda as a Category 1 hurricane. On September 20, the storm grew further to a size of 660 miles (1,062 kilometres). Prior to becoming fully extratropical the storm grew further to 865 miles (1,392 kilometres). During the day on September 21, Hurricane Igor made landfall in extreme southeastern Newfoundland, bringing tropical storm and hurricane-force winds, as well as extreme flooding across the island. The storms impacts on Newfoundland were devastating, with damage stated to be the worst ever seen in areas, with at least one person missing (suspected drowning – confirmed 4 days later with recovery of the body of an 80-year-old resident).[77] Igor became extratropical east of Newfoundland on September 21. Hurricane Igor's extratropical remnants were completely absorbed by a larger extratropical storm in Baffin Bay on September 26, and the extratropical storm moved into the Greenland glacier at southern Davis Bay, and eventually crossed the Atlantic Ocean to impact Europe.
Warnings of storm tides up to 14 feet (4.3 m) were issued by the Haitian Red Cross on September 17, for parts of Northern Haiti as Igor passed to the north.[78]
Hurricane Julia
| Category 4 hurricane (SSHWS) | |||
|---|---|---|---|
| |||
| Duration | September 12 – September 20 | ||
| Peak intensity | 140 mph (220 km/h) (1-min) 948 mbar (hPa) | ||

Continuing a run of Cape Verde-type storms, Tropical Depression Twelve formed on September 12 from a strong tropical wave which developed near the African Coast. It strengthened into Tropical Storm Julia early on September 13. That day Tropical Storm Julia hit the Cape Verde Islands with strong winds to the where forecasters expect the storm to drop 2 to 4 inches (50 to 100 mm) of rain in the south of the islands.[79] It was the second storm to directly impact the Cape Verde islands in less than a week. During the night of September 14, an eye-like feature developed, and Julia intensified into a hurricane. Contrary to all of the anticipated forecasts and computer models, rapid intensification commenced early on September 15, and Julia strengthened into a Category 4 storm early that morning, with a peak intensity of 140 mph (220 km/h).[80]
Upon reaching peak intensity at 31.8°W, Julia became the easternmost Category 4 hurricane on record in the Atlantic basin in the satellite era.[81] However, Julia only maintained Category 4 status briefly, and a few hours later, the eye became ill-defined and the storm weakened to a Category 3. Slow weakening continued, and it weakened to a tropical storm on September 18. On September 20, Julia became an extratropical cyclone, which dropped south and then westward over succeeding days, occasionally developing a few thunderstorms near its center until dissipating on September 25.[82]
Hurricane Karl
| Category 3 hurricane (SSHWS) | |||
|---|---|---|---|
| |||
| Duration | September 14 – September 18 | ||
| Peak intensity | 125 mph (205 km/h) (1-min) 956 mbar (hPa) | ||
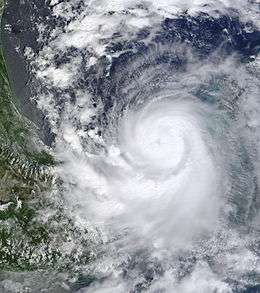
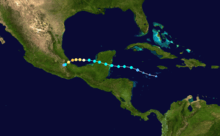
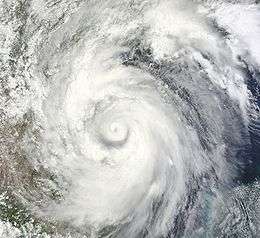
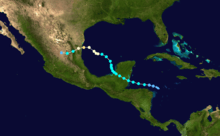
An area of low pressure stalled around the Northern Venezuela coast on September 11. It moved northward and then westward, bringing squally weather to Hispaniola and Jamaica. Convection fluctuated throughout these days. On September 14, the circulation became very well defined and NHC declared the disturbance Tropical Storm Karl, 315 mi (515 km) east of the Yucatan Peninsula. It made landfall as a strong tropical storm on the morning of September 15. As it moved inland, radar imagery from Belize depicted a developing eye; however, this feature may not have been associated with further strengthening and it is unclear if the system attained hurricane intensity as it moved inland.[83] The system maintained a well-organized structure as it crossed the Yucatan, and held on to tropical storm status. As it emerged over the Bay of Campeche early on September 16, a bout of rapid intensification occurred. Karl became a hurricane on the morning of September 16, making three active hurricanes in the Atlantic Basin. The quick strengthening continued on the 17th, and became a Category 3 Hurricane. The rapid intensification of Karl marked the first time that a major hurricane was in the Bay of Campeche. The storm made landfall 10 miles (16 km) north of Veracruz, Mexico on September 17 at 16:30 UTC (11:30 am CDT). This made it the first major hurricane to make landfall anywhere in the Atlantic basin since Hurricane Ike in 2008, and the first major hurricane to make landfall anywhere on the coast of the Gulf of Mexico since Hurricane Wilma in 2005.
Throughout Quintana Roo, heavy rains from Karl resulted in scattered flooding which forced 150 families from their homes. Aside from the flooding, there were no reports of major damage.[84] At the height of the storm, a total of 54,265 residents were without power; however, most had their electricity restored within a day.[85] World oil prices rose somewhat on September 17 as oil giant Pemex shut down all the wells in the Mexican gulf coast because of the strengthening storm. The prices climbed 54 cents to 75.11 dollars a barrel.[86] The storm weakened late on September 17, and became a tropical storm. A few hours later, Karl weakened into a tropical depression, and then dissipated over the high mountains of southern Mexico at 4:00 CDT, September 18, according to the NHC.
Hurricane Lisa
| Category 1 hurricane (SSHWS) | |||
|---|---|---|---|
| |||
| Duration | September 20 – September 26 | ||
| Peak intensity | 85 mph (140 km/h) (1-min) 982 mbar (hPa) | ||

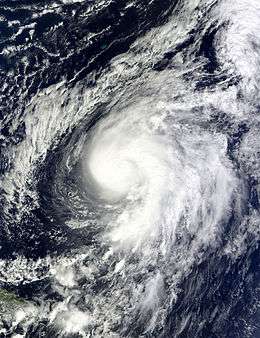
Following three consecutive major hurricanes, a new tropical wave moved off the west coast of Africa on September 16. It was initially in an area of dry air unfavorable for development.[87] Over the following few days, a broad area of low pressure developed within the wave. By September 19, the low became increasingly organized, with convection consolidating around it. Around 1800 UTC the following day, the NHC classified the low as a tropical depression, the fourteenth of the year. At this time, the depression was situated roughly 460 mi (740 km) west of the Cape Verde Islands. Situated in an area of weak steering currents, due to an unusually weak subtropical ridge, the depression slowly tracked northward. Six hours after being declared a depression, the system intensified into a tropical storm and was given the name Lisa. After attaining winds of 45 mph (75 km/h), Lisa became embedded within a westerly flow, slowly steering the system towards the east.[88] Late on September 22, dry air entered the storm's circulation, causing convection to diminish. Lisa briefly weakened to a tropical depression, but it regained tropical storm intensity 18 hours after losing it.[88] The storm gradually turned towards the north and later north-northeast in response to a low-to-mid-level ridge over Africa.[89]
Early on September 24, Lisa underwent a period of rapid intensification as it strengthened into a Category 1 hurricane; winds increased from 40 mph (65 km/h) to 75 mph (120 km/h) during a 21‑hour span. Following the development of a small eye on infrared satellite imagery, the NHC assessed the storm to have attained its peak intensity early on September 25 with winds of 85 mph (140 km/h) and a barometric pressure of 982 mbar (hPa; 29.00 inHg). Shortly thereafter, the storm entered a region of significantly higher wind shear and lower sea surface temperatures, resulting in rapid weakening. By the afternoon of September 26, Lisa had weakened to a tropical depression and convective activity dissipated hours later. The remnants of the hurricane persisted for a few days over the northeastern Atlantic Ocean before dissipating roughly 595 mi (960 km) south-southwest of the Azores Islands.[88]
Tropical Storm Matthew
| Tropical storm (SSHWS) | |||
|---|---|---|---|
| |||
| Duration | September 23 – September 26 | ||
| Peak intensity | 60 mph (95 km/h) (1-min) 998 mbar (hPa) | ||


On September 15 an area of low pressure gradually formed east of the Lesser Antilles. On September 23 the area of low pressure rapidly strengthened into Tropical Depression Fifteen, due to the favorable conditions. It quickly became Tropical Storm Matthew later that day. Early models predicted that Matthew would strengthen into a minimal hurricane as it skirted the Yucatan Peninsula, and then strike Southern Florida as a stronger hurricane. However, as Matthew was moving quicker than expected, it made landfall near the Honduras and Nicaragua border on September 24 as a tropical storm, and Belize soon after. As newer models had predicted, it then stalled inland near the Isthmus of Tehuantepec, drenching a wide surrounding area with torrential rain as it dissipated to a remnant low. The remnants of Tropical Storm Matthew dissipated completely over Mexico, west of the Yucatan Peninsula late on September 28.
Tropical Storm Nicole
| Tropical storm (SSHWS) | |||
|---|---|---|---|
| |||
| Duration | September 28 – September 29 | ||
| Peak intensity | 45 mph (75 km/h) (1-min) 995 mbar (hPa) | ||

On the morning of September 25, the NHC began to monitor a disturbed area of disorganized cloudiness and thunderstorms partially related to Tropical Storm Matthew in the northwestern Caribbean Sea. Environmental conditions appeared to be favorable for further gradual development as it slowly drifted northward, and later that day, the disturbance broadened and a monsoonal low formed. The system gradually became more organized and developed into a tropical depression over the northwestern Caribbean Sea on September 28. Further development took place, and the storm attained tropical storm status on September 29. On that same day, a new circulation developed near east Florida in Nicole, and later became the extratropical storm that would later absorb Nicole on September 30. However, six hours later, Nicole dissipated to a remnant low over the Florida Straits as its circulation center became "untrackable" according to the NHC. Later, the remnants of Nicole became extratropical. On September 30, the remnant low of Tropical Storm Nicole was completely absorbed by a larger mid-latitude storm to the north, which was the same storm that split from Nicole and impacted the east coast, just off the coast of South Carolina. This combination, still known as Nicole in the media, proceeded up the coast and into Canada, causing severe flooding and some fatalities in these regions, before exiting into the Atlantic Ocean on October 4.
Hurricane Otto
| Category 1 hurricane (SSHWS) | |||
|---|---|---|---|
| |||
| Duration | October 6 – October 10 | ||
| Peak intensity | 85 mph (140 km/h) (1-min) 976 mbar (hPa) | ||

On September 30, a large area of disturbed weather associated with two tropical waves developed east of the Lesser Antilles. For several days it moved west-northwestward, developing into Subtropical Depression Seventeen on October 6 while located 270 mi (435 km) to the north-northwest of San Juan.[90] It strengthened into Subtropical Storm Otto several hours later; however, additional tropical cyclogenesis occurred during the following hours,[91] and Otto transitioned into a tropical storm by October 7. On October 8, the storm further intensified and attained hurricane status shortly after. On the next day Otto began to weaken, and subsequently developed frontal cloud bands and became a cold core system thus the National Hurricane Center issued the last advisory on October 10. The remnant low of Hurricane Otto continued to drift in the Atlantic Ocean until it dissipated near Portugal on October 16.
Hurricane Paula
| Category 2 hurricane (SSHWS) | |||
|---|---|---|---|
| |||
| Duration | October 11 – October 15 | ||
| Peak intensity | 105 mph (165 km/h) (1-min) 981 mbar (hPa) | ||
A tropical wave developed into a tropical depression on October 11 near the northeastern Honduran coast. The system continued to intensify rapidly, and the NHC issued the formation of Tropical Storm Paula later that day. In the early hours of October 12, Paula intensified into a Category 1 hurricane becoming the ninth hurricane of the season. Paula continued to strengthen and was upgraded to a Category 2 hurricane later that day. It was forecast to strengthen a little more; however, the next day, Paula began to weaken and was downgraded to a Category 1 hurricane. On October 14, Paula was further downgraded to a tropical storm as it succumbed to the effects of wind shear, and it weakened to a tropical depression the next day. The remnants of Hurricane Paula continued to impact Cuba until it dissipated on October 16.
Hurricane Richard
| Category 2 hurricane (SSHWS) | |||
|---|---|---|---|
| |||
| Duration | October 20 – October 25 | ||
| Peak intensity | 100 mph (155 km/h) (1-min) 977 mbar (hPa) | ||


A persistent tropical disturbance in the western Caribbean Sea was designated as Tropical Depression Nineteen south of the Cayman Islands on October 20. The depression was upgraded to a tropical storm on the morning of October 21, whereupon it was given the name Richard. On October 24, Richard was upgraded to a hurricane, with further strengthening predicted before landfall in Belize. Shortly before landfall, it developed a small, cloudy eye. It made landfall that evening as a Category 2 hurricane south of Belize City. It later weakened to a tropical depression over land as it crossed the Yucatán Peninsula, with its small eye dissipating and much of its cloud structure disappearing. Richard degenerated into a remnant low on October 26, but then turned back east as the system was forced to because of the strong wind shear. After the storm reached the Yucatán Peninsula, the system began turning north until it reached the Gulf of Mexico. The remnants of Hurricane Richard continued to move north over the Gulf of Mexico as it weakened, until the system dissipated completely, late on October 27.
Hurricane Shary
| Category 1 hurricane (SSHWS) | |||
|---|---|---|---|
| |||
| Duration | October 28 – October 30 | ||
| Peak intensity | 75 mph (120 km/h) (1-min) 989 mbar (hPa) | ||


Hurricane Shary originated from a weak area of convection associated with an upper-level low that formed on October 27, northeast of the Leeward Islands.[92] By October 28, conditions were becoming favorable for development, allowing thunderstorms to increase and for a low-pressure area to form.[93] The overall structure became better defined, and early on October 29 the system developed into Tropical Storm Shary about 350 miles (565 km) southeast of Bermuda. The formation of Shary marked the third time that an Atlantic tropical cyclone received an 'S' name, the other two being Tropical Storm Sebastien of 1995 and Hurricane Stan of 2005 (later on there would be Tropical Storm Sean in 2011 and Hurricane Sandy in 2012). On October 30, it was upgraded to Category 1 hurricane, in what the NHC described as a case of a small hurricane that would not have been observed before microwave satellite images. Shary became extratropical later that day, and the NHC issued their final advisory on the system. Shary's extratropical remnants soon interacted with a larger extratropical storm to the east. Early on October 31, the extratropical remnants of Hurricane Shary were completely absorbed by that extratropical storm.
Hurricane Tomas
| Category 2 hurricane (SSHWS) | |||
|---|---|---|---|
| |||
| Duration | October 29 – November 7 | ||
| Peak intensity | 100 mph (155 km/h) (1-min) 982 mbar (hPa) | ||
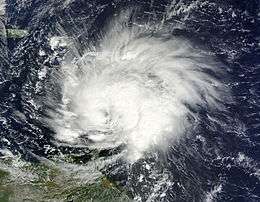
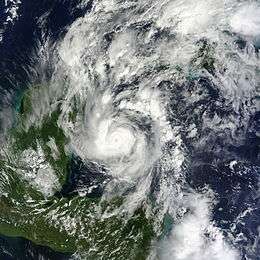
A tropical wave developed into Tropical Storm Tomas late on October 29, about 200 miles (320 km) southeast of Barbados. Tomas become the twelfth hurricane of the season and crossed the Windward Islands as a Category 1 hurricane. After that, southwesterly shear and dry air weakened Tomas to a tropical storm. Tomas continued to weaken slowly until midnight on November 2. Early on November 2, Tropical Storm Tomas re-intensified slightly, but later weakened to a tropical depression. Then on the evening of November 3, Tomas restrengthened into a tropical storm. Early on November 5, it became a hurricane again as it neared Haiti and Cuba. Late on November 7, the NHC issued its last advisory on Tomas as it became as extratropical cyclone. Early on November 10, the extratropical remnants of Hurricane Tomas were absorbed by another extratropical storm southeast of Nova Scotia. It caused $741 million in damages and killed 71 people, of which 14 were in St. Lucia.
It was feared that Tomas would cause a cholera outbreak in Haiti to spread, after the hurricane caused floods in that nation.
Storm names
The following names were used on named storms that formed in the North Atlantic during 2010. The names not retired from this list will be used again in the 2016 season. This is the same list used in the 2004 season with the exception of Colin, Fiona, Igor, and Julia, which replaced the names of the four major hurricanes that affected Florida in the U.S. in 2004: Charley, Frances, Ivan, and Jeanne, respectively.[94] The names Colin, Fiona, Igor, Julia, Paula, Richard, Shary, and Tomas were used to name Atlantic storms for the first time this year. Two names, Virginie and Walter, were not used during the course of the year.
Retirement
On March 16, 2011, at the 33rd Session of the World Meteorological Organization's Regional Association Hurricane Committee, the WMO retired two names, Igor and Tomas from its rotating name lists. They will be replaced with Ian and Tobias, respectively, for the 2016 Atlantic hurricane season.[95]
Season effects
This is a table of the storms and their effects in the 2010 Atlantic hurricane season. This table includes the storm's names, duration, peak intensity, Areas affected (bold indicates made landfall in that region at least once), damages, and death totals. Deaths in parentheses are additional and indirect (an example of an indirect death would be a traffic accident), but are still storm-related. Damage and deaths include totals while the storm was extratropical, a wave or a low. All of the damage figures are in 2010 USD (the listed damage figure is in millions).
| Saffir–Simpson hurricane wind scale | ||||||
| TD | TS | C1 | C2 | C3 | C4 | C5 |
| Storm name |
Dates active | Storm category
at peak intensity |
Max 1-min wind mph (km/h) |
Min. press. (mbar) |
Areas affected | Damage (millions USD) |
Deaths | |||
|---|---|---|---|---|---|---|---|---|---|---|
| Alex | June 25 – July 2 | Category 2 hurricane | 110 (175) | 946 | Greater Antilles, Central America (Belize), Yucatan Peninsula, Northern Mexico, South Texas | 1,885 | 33 (19) | |||
| Two | July 8 – 9 | Tropical depression | 35 (55) | 1005 | Northern Mexico, South Texas | Minimal | 1 | |||
| Bonnie | July 22 – 24 | Tropical storm | 45 (75) | 1005 | Puerto Rico, Hispaniola, Turks and Caicos, Bahamas, Florida | 1.5 | 1 | |||
| Colin | August 2 – 8 | Tropical storm | 60 (95) | 1005 | Leeward Islands, Bermuda, The Carolinas, New England | Minimal | 1 | |||
| Five | August 10 – 11 | Tropical depression | 35 (55) | 1007 | United States Gulf Coast | 7.1 | 0 (2) | |||
| Danielle | August 21 – 30 | Category 4 hurricane | 130 (215) | 942 | Bermuda, United States East Coast | Minimal | 2 | |||
| Earl | August 25 – September 4 | Category 4 hurricane | 145 (230) | 927 | Leeward Islands, Puerto Rico, Bahamas, Eastern United States, Atlantic Canada, Quebec | 44.6 | 5 (3) | |||
| Fiona | August 30 – September 3 | Tropical storm | 65 (100) | 998 | Leeward Islands, Bermuda | Minimal | None | |||
| Gaston | September 1 – 2 | Tropical storm | 40 (65) | 1005 | Leeward Islands, Puerto Rico | None | None | |||
| Hermine | September 5 – 9 | Tropical storm | 70 (110) | 989 | Central America, Mexico, Texas, Oklahoma, Kansas | 740 | 6 (2) | |||
| Igor | September 8 – 21 | Category 4 hurricane | 155 (250) | 924 | Cape Verde, Leeward Islands, Bermuda, United States East Coast, Newfoundland | 200 | 4 | |||
| Julia | September 12 – 20 | Category 4 hurricane | 140 (220) | 948 | Cape Verde | Minimal | None | |||
| Karl | September 14 – 18 | Category 3 hurricane | 125 (205) | 956 | Belize, Yucatán Peninsula, Veracruz | 206 | 22 | |||
| Lisa | September 20 – 26 | Category 1 hurricane | 85 (140) | 982 | None | None | None | |||
| Matthew | September 23 – 26 | Tropical storm | 60 (95) | 998 | Venezuela, Central America (Nicaragua, Belize), Mexico, Jamaica, Haiti | 171.2 | 126 | |||
| Nicole | September 28 – 29 | Tropical storm | 45 (75) | 995 | Cayman Islands, Jamaica, Cuba, Florida, Bahamas, United States East Coast | 235.4 | 13 | |||
| Otto | October 6 - 10 | Category 1 hurricane | 85 (140) | 976 | Leeward Islands, Virgin Islands, Puerto Rico | 22 | None | |||
| Paula | October 11 – 15 | Category 2 hurricane | 105 (165) | 981 | Nicaragua, Honduras, Mexico, Cuba, Bahamas, Florida | 200 | 1 | |||
| Richard | October 20 – 26 | Category 2 hurricane | 100 (155) | 977 | Honduras, Belize, Guatemala, Mexico | 80 | 1 (1) | |||
| Shary | October 28 – 30 | Category 1 hurricane | 75 (120) | 989 | Bermuda | Minimal | None | |||
| Tomas | October 29 – November 7 | Category 2 hurricane | 100 (155) | 982 | Windward Islands (Barbados, St. Vincent), Leeward Antilles, Greater Antilles, Lucayan Archipelago (Caicos Islands) | 741 | 71 | |||
| Season Aggregates | ||||||||||
| 21 cyclones | June 25 – November 7 | 155 (250) | 924 | ≥4534 | 287 (27) | |||||
Accumulated Cyclone Energy (ACE)
| ACE (104kt²) (Source) — Storm: | |||||
|---|---|---|---|---|---|
| 1 | 41.9 | Igor | 11 | 4.05 | Lisa |
| 2 | 27.7 | Earl | 12 | 3.08 | Fiona |
| 3 | 21.1 | Danielle | 13 | 2.10 | Shary |
| 4 | 15.5 | Julia | 14 | 1.87 | Colin |
| 5 | 11.9 | Tomas | 15 | 1.58 | Hermine |
| 6 | 7.71 | Alex | 16 | 1.51 | Matthew |
| 7 | 7.54 | Paula | 17 | 0.688 | Nicole |
| 8 | 6.25 | Karl | 18 | 0.405 | Bonnie |
| 9 | 5.39 | Otto | 19 | 0.245 | Gaston |
| 10 | 4.98 | Richard | |||
| Total: 165 | |||||
The table on the right shows the ACE for each storm in the season. Broadly speaking, the ACE is a measure of the power of a hurricane multiplied by the length of time it existed, so storms that last a long time, as well as particularly strong hurricanes, have high ACEs. ACE is calculated for only full advisories on specifically tropical systems reaching or exceeding wind speeds of 34 knots (39 mph, 63 km/h), or tropical storm strength. Accordingly, tropical depressions are not included here. Hurricane Igor's ACE is the highest for any Atlantic storm since Hurricane Ivan in the 2004 season, as Igor was strong and long-lasting. During the season, the ACE is based on the operational advisories. Later the NHC reexamines the data, and produces a final report on each storm, which can lead to the ACE for a storm being revised either upward or downward. Until the final reports are issued, ACEs are, therefore, provisional.
See also
- List of Atlantic hurricane seasons
- 2010 Pacific hurricane season
- 2010 Pacific typhoon season
- 2010 North Indian Ocean cyclone season
- South-West Indian Ocean cyclone seasons: 2009–10, 2010–11
- Australian region cyclone seasons: 2009–10, 2010–11
- South Pacific cyclone seasons: 2009–10, 2010–11
- Timeline of the 2010 Atlantic hurricane season
References
- ↑ Masters, Jeff. "Unprecedented Hurricane Tomas pounding the Lesser Antilles". Wunderground.com. Archived from the original on November 2, 2010. Retrieved October 31, 2010.
- ↑ http://www.tropicalstormrisk.com/docs/TSR-hurricane-and-typhoon-review-2010.pdf
- ↑ "Background Information: The North Atlantic Hurricane Season". Expert Assessments. Climate Prediction Center. Archived from the original on June 3, 2010. Retrieved June 10, 2010.
- 1 2 Philip J. Klotzbach; William M. Gray (December 10, 2009). "Extended Range Forecast of Atlantic Seasonal Hurricane Activity and U.S. Landfall Strike Probability for 2010" (PDF). Colorado State University. Archived (PDF) from the original on January 5, 2010. Retrieved December 10, 2009.
- ↑ National Hurricane Center (May 22, 2008). "NOAA Atlantic Hurricane Season Classifications". National Oceanic and Atmospheric Administration. Archived from the original on June 12, 2009. Retrieved November 28, 2009.
- ↑ Philip J. Klotzbach; William M. Gray (April 10, 2010). "Extended Range Forecast of Atlantic Seasonal Hurricane Activity and U.S. Landfall Strike Probability for 2010" (PDF). Colorado State University. Archived (PDF) from the original on April 15, 2010. Retrieved April 10, 2010.
- 1 2 Peake, Tracey (April 26, 2010). "NC State Predicts Active Atlantic Hurricane Season for 2010". Lian Xie, Montserrat Fuentes, Danny Modlin. North Carolina State University. Archived from the original on April 30, 2010. Retrieved May 2, 2010.
- ↑ National Hurricane Center (May 27, 2010). "NOAA Expects Busy Atlantic Hurricane Season". National Oceanic and Atmospheric Administration. Archived from the original on May 30, 2010. Retrieved May 28, 2010.
- ↑ Center for Ocean-Atmospheric Prediction Studies. "FSU COAPS Atlantic Hurricane Season Forecast Archive". Florida State University. Archived from the original on June 19, 2011. Retrieved June 16, 2011.
- ↑ Kate Spinner (June 2, 2010). "Klotzbach and Gray up their forecast for hurricane season". The Sarasota Herald-Tribune. Archived from the original on June 6, 2010. Retrieved June 2, 2010.
- ↑ Philip J. Klotzbach; William M. Gray (June 2, 2010). "Extended Range Forecast of Atlantic Seasonal Hurricane Activity and Landfall Strike Probability for 2010" (PDF). Colorado State University. Retrieved June 2, 2010.
- ↑ "Active hurricane season predicted". June 17, 2010. Retrieved June 17, 2010.
- ↑ "NOAA Still Expects Active Atlantic Hurricane Season; La Niña Develops". National Oceanic and Atmospheric Administration. August 5, 2010. Archived from the original on August 7, 2010. Retrieved August 5, 2010.
- ↑ Comisión Nacional del Agua (July 1, 2010). "Alex provocó lluvias torrenciales superiores a las de Gilberto, en 1988" (PDF) (in Spanish). Secretaría del Medio Ambiente y Recursos Naturales. Retrieved July 2, 2010.
- ↑ http://www.wpc.ncep.noaa.gov/tropical/rain/tcmexicostatemaxima.gif
- ↑ Hernández Unzón, Alberto; Bravo Lujano, Cirilo (2010). "Reseña del huracán "Alex" del Océano Atlántico" (PDF) (in Spanish). Servicio Meteorológico Nacional. Retrieved October 23, 2010.
- ↑ Padilla Sada, Eduardo (August 5, 2010). "Rebasan pronósticos: Daños por 17 mil mdp" (in Spanish). Retrieved August 5, 2010.
- ↑ Staff writer (July 21, 2010). "Gobernador da a conocer afectaciones de Alex a Felipe Calderón". Milenio. Retrieved July 23, 2010.
- ↑ Escamilla Martínez, Josué (July 17, 2010). "Más de mil mdp daño preliminar por "Alex": EHF". El Diario (in Spanish). Ciudad Victoria, Tamaulipas. Retrieved July 18, 2010.
- 1 2 Richard Pasch (December 15, 2010). "Hurricane Alex Tropical Cyclone Report" (PDF). Retrieved January 15, 2011.
- ↑ National Oceanic Atmospheric Administration (November 29, 2010). "Extremely Active Atlantic Hurricane Season was a 'Gentle Giant' for U.S.". Archived from the original on January 3, 2011. Retrieved January 15, 2011.
- ↑ Angela Fritz (November 30, 2010). "2010 Atlantic hurricane season comes to a close". CNN. Archived from the original on December 2, 2010. Retrieved January 15, 2011.
- ↑ Staff and news service reports, msnbc.com (July 1, 2010). "Alex weakens, but rain pounds coast—Matamoros, Mexico, 'is practically under water,' official says". MSNBC. Archived from the original on July 3, 2010. Retrieved July 1, 2010.
- ↑ News services, msnbc.com (June 30, 2010). "Alex spreads tar balls, oily water along Gulf". MSNBC. Archived from the original on July 2, 2010. Retrieved July 1, 2010.
- ↑ Moore, Jennifer (June 30, 2010). "Alex Hits South Texas". Eyewitness News 9. Retrieved July 1, 2010.
- ↑ Water, NWS. "Rio Grande at Foster Ranch". National Weather Service. National Oceanic and Atmospheric Administration. Retrieved July 3, 2010.
- ↑ Gerhardt, Mary (July 10, 2010). "Tropical Depression Two Advisory Number Nine". Hydrometeorological Prediction Center. Retrieved October 24, 2010.
- ↑ Laura C. Morel; Daniel Chang; Howard Cohen (July 23, 2010). "Little flooding, damage as Tropical Storm Bonnie passes South Florida". Retrieved August 17, 2010.
- ↑ Christopher O'Donnell (August 14, 2010). "Deaths show secluded beaches carry some risk". Herald Tribune. Archived from the original on August 16, 2010. Retrieved August 16, 2010.
- ↑ Staff Writer (August 9, 2010). "Maryland man drowns in North Carolina". WVEC. Archived from the original on August 9, 2010. Retrieved August 9, 2010.
- ↑ Steve Lyttle (August 31, 2010). "Hurricane watch posted; N.C. evacuations planned". The Charlotte Observer. Archived from the original on October 31, 2010. Retrieved October 31, 2010.
- ↑ Hurricane Research Division (March 2011). "Atlantic basin Comparison of Original and Revised HURDAT". National Oceanic and Atmospheric Administration. Archived from the original on November 29, 2011. Retrieved July 23, 2011.
- ↑ David Levinson (August 20, 2008). "2005 Atlantic Ocean Tropical Cyclones". National Climatic Data Center. Retrieved July 23, 2011.
- ↑ Kleinberg, Eliot. "First tropical depression of the 2010 Atlantic season forms in the Caribbean". The Palm Beach Post. Archived from the original on November 15, 2010. Retrieved November 25, 2010.
- ↑ Brian K. Sullivan (June 30, 2010). "Hurricane Alex Gathers Strength as It Nears Mexico". Bloomberg Businessweek. Archived from the original on July 3, 2010. Retrieved July 5, 2010.
- ↑ Satellite and Information Service Division (April 17, 2005). "Dvorak Current Intensity Chart". National Oceanic and Atmospheric Administration. Archived from the original on June 17, 2006. Retrieved June 12, 2006.
- ↑ Robbie Berg (July 3, 2010). "Tropical Weather Outlook". National Hurricane Center. Retrieved July 8, 2010.
- ↑ Blake/Kimberlain (July 4, 2010). "Tropical Weather Outlook". National Hurricane Center. Retrieved July 8, 2010.
- ↑ Stewart/Cangialosi (July 5, 2010). "Tropical Weather Outlook". National Hurricane Center. Retrieved July 8, 2010.
- ↑ Eric Brown (July 7, 2010). "Tropical Weather Outlook". National Hurricane Center. Retrieved July 8, 2010.
- 1 2 Stewart/Cangialosi (July 8, 2010). "Tropical Depression Two Discussion One". National Hurricane Center. Archived from the original on July 11, 2010. Retrieved July 8, 2010.
- ↑ Hurricane EARL Update Statement
- ↑ "Tropical Depression 3 becomes Bonnie". NHC. July 22, 2010. Archived from the original on July 25, 2010. Retrieved July 10, 2010.
- ↑ Gutman/Hendren/Blackburn, Matt/John/Bradley. "BP Oil Spill: Gov. Bobby Jindal Declares State of Emergency as Tropical Storm Bonnie Heads to Gulf". abc NEWS. Retrieved November 25, 2010.
- ↑ CNN Wire Staff (July 23, 2010). "Tropical Storm Bonnie makes landfall in Florida". CNN. Archived from the original on July 24, 2010. Retrieved July 23, 2010.
- ↑ Dishneau, David; Weber, Harry R. (July 24, 2010). "Ships prepare to return to spill as storm weakens". Toledo Blade. Associated Press. Retrieved July 24, 2010.
- ↑ David M. Roth (November 22, 2010). "Tropical Storm Bonnie – July 22–25, 2010". Hydrometeorological Prediction Center. Retrieved November 22, 2010.
- ↑ Brennan, Michael. "New Tropical Depression forms in the Atlantic". National Hurricane enter. Retrieved November 25, 2010.
- ↑ "NHC Graphical Outlook Archive". US National Hurricane Center. Retrieved September 9, 2010.
- ↑ "All Products by Site – NOAA's National Weather Service". US National Weather Service. September 5, 2010. Retrieved September 9, 2010.
- ↑ Stacy Stewart (September 8, 2010). "Tropical Weather Outlook". National Hurricane Center. Retrieved October 8, 2010.
- ↑ Stacy Stewart (September 8, 2010). "Tropical Weather Outlook (2)". National Hurricane center. Retrieved October 8, 2010.
- ↑ "Tropical Depression Five forms". NHC. August 11, 2010. Archived from the original on September 10, 2010. Retrieved August 11, 2010.
- ↑ "BP suspends Relief well drilling". The Wall Street Journal. October 8, 2010. Retrieved October 8, 2010.
- ↑ http://www.nhc.noaa.gov/data/tcr/AL052010_Five.pdf
- ↑ Blake (August 21, 2010). "Tropical Depression Six Discussion Number 1". National Hurricane Center. Archived from the original on August 24, 2010. Retrieved August 21, 2010.
- ↑ "Hurricane Earl spares insurers". MarketWatch. Retrieved September 9, 2010.
- ↑ Dorell, Oren (September 3, 2010). "Weakening Hurricane Earl takes aim at New England". USA Today. Retrieved September 9, 2010.
- ↑ Adrian Walker (September 4, 2010). "Earl doesn't lay a glove on Mass". The Boston Globe. Archived from the original on September 7, 2010. Retrieved September 9, 2010.
- ↑ Cangialosi, John P. (January 13, 2011). "Hurricane Earl Tropical Cyclone Report" (PDF). National Hurricane Center. Retrieved January 18, 2011.
- ↑ Anthony R. Wood; Jacqueline L. Urgo (September 2, 2010). "Hurricane Earl likely to spare Jersey Shore". The Philadelphia Inquirer. Archived from the original on September 2, 2010. Retrieved September 2, 2010.
- ↑ Tara Brautigam (September 4, 2010). "Man drowns as Hurricane Earl barrels through Maritimes". The Toronto Star. Archived from the original on September 8, 2010. Retrieved September 9, 2010.
- 1 2 3 4 5 Robbie Berg (October 18, 2010). Tropical Storm Fiona Tropical Cyclone Report (PDF) (Report). National Hurricane Center. Retrieved December 4, 2012.
- ↑ Robbie Berg (August 30, 2010). "Tropical Storm Forecast Discussion 1, August 30, 2010 5:00PM EDT". National Hurricane Center. Retrieved August 30, 2010.
- ↑ Eric Blake (August 30, 2010). "Tropical Storm Forecast Discussion 2, August 30, 2010 11:00PM EDT". National Hurricane Center. Retrieved August 31, 2010.
- ↑ Eric Blake (August 31, 2010). "Tropical Storm Forecast Discussion 6, August 31, 2010 11:00PM AST". National Hurricane Center. Retrieved September 1, 2010.
- ↑ "Climate data for Bermuda - September 2010". Bermuda Weather Service. 2010-10-01. Retrieved 2010-11-07.
- 1 2 3 4 Blake, Eric (November 18, 2010). "Tropical Storm Gaston Tropical Cyclone Report" (PDF). National Hurricane Center. Retrieved November 19, 2010.
- ↑ Landsea, Christopher; Blake, Eric (September 1, 2010). "Tropical Depression Nine Advisory Number One". National Hurricane Center. Retrieved November 19, 2010.
- ↑ Blake, Eric (September 1, 2010). "Tropical Storm Gaston Advisory Number Two". National Hurricane Center. Retrieved November 19, 2010.
- ↑ Berg, Robbie (September 2, 2010). "Tropical Storm Gaston Discussion Number Three". National Hurricane Center. Retrieved December 17, 2010.
- ↑ Berg, Robbie (September 2, 2010). "Tropical Depression Gaston Discussion Number Five". National Hurricane Center. Retrieved December 17, 2010.
- ↑ Roth, David (October 15, 2010). "Remnants of Gaston – September 6–7, 2010". Hydrometeorological Prediction Center. Retrieved December 17, 2010.
- ↑ "Hermine Leaves Damage in its Wake". KTSM News Channel 9. Retrieved September 9, 2010.
- ↑ "National Weather Service Watch Warning Advisory Summary". US National Weather Service. May 16, 2007. Retrieved September 9, 2010.
- ↑ "Final advisory on Hermine". NHC. September 7, 2010. Retrieved September 8, 2010.
- ↑ Hurricane Igor rips into Nfld., washing out roads, toppling trees. thestar.com (2010-09-22). Retrieved on December 16, 2010.
- ↑ Cochrane, Matthew. "Haiti: Storm surge warning issued for north coast". International Federation of Red Cross And Red Crescent Societies. ReliefWeb. Retrieved September 18, 2010.
- ↑ "Archived copy". Archived from the original on July 22, 2011. Retrieved 2015-01-06.
- ↑ http://199.9.2.143/tcdat/tc10/ATL/12L.JULIA/trackfile.txt
- ↑ Michael J. Brennan (October 23, 2009). "Hurricane Fred Tropical Cyclone Report" (PDF). National Hurricane Center. Retrieved September 15, 2010.
- ↑ http://www.nhc.noaa.gov/data/tcr/AL122010_Julia.pdf
- ↑ Jack L. Beven (September 15, 2010). "Tropical Storm Karl Discussion Four". National Hurricane Center. Archived from the original on September 21, 2010. Retrieved September 15, 2010.
- ↑ Staff Writer (September 16, 2010). ""Karl" sólo causa inundaciones en Quintana Roo y alerta en Campeche" (in Spanish). Yucatan Media. Retrieved September 16, 2010.
- ↑ Staff Writer (September 16, 2010). "Daños eléctricos en Quintana Roo a causa de la tormenta "Karl"" (in Spanish). Artículo 7. Archived from the original on September 17, 2010. Retrieved September 16, 2010.
- ↑ Pemex (September 17, 2010). "Oil prices rise as hurricane Karl shuts platforms". AFP. Archived from the original on September 20, 2010. Retrieved September 17, 2010.
- ↑ Kimberlain, Todd; Pasch, Richard (September 17, 2010). "Tropical Weather Outlook". National Hurricane Center. Retrieved October 15, 2010.
- 1 2 3 Daniel P. Brown (November 15, 2010). "Hurricane Lisa Tropical Cyclone Report" (PDF). National Hurricane Center. Retrieved November 18, 2010.
- ↑ Todd L. Kimberlain (September 24, 2010). "Tropical Storm Lisa Discussion Fourteen". National Hurricane Center. Retrieved November 20, 2010.
- ↑ Blake, Eric (September 6, 2010). "Subtropical Depression Seventeen Advisory Number 1". National Hurricane Center. Archived from the original on October 10, 2010. Retrieved September 6, 2010.
- ↑ Blake, Eric (October 6, 2010). "Subtropical Depression Seventeen Discussion Number 1". National Hurricane Center. Archived from the original on October 12, 2010. Retrieved October 6, 2010.
- ↑ Richard Pasch; Todd Kimberlain (October 27, 2010). "Tropical Weather Outlook". National Hurricane Center. Retrieved October 28, 2010.
- ↑ Eric Blake; Daniel Brown (October 28, 2010). "Tropical Weather Outlook". National Hurricane Center. Retrieved October 28, 2010.
- ↑ "Retired Hurricane Names Since 1954". National Hurricane Center. Retrieved November 29, 2009.
- ↑ http://www.nhc.noaa.gov/pdf/tropical_cyclone_names_retired_2011.pdf
External links
- HPC rainfall page for 2010 Tropical Cyclones
- National Hurricane Center Website
- Satellite loop of the entire 2010 Atlantic Hurricane season with each named storm labeled
Tropical cyclones of the 2010 Atlantic hurricane season | ||
|---|---|---|
| ||
| ||