2011 Atlantic hurricane season
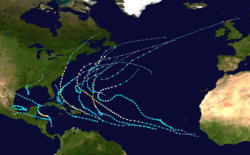 | |
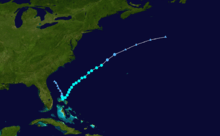
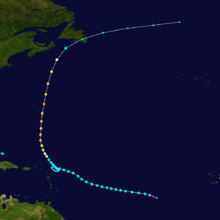
| Season summary map | |
| First system formed | June 28, 2011 |
|---|---|
| Last system dissipated | November 11, 2011 |
| Strongest storm1 | Ophelia – 940 mbar (hPa) (27.76 inHg), 140 mph (220 km/h) |
| Total depressions | 20 |
| Total storms | 19 |
| Hurricanes | 7 |
| Major hurricanes (Cat. 3+) | 4 |
| Total fatalities | 100 direct, 14 indirect |
| Total damage | ≥ $18.585 billion (2011 USD) |
| 1Strongest storm is determined by lowest pressure | |
2009, 2010, 2011, 2012, 2013 | |
| Related article | |
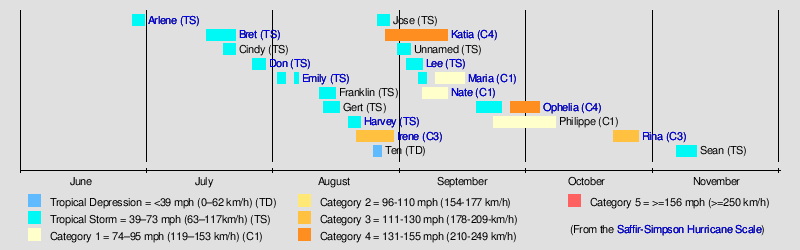
The 2011 Atlantic hurricane season is tied with 1887, 1995, 2010, and the following 2012 season for the third highest number of named storms since record-keeping began in 1851. The season officially began on June 1 and ended on November 30, dates which conventionally delimit the period during each year in which most tropical cyclones develop in the Atlantic Ocean. However, the first tropical storm of the season, Arlene, did not develop until nearly a month later. The final system, Tropical Storm Sean, dissipated over the open Atlantic on November 11. Despite unfavorable conditions, seven storms reached Category 1 strength and four of those storms reached major hurricane status (Irene, Katia, Ophelia and Rina). Katia and Ophelia reached Category 4 status and tied with strongest winds, yet Ophelia reached overall peak. (Operationally, the year featured eighteen tropical storms; in post-season analysis, the National Hurricane Center (NHC) determined that an unnamed tropical storm developed in late August, north of Bermuda.)
Due to the presence of a La Niña in the Pacific Ocean, many pre-season forecasts called for an above-average hurricane season. In Colorado State University (CSU)'s spring outlook, the organization called for 16 named storms and 9 hurricanes, of which 4 would intensify further into major hurricanes. On May 19, 2011, the National Oceanic and Atmospheric Administration (NOAA) issued their pre-season forecast, predicting 12–18 named storms, 6–10 hurricanes, and 3–6 major hurricanes. Following a quick start to the season, NOAA subsequently increased their outlook to 14–19 named storms, 7–10 hurricanes, and 3–5 major hurricanes on August 4; CSU made no changes to the number of cyclones forecast throughout the year.
Many tropical cyclones affected land during the 2011 season; most impacts, however, did not result in a significant loss of life or property. On June 29, Arlene moved ashore near Cabo Rojo, Mexico, causing minor damage and killing 22. Roughly a month later, Tropical Storm Don made landfall in southern Texas; no fatalities nor damage was reported. Tropical Storm Harvey moved into the coastline of Central America in mid-August, and three deaths were reported as a result. During the month of September, Tropical Storm Lee and Hurricane Nate moved into the central United States Gulf Coast and central Mexico, respectively; the former led to 18 deaths, and the latter 5 deaths. As an extratropical cyclone, Lee caused significant damage in the form of flooding across the Northeast United States, especially in New York and Pennsylvania. The deadliest and most destructive cyclone of the season developed east of the Lesser Antilles on August 21. Hurricane Irene caused significant damage across many of the Caribbean Islands and United States Eastern Seaboard, ultimately resulting in the name's retirement. Overall, the season resulted in 114 deaths and $18.5 billion in damage.
Seasonal forecasts
| Source | Date | Named storms |
Hurricanes | Major hurricanes |
Ref |
| Average (1981–2010) | 12.1 | 6.4 | 2.7 | [1] | |
| Record high activity | 28 | 15 | 8 | [2] | |
| Record low activity | 4 | 2 | 0† | [2] | |
| ––––––––––––––––––––––––––––––––––––––––––––––––––––––– | |||||
| TSR | December 6, 2010 | 16 | 8 | 4 | [3] |
| CSU | December 8, 2010 | 17 | 9 | 5 | [4] |
| TSR | April 4, 2011 | 14 | 8 | 4 | [5] |
| CSU | April 6, 2011 | 16 | 9 | 5 | [6] |
| NOAA | May 19, 2011 | 12–18 | 6–10 | 3–6 | [7] |
| TSR | May 24, 2011 | 14 | 8 | 4 | [8] |
| UKMO | May 26, 2011 | 13 | N/A | N/A | [9] |
| CSU | June 1, 2011 | 16 | 9 | 5 | [10] |
| FSU COAPS | June 1, 2011 | 17 | 9 | N/A | [11] |
| TSR | June 6, 2011 | 14 | 8 | 4 | [12] |
| TSR | July 4, 2011 | 14 | 8 | 4 | [13] |
| WSI | July 26, 2011 | 15 | 8 | 4 | [14] |
| CSU | August 3, 2011 | 16 | 9 | 5 | [15] |
| TSR | August 4, 2011 | 16 | 9 | 4 | [16] |
| NOAA | August 4, 2011 | 14–19 | 7–10 | 3–5 | [17] |
| WSI | September 21, 2011 | 21 | 7 | 4 | [18] |
| ––––––––––––––––––––––––––––––––––––––––––––––––––––––– | |||||
| Actual activity |
19 | 7 | 4 | ||
| † Most recent of several such occurrences. (See all) | |||||
In advance of, and during, each hurricane season, several forecasts of hurricane activity are issued by national meteorological services, scientific agencies, and noted hurricane experts. These include forecasters from the United States National Oceanic and Atmospheric Administration (NOAA)'s National Hurricane and Climate Prediction Center's, Philip J. Klotzbach, William M. Gray and their associates at Colorado State University (CSU), Tropical Storm Risk, and the United Kingdom's Met Office. The forecasts include weekly and monthly changes in significant factors that help determine the number of tropical storms, hurricanes, and major hurricanes within a particular year. As stated by NOAA and CSU, an average Atlantic hurricane season between 1981-2010 contains roughly 12 tropical storms, 6 hurricanes, 3 major hurricanes, and an Accumulated Cyclone Energy (ACE) Index of 66-103 units.[1][19] NOAA typically categorizes a season as either above-average, average, of below-average based on the cumulative ACE Index; however, the number of tropical storms, hurricanes, and major hurricanes within a hurricane season is considered occasionally as well.
Pre-season forecasts
On December 6, 2010, Tropical Storm Risk (TSR), a public consortium that comprises experts on insurance, risk management and seasonal climate forecasting at University College London, issued an extended-range forecast for the 2011 Atlantic hurricane season, calling for tropical cyclone activity roughly 40% above the 1950–2010 average. The team called for 15.6 (±4.3) tropical storms, 8.4 (±3.0) hurricanes, and 4.0 (±1.7) major hurricanes, with a cumulative Accumulated Cyclone Energy (ACE) index of 141 (±58).[3] Two days later, Colorado State University issued its first extended-range forecast for the 2011 season. In its report, the organization predicted an above-average hurricane season with 17 named storms, 9 hurricanes, and 5 major hurricanes. In addition, the team expected an Accumulated Cyclone Energy (ACE) value of approximately 165, citing that El Niño conditions were unlikely to develop by the start of the season. The team also predicted that there was a higher chance of a tropical cyclone hitting the United States coastline when compared to 2010.[4] On April 6, 2011, CSU revised their December forecast slightly, predicting 16 named storms, 9 hurricanes, and 5 major hurricanes.[6] In early April, CSU and TSR released yet another updated forecast for the season, lowering the number of predicted cyclones slightly.
On May 19, 2011, NOAA released their first forecast for the 2011 Atlantic hurricane season. The organization expected 12–18 named storms, 6–10 hurricanes, and 3–6 major hurricanes would form in the Atlantic during 2011, citing above-normal sea surface temperatures, a weakening La Niña, and the effect of the warm regime of the Atlantic multidecadal oscillation. NOAA also stated that, when looking at climate models, "activity comparable to some of the active seasons since 1995" could occur.[7] On May 26, the UK Met Office (UKMO) issued a forecast of a slightly above-average season. They predicted 13 tropical storms with a 70% chance that the number would fall between 10 and 17. However, they did not – and do not – issue forecasts on the number of hurricanes and major hurricanes. The team also predicted an ACE Index of 151 with a 70% chance that the index would be in the range 89 to 212.[9]
Mid-season forecasts
On June 1, CSU released their mid-season predictions, with numbers unchanged from those published in April.[10] Concurrently, the Florida State University Center for Ocean-Atmospheric Prediction Studies (FSU COAPS) issued its third annual Atlantic hurricane season forecast, predicting 17 named storms, 9 hurricanes, and an ACE Index of 163. No prediction for the number of major hurricanes was made.[11] A little over a month later, Weather Services International (WSI) issued their first forecast for the season. A total of 15 named storms, 8 hurricanes, and 4 major hurricanes were expected to develop for the entirety of the season. On August 3, CSU issued a mid-season update, though no change in predictions from their April outlook was made. The following day, NOAA issued their mid-season and final forecast for the season, calling for 14-19 named storms, 7-10 hurricanes, and 3-5 major hurricanes. The increase in numbers when compared to the pre-season forecast was due to the near-record start to the season. The final forecast for the 2011 season was issued by WSI on September 21, in which the organization called for 21 named storms, 7 hurricanes, and 4 major hurricanes; the philosophy for the increase in numbers was unchanged from CSU's.
Season activity
In this season, there were 20 tropical cyclones, 19 tropical storms, 7 hurricanes, and 4 major hurricanes. Damage in this season was about $18.6 billion and there was 114 deaths; a majority of it was caused by Hurricane Irene and Tropical Storm Lee.
The season's activity was reflected with an above-average cumulative accumulated cyclone energy (ACE) rating of 125.[20] ACE is, broadly speaking, a measure of the power of the hurricane multiplied by the length of time it existed, so storms that last a long time, as well as particularly strong hurricanes, have high ACEs. ACE is only calculated for full advisories on tropical systems at or exceeding 34 knots (39 mph, 63 km/h) or tropical storm strength. Subtropical cyclones, including the early portions of Sean, are excluded from the total.[21]
Storms
Tropical Storm Arlene
| Tropical storm (SSHWS) | |||
|---|---|---|---|
| |||
| Duration | June 28 – July 1 | ||
| Peak intensity | 65 mph (100 km/h) (1-min) 993 mbar (hPa) | ||

A tropical wave emerged into the eastern Atlantic on June 13. Tracking westward, the disturbance remained disorganized prior to reaching the western Caribbean. Cyclonic rotation became increasingly evident on satellite imagery, though organization was halted by the disturbance's passage over the Yucatán Peninsula on June 26. After emerging into the Bay of Campeche, favorable environmental conditions allowed for the development of Tropical Storm Arlene by 1800 UTC on June 28. Moving generally westward due to the influence of high pressure to the cyclone's north, Arlene gradually intensified, reaching its peak intensity with maximum sustained winds of 65 mph (100 km/h) and a minimum barometric pressure of 993 mb (hPa; 29.32 inHg) at 1200 UTC on June 30; the strong tropical storm moved ashore near Cabo Rojo, Mexico an hour later. Once inland, the center of circulation became increasingly diffuse, and the storm dissipated over the Sierra Madre Mountains early on July 1.[22]
Numerous tropical cyclone watches and warnings were issued for the coastline of Mexico shortly after the formation of Arlene; once inland, all were discontinued.[22] Despite its relatively weak strength, Arlene produced isolated rainfall totals in excess of 9 in (230 mm).[23] High amounts of precipitation led to numerous mudslides and flooding, causing an estimated 2.6 billion pesos (US$207.4 million) in damage.[24] A total of 22 deaths were reported in association with Tropical Storm Arlene.[22] Although the center of circulation remained over Mexico, the storm's far-reaching effects brought minimal relief to drought-stricken portions of southern Texas and Florida.[25]
Tropical Storm Bret
| Tropical storm (SSHWS) | |||
|---|---|---|---|
| |||
| Duration | July 17 – July 23 | ||
| Peak intensity | 70 mph (110 km/h) (1-min) 995 mbar (hPa) | ||
An area of low pressure formed on the southern extent of a stalled cold front just off the East Coast of the United States on July 16. Tracking south-southeast, the low-pressure center was initially baroclinic in nature, but quickly transitioned into a warm-core low over the warm waters of the western Atlantic. Decreasing vertical wind shear allowed for the development of convection – shower and thunderstorm activity – atop the low-level circulation, and Dvorak satellite classifications were initiated early on July 17 given the organization on satellite imagery. Following an aircraft reconnaissance flight into the disturbance that afternoon, the National Hurricane Center (NHC) subsequently declared Tropical Depression Two at 1800 UTC on July 17; the depression intensified into Tropical Storm Bret just six hours later.
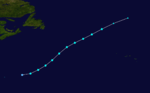
As the system turned northeastward, the formation of an anticyclone atop Bret's center provided favorable conditions for intensification; accordingly, an eyewall and associated eye-like feature were noted on microwave satellite imagery during the afternoon hours of July 18. At 1800 UTC, the system attained its peak intensity with winds of 70 mph (110 km/h) and a minimum barometric pressure of 995 mb (hPa; 29.38 inHg). After moving over increasingly cool sea surface temperatures, the cyclone began to gradually weaken. Bret was downgraded to a tropical depression at 0000 UTC on July 22 and no longer met the criteria of a tropical cyclone by 1200 UTC, while positioned several hundred miles north of Bermuda.[26]
Tropical Storm Cindy
| Tropical storm (SSHWS) | |||
|---|---|---|---|
| |||
| Duration | July 20 – July 23 | ||
| Peak intensity | 70 mph (110 km/h) (1-min) 994 mbar (hPa) | ||
_Jul_21_2011.jpg)
On July 17, an area of showers and thunderstorms, associated with the same frontal system that spawned Tropical Storm Bret, consolidated around a developing area of low pressure about 345 mi (555 km) west-southwest of Bermuda. Tracking east-northeastward, the system gradually organized and became better defined. The disturbance produced moderate rains while passing south of the territory, peaking at 1.16 in (29 mm); gusty winds were also observed. At 0600 UTC on July 20, the low developed into a tropical depression east of Bermuda. Embedded within the mid-latitude westerlies, the depression moved northeast and maintained this general direction for the remainder of its existence.
Six hours after formation, the system strengthened into Tropical Storm Cindy. Convection steadily increased over the storm, and a ragged eye-like feature appeared on both visible and microwave satellite imagery. Corresponding with this, Cindy attained its peak intensity late on July 21, with winds of 70 mph (110 km/h) and a barometric pressure of 994 mbar (hPa; 29.35 inHg). Shortly thereafter, the storm moved over waters cooler than 78.8 °F (26 °C). Throughout July 22, convection diminished and the system transitioned into a post-tropical cyclone about 985 mi (1,585 km) southwest of Ireland. The remnants persisted for another 12 hours before degenerating into a trough over the North Atlantic on July 23.[27]
Tropical Storm Don
| Tropical storm (SSHWS) | |||
|---|---|---|---|
| |||
| Duration | July 27 – July 30 | ||
| Peak intensity | 50 mph (85 km/h) (1-min) 997 mbar (hPa) | ||

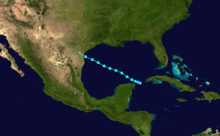
A tropical wave emerged off the western coast of Africa on July 16. Tracking westward, the disturbance produced sporadic convection but remained disorganized through its passage into the Caribbean on July 23. Once there, shower and thunderstorm began to develop within an environment marginally conducive for tropical cyclogenesis. A broad area of low pressure formed and consolidated over the northwestern Caribbean Sea, and the NHC subsequently designated Tropical Depression Four on July 27; the system further intensified into Tropical Storm Don at 1800 UTC. Steered west-northwestward by a subtropical ridge across over the southeastern United States, the cyclone strengthened initially under low wind shear, attaining a peak intensity with maximum sustained winds of 50 mph (85 km/h) and a minimum barometric pressure of 997 mb (hPa; 29.44 inHg). Despite low shear, Don was met with a significantly more stable environment as it emerged into the Gulf of Mexico.
Convection around the center of the storm gradually diminished as a result of a lack of vertical instability, and a decrease in sustained winds was observed accordingly. Don weakened to a tropical depression as it moved ashore in Texas, along the Padre Island National Seashore, and continued west-northwestward thereafter; the system degenerated into a remnant area of low pressure by 0600 UTC on July 30. As a tropical cyclone, Don prompted tropical cyclone advisories for the southern Texas coastline. Due to its abrupt weakening prior to landfall, rainfall totals and wind observations along the warned areas were scarce; a maximum precipitation total of 2.56 in (65 mm) was documented near Bay City, Texas, and a peak wind gust of 41 mph (66 km/h) was recorded at Waldon Field. The storm produced storm surge values lower than 2 ft (0.61 m) as well. Damage, if any, was minimal.[28]
Tropical Storm Emily
| Tropical storm (SSHWS) | |||
|---|---|---|---|
| |||
| Duration | August 2 – August 7 | ||
| Peak intensity | 50 mph (85 km/h) (1-min) 1003 mbar (hPa) | ||


A tropical wave emerged off the western coast of Africa on July 25. Tracking westward, the disturbance gradually consolidated as multiple centers of circulation eventually dissipated and a new one formed. A marginally favorable atmospheric environment allowed for the development of atmospheric convection, and an air force flight into the disturbance led to the classification of Tropical Storm Emily around 0000 UTC on August 2, in the eastern Caribbean Sea. Turning west-northwestward upon reaching the southwest edge of a large subtropical ridge to its northeast, Emily remained relatively disorganized on satellite imagery, marked with an irregular central dense overcast and exposed center, due to strong westerly wind shear. Despite a large burst of showers and thunderstorms south of Hispaniola on August 3, the center of circulation accelerated west-northwestward, with a mid-level center moving inland over the country. At 1800 UTC the following day, Emily degenerated into an open tropical wave, though forecasts from the NHC stated that regeneration was possible in a few days.[29]
While the remnant surface low dissipated, the mid-level remnants of Emily continued northwestward and entered the Bahamas, where a new area of low pressure developed as atmospheric pressures dropped. A subsequent air force flight into the disturbance indicated that it had regenerated into a tropical depression at 1800 UTC on August 6; six hours later, it re-intensified into Tropical Storm Emily. This period of strengthening was short-lived, however, as strong wind shear caused the center of circulation to become exposed once again. At 1200 UTC on August 7, Emily degenerated into a remnant area of low pressure, northeast of the Bahamas. As a disturbance, the storm produced heavy rainfall and landslides in Martinique; one indirect death was recorded here. Upon intensification into a tropical storm, Emily produced heavy rainfall and subsequent flooding across Hispaniola and Puerto Rico, leading to swelled rivers, minor flooding to homes, and landslides.[30]
Tropical Storm Franklin
| Tropical storm (SSHWS) | |||
|---|---|---|---|
| |||
| Duration | August 12 – August 13 | ||
| Peak intensity | 45 mph (75 km/h) (1-min) 1004 mbar (hPa) | ||


During the early afternoon of August 10, a disorganized area of showers and thunderstorms developed off the east coast of Florida, in association with an elongated area of low pressure.[31] Tracking northeastward in response to deep southeasterly flow,[32] the disturbance slowly organized; however, by the morning of August 12, the chances of the system developing into a tropical cyclone remained low.[33] Over the following several hours, marked organization of thunderstorm activity took place around a well-defined low pressure area.[34] Subsequently, the system was classified as Tropical Depression Six that day roughly 260 mi (420 km) north of Bermuda.[35] Although well to the north of Bermuda, the system brought unsettled weather to the archipelago, with rainfall reaching 0.07 in (1.8 mm) at L.F. Wade International Airport.[36]
Maintaining a northeasterly track, the depression intensified into Tropical Storm Franklin early on August 13 following a large burst of convection over its center.[37] Later that morning, Franklin attained its peak winds of 45 mph (75 km/h) before encountering increasing wind shear and decreasing sea surface temperatures.[38] Rapid deterioration of the storm's structure took place as environmental conditions became increasingly hostile for tropical cyclones. Convection was sheared more than 100 mi (155 km) from the center of circulation and Franklin began acquiring characteristics of an extratropical cyclone.[39] Early on August 14, Franklin quickly completed its transition into an extratropical system, prompting the final advisory from the NHC.[40]
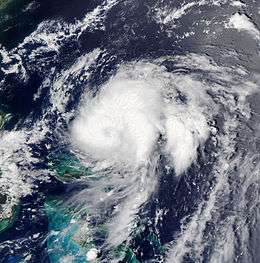
Tropical Storm Gert
| Tropical storm (SSHWS) | |||
|---|---|---|---|
| |||
| Duration | August 13 – August 17 | ||
| Peak intensity | 65 mph (100 km/h) (1-min) 1000 mbar (hPa) | ||


During the second week of August, a weak low-pressure area, located east of Bermuda, became associated with a synoptic-scale trough.[41] Dropping west-southwestward, it interacted with an upper low to produce an area of disorganized convection, and by then the NHC began to monitor the system.[42][43] By August 13, the small low had become very well-defined, with a tight wind circulation center and deep convection; it was designated as a tropical depression at 0300 UTC that day, about 360 mi (580 km) south-southeast of Bermuda.[44] As the depression re-curved west-northwestward along the weakening subtropical ridge, it intensified into Tropical Storm Gert, due to light wind shear and moist air, about 15 hours after its formation.[45] As Gert neared Bermuda, a small 7 to 9 mi (11 to 14 km) eye-like feature became apparent on radar imagery. Coinciding with this, Gert reached its peak intensity with winds of 60 mph (100 km/h).[44] Passing roughly 90 mi (150 km) east of Bermuda, Gert brought light rain and winds up to 25 mph (40 km/h) to the islands.[36] By August 16, convection associated with Gert had mostly dissipated and whether or not the system retained a closed surface low was ambiguous. As a result, Gert degenerated into a post-tropical cyclone over the open Atlantic.[46]
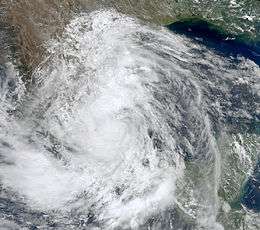
Tropical Storm Harvey
| Tropical storm (SSHWS) | |||
|---|---|---|---|
| |||
| Duration | August 19 – August 22 | ||
| Peak intensity | 65 mph (100 km/h) (1-min) 994 mbar (hPa) | ||


In mid-August, a westward moving tropical wave entered the Caribbean Sea. It eventually gained enough organization to be classified as Tropical Depression Eight on August 18. It was upgraded to Tropical Storm Harvey on August 19. By late August 19 the storm was intensifying rapidly and it was announced that it could become a hurricane just before landfall. However, by Saturday afternoon, August 20, Harvey made landfall, never having reached hurricane strength, resetting the Atlantic record as the first eight named storms of the season did not reach hurricane strength. Harvey was then downgraded into a depression though it briefly regained tropical storm status in the Bay of Campeche. It dissipated on August 22.[47]
Hurricane Irene
| Category 3 hurricane (SSHWS) | |||
|---|---|---|---|
| |||
| Duration | August 21 – August 28 | ||
| Peak intensity | 120 mph (195 km/h) (1-min) 942 mbar (hPa) | ||
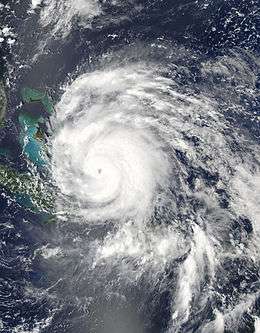
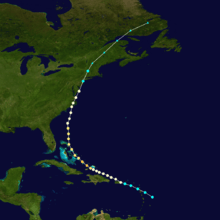
In the evening of August 20, a large low pressure area became organized enough to be classified as Tropical Storm Irene. It passed over the Leeward Islands early on August 21. Early on August 22, Irene strengthened into a Category 1 hurricane, with winds of 75 mph (120 km/h) and a central pressure of 987 mbar (29.1 inHg), becoming the first hurricane of the season. This broke a streak of eight consecutive tropical cyclones to start the 2011 season, all of which did not strengthen beyond tropical storm force. Early on August 24, Irene became a Category 3 major hurricane, with winds of 120 mph (150 km/h). Irene went through a partial eyewall replacement cycle which weakened it slightly, but caused its wind field to greatly expand. On August 26, New York mayor Michael Bloomberg told coastal residents to 'get moving, now.'[48] The next day, Irene made landfall on Cape Lookout, North Carolina as a category 1 hurricane with 85 mph winds with an unusually low pressure for a category 1 hurricane. After weakening to a tropical storm, Irene made a second U.S. landfall at Brigantine Island in New Jersey at 5:35 a.m. On August 28, still a strong tropical storm, Irene made its third U.S. landfall in the Coney Island area of Brooklyn, New York, at approximately 9:00 a.m. on August 28. Irene became a post-tropical storm over Quebec and Atlantic Canada late on August 28.[49]
Forming on August 20, Irene was the second earliest ninth Atlantic tropical cyclone on record, along with an unnamed tropical storm from the 1936 season. A total of 56 people were confirmed dead across the Caribbean, 10 U.S. states and Canada in the aftermath[50] and damage from Hurricane Irene totaled $19 billion (2011 USD), making it the fifth costliest hurricane in the Atlantic basin.[51]
Tropical Depression Ten
| Tropical depression (SSHWS) | |||
|---|---|---|---|
| |||
| Duration | August 25 – August 26 | ||
| Peak intensity | 35 mph (55 km/h) (1-min) 1006 mbar (hPa) | ||

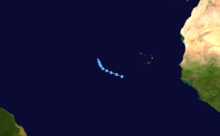
A well-organized tropical wave moved into the eastern Atlantic on August 22. Tracking westward at a fast pace, the wave gradually developed shower and thunderstorm activity and developed a closed center of low pressure. Curved bands extended from the center by 0000 UTC on August 25, indicating the development of a tropical depression; at this time, the system was centered about 403 mi (649 km) west-southwest of the southernmost Cape Verde Islands. Operationally, the depression was expected to intensify into a mid-grade tropical storm within 48 hours. However, unfavorable northeasterly shear prevented any intensification, and the depression's peak intensity of 35 mph (55 km/h) and 1006 mb (hPa; 29.71 inHg) was observed at the time of formation. As a mid-level ridge to the north of the cyclone weakened, it turned west-northwest while gradually weakening; by the evening hours of August 26, little convection existed over the center of circulation. At 0000 UTC on August 27, Tropical Depression Ten degenerated into a post-tropical remnant area of low pressure and dissipated a few hours later after the center deteriorated into a trough.[52]
Tropical Storm Jose
| Tropical storm (SSHWS) | |||
|---|---|---|---|
| |||
| Duration | August 27 – August 29 | ||
| Peak intensity | 45 mph (75 km/h) (1-min) 1006 mbar (hPa) | ||


A mesoscale convective system developed north of an upper-level low east-southeast of Bermuda on August 25. A small mid-level area of low pressure formed on the western side of the convective complex later that same day, gradually developing into the lower levels of the atmosphere. As convection near the center of circulation increased in coverage and intensity, the system developed into a tropical depression at 0600 UTC on August 26. Six hours later, the depression intensified into Tropical Storm Jose. After formation, strong wind shear from nearby Hurricane Irene slowed, and eventually halted, development trends. Jose attained its peak intensity with winds of 45 mph (75 km/h) and a minimum barometric pressure of 1006 mbar (hPa; 29.71 inHg) but slowly weakened thereafter. Accelerating to the north and northeast, shower and thunderstorm activity gradually diminished, the low-level circulation became exposed, and the NHC determined Jose degenerated into a remnant area of low pressure near 0000 UTC on August 29, roughly 120 nmi (220 km) north-northwest of Bermuda. As a tropical cyclone, Jose produced tropical storm-force wind gusts on the island and several nearby buoys.[53]
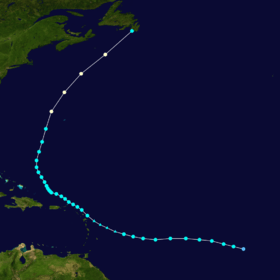
Hurricane Katia
| Category 4 hurricane (SSHWS) | |||
|---|---|---|---|
| |||
| Duration | August 29 – September 13 | ||
| Peak intensity | 140 mph (220 km/h) (1-min) 942 mbar (hPa) | ||


The eleventh named storm of the season formed south of the Cape Verde Islands on August 29. The system became a tropical storm on August 30, at which time it was named Katia. It became the season's second hurricane early on September 1; however, its strength fluctuated until September 4 when it reached category 2 hurricane strength. On September 5 the system reached Category 3 (major hurricane status). Katia further strengthened into a Category 4 hurricane on September 5. It was downgraded to a category 1 storm by the end of the following day, and remained at that strength even as it became extra-tropical. The storm was of potential concern and was being monitored closely as it may have indirectly impacted the east coast of North America. Warnings of severe weather were made for Northern Ireland and Scotland for the remnants of Katia.[54] Its remnants struck Great Britain and Ireland on September 11 and 12, killing one. Its remnants caused blackouts as far east as Saint Petersburg. At 0000 UTC on September 13, Katia's remnant merged with a larger extratropical system, over the North Sea.
Unnamed Tropical Storm
| Tropical storm (SSHWS) | |||
|---|---|---|---|
| |||
| Duration | September 1 – September 3 | ||
| Peak intensity | 45 mph (75 km/h) (1-min) 1002 mbar (hPa) | ||


As part of their routine post-season analysis, the National Hurricane Center identified an unnamed tropical storm. A trough south of Tropical Storm Jose developed an area of convection southwest of Bermuda on August 28, and a circulation formed within the system a day later. The system moved to the north-northeast, organizing into a distinct low pressure area on August 31. At around 0000 UTC on September 1, a tropical depression formed about 335 mi (535 km) north of Bermuda. It initially drifted erratically northeastward due to its position within a stationary front. Despite moderate southwesterly wind shear, the depression intensified into a tropical storm about 12 hours after becoming a tropical depression, based on an increase of convection over the center. At that time, the storm attained peak winds of 45 mph (75 km/h). The thunderstorms continued to pulsate, resulting in the winds fluctuating slightly. On September 2, an approaching trough caused the storm to accelerate northeastward. Cooler waters and increased wind shear stripped away the convection, resulting in the storm becoming extratropical early on September 3. The remnants continued northeastward, with the circulation dissipating by 0000 UTC on September 4.[55]
The system was not considered a tropical cyclone while it was active, partially due to the intermittent nature of the convection and uncertainty whether it was associated with a cold front. The NHC prepared issuing advisories on several occasions,[55] and a tropical weather outlook on September 2 noted that "only a slight increase in organization [would] result in the formation of a tropical storm."[56]
Tropical Storm Lee
| Tropical storm (SSHWS) | |||
|---|---|---|---|
| |||
| Duration | September 1 – September 6 | ||
| Peak intensity | 60 mph (95 km/h) (1-min) 986 mbar (hPa) | ||


In late August, a tropical wave producing scattered showers and thunderstorms entered the Western Caribbean.[57] Moving generally west-northwestward, the wave began to organize in the southeastern portion of the Gulf of Mexico. During the afternoon hours of September 1, the hurricane hunters went out to investigate the well-defined wave, and found a closed low-level circulation. Thus, advisories were initiated on Tropical Depression Thirteen.[58] Moving northwest, the tropical depression was upgraded to a tropical storm, given the name "Lee" on September 2.[59] Continuing to organize, Lee reached a peak intensity of 60 mph (95 km/h) early on September 3, while located just south of Louisiana. At 4 a.m. CDT September 4, Lee made landfall roughly 50 miles (80 km) to the southwest of Lafayette, Louisiana with maximum sustained winds of 45 mph (75 km/h).[60] Further weakening occurred as Lee moved across Louisiana, and Lee was downgraded to a tropical depression on September 5 after causing flash floods in Louisiana and Mississippi and whipping wildfires in Texas.[61]
The last NHC advisory on Lee was issued early on September 5, while its remnants proceeded to wreak havoc (mainly flooding) over the following two to three days northward into Pennsylvania, New York State and Canada (Quebec and Ontario).[62]
Hurricane Maria
| Category 1 hurricane (SSHWS) | |||
|---|---|---|---|
| |||
| Duration | September 5 – September 16 | ||
| Peak intensity | 80 mph (130 km/h) (1-min) 983 mbar (hPa) | ||
On September 5, a low pressure area associated with a tropical wave to the west of Africa quickly organized.[63] It was designated Tropical Depression Fourteen on the evening of September 6.[64] On the morning of September 7, it was upgraded to Tropical Storm Maria.[65] Over the tropical Atlantic, high wind shear hindered its development, and Maria dissipated, before convection began to rebuild by September 9. The following day, it began to encounter more favorable conditions, and the tropical cyclone intensified into a Category 1 hurricane on September 15. On the afternoon of September 16, the storm lost tropical characteristics off the northeast coast of Newfoundland. Landfall was reported on the southern tip of the Avalon Peninsula with winds recorded at 64 mph (103 km/h). The capital city of St. John's experienced heavy rain and gale-force winds, but not as severe as anticipated.[66]
Hurricane Nate
| Category 1 hurricane (SSHWS) | |||
|---|---|---|---|
| |||
| Duration | September 6 – September 11 | ||
| Peak intensity | 75 mph (120 km/h) (1-min) 994 mbar (hPa) | ||


During the morning hours of September 6, shower and thunderstorm activity associated with a low pressure system began to gather organization in the Bay of Campeche.[67] The following day, the system gained enough organization to be classified as a tropical storm, earning the name Nate.[68] Moving in an erratic motion at a very slow pace, Nate began to strengthen. During the afternoon hours of September 8, Nate reached its peak intensity of 75 mph (120 km/h), while moving off towards the Mexican coastline. The storm was originally thought to remain a tropical storm, but post-season analysis revealed that Nate was a hurricane for twelve hours based on data from PEMEX oil rigs not available operationally.[69] Due to the storm's slow movement, Nate began to upwell cooler waters in its wake, resulting in weakening. Additionally, very dry air began getting entrained into the system. On September 11, Nate made landfall on the Mexican coastline as a weak tropical storm, with maximum sustained winds of 45 mph (75 km/h).[70] Shortly after making landfall, much of Nate's showers and thunderstorms dissipated, and thus rainfall totals were minimal.[69]
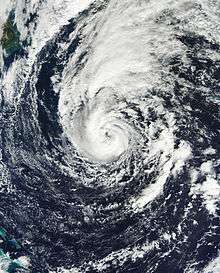
Hurricane Ophelia
| Category 4 hurricane (SSHWS) | |||
|---|---|---|---|
| |||
| Duration | September 19 – October 4 | ||
| Peak intensity | 140 mph (220 km/h) (1-min) 940 mbar (hPa) | ||
.jpg)
In mid-September, a well-defined tropical wave emerged off the African coastline. Moving westward, the disturbance began to gather organization, and become very well defined on September 20. Subsequently, the National Hurricane Center started issuing advisories on Tropical Storm Ophelia. Almost as soon as it became a tropical storm, vertical wind shear began impacting the system. Ophelia slowly strengthened despite the unfavorable conditions and attained winds of 65 mph (100 km/h) on September 22. The system briefly weakened to a minimal tropical storm before strengthening again. However, because of the extremely strong wind shear, Ophelia was ripped apart and dissipated into a post-tropical remnant low on September 25.
Wind shear remained strong, but not as strong as before. Thus, during the afternoon hours of September 27, Ophelia was able to develop convection near its center, and was designated a tropical depression. Ophelia gradually strengthened further into a tropical storm as it passed to the north of the Caribbean. In Dominica, heavy rains from the storm caused widespread flooding. During the afternoon hours of September 29, despite the relatively unfavorable environment, Ophelia strengthened into a Category 1 hurricane. As wind shear relaxed, early on September 30, Ophelia rapidly intensified and became a Category 2 hurricane. Later that day, Ophelia further strengthened into a Category 3 hurricane, becoming the third major hurricane of the season. The eye of Ophelia passed directly over a NOAA buoy early on October 1, which reported sustained winds of 96 mph (155 km/h) and a pressure of 952 mbar (28.11 inHg). The intensification trend continued, and Ophelia strengthened further to a Category 4 hurricane late that day east of Bermuda. Through the following day (Sunday), increasing southwesterly wind shear and cooler water temperatures combined to cause Ophelia to progressively weaken back into a Category 1 hurricane by the evening and weakened to a tropical storm during the morning hours of October 3. Several hours later, Ophelia was declared as a post-tropical cyclone soon after making landfall on the Avalon Peninsula in Newfoundland.
Hurricane Philippe
| Category 1 hurricane (SSHWS) | |||
|---|---|---|---|
| |||
| Duration | September 24 – October 9 | ||
| Peak intensity | 90 mph (150 km/h) (1-min) 976 mbar (hPa) | ||
On September 23, a well-defined tropical wave emerged off the coast of Africa, associated with plentiful shower and thunderstorm activity.[71] Moving westward and embedded within a favorable environment for development, the wave quickly became organized. During the morning hours of September 24, the National Hurricane Center designated the low as a tropical depression, while located about 290 mi (465 km) south of the southernmost Cape Verde Islands.[72] Later that day, the depression was upgraded to a tropical storm, designated "Philippe". Since that time strong shear from both upper level winds and later on from Ophelia's outflow, as well as periodic entrainment of dry air kept the cyclone both small and disorganized, with the center often exposed to the point where the low level circulation reformed under the convection that defines a tropical system at least once. An exposed cyclone can be seen as a wispy series of clouds circling a small area, rather than under the canopy of thunderstorms. Because of this hostile environment, Philippe remained near the minimum for a tropical storm briefly weakening to a tropical depression at one point. On the afternoon of October 2, an Advanced Scatterometer (ASCAT) pass confirmed that Philippe was a strong tropical storm, contrary to satellite estimates. Despite high wind shear, it remained a strong tropical storm and briefly strengthened to a hurricane when it developed an eye feature. On October 6, Philippe became a strong Category 1 hurricane. On October 8, Philippe weakened to a tropical storm, then became post-tropical later that day.
Hurricane Rina
| Category 3 hurricane (SSHWS) | |||
|---|---|---|---|
| |||
| Duration | October 23 – October 28 | ||
| Peak intensity | 115 mph (185 km/h) (1-min) 966 mbar (hPa) | ||
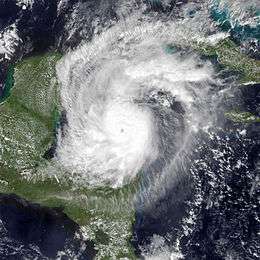

In mid-October, the southern extension of a cold front moved into the western Caribbean. The front, in conjunction with east-southeasterly trade winds, produced a broad area of cyclonic circulation over the southwestern Caribbean.[73] Moving slowly towards the north and northwest, barometric pressures in the area began falling, and the disturbance was expected to move into an environment more conducive for development. Thus, the National Hurricane Center gave the disturbance a medium chance, 30%, of developing into a tropical cyclone within 48 hours.[74] Further organization occurred during the afternoon hours of October 21, as the low pressure area became more consolidated.[75] However, the following day, the disturbance became slightly less organized, depicted by a decrease in tropical cyclone formation probabilities.[76]
On October 23, a reconnaissance aircraft flew into the disturbance, finding a well-defined center of circulation. This, combined with satellite imagery, led to the formation of Tropical Depression Eighteen during the evening hours of that day; it strengthened to a tropical storm just several hours later, and earned the name "Rina".[77] Moving towards the north-northwest, Rina rapidly intensified on October 24, becoming a hurricane just 21 hours after formation. Further strengthening commenced for the remaining of the day, although Rina did not reach peak intensity until the evening hours of October 25, briefly becoming a major hurricane. Shortly thereafter, the increase of wind shear and dry air led to weakening the following day, and Rina weakened to a tropical storm early on October 27. Scraping the Yucatán Peninsula, Rina brought heavy rainfall and gusty winds before turning towards the north. Early the next day, Rina weakened into a tropical depression, and during the afternoon hours, further dissipated into a remnant low.
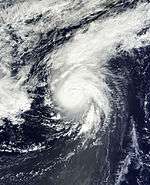
Tropical Storm Sean
| Tropical storm (SSHWS) | |||
|---|---|---|---|
| |||
| Duration | November 6 – November 11 | ||
| Peak intensity | 65 mph (100 km/h) (1-min) 982 mbar (hPa) | ||

On November 3, an extratropical cyclone formed over the Central United States along a cold front, which moved into the Atlantic Ocean during the following day. On November 6, the system became nearly stationary between Bermuda and the Bahamas after separating from the front. The circulation became better-defined while convection increased.[78] By November 8, the system had developed gale-force winds near the center,[79] and at 0600 UTC that day, the NHC classified it as Subtropical Storm Sean. While convection and the wind field had become more symmetric,[78] the system remained a subtropical storm due to the associated upper-level low.[80] Within 12 hours, Sean separated from the low and transitioned into a tropical cyclone,[78] after developing a warm core.[81] It developed outflow and intensified due to light wind shear, combined with sufficiently warm water temperaturess of at least 26 °C (79 °F). With a ridge to the northeast, the storm moved slowly to the west.[78] On November 9, an eye feature developed in association with Sean,[82] which later morphed into a ring of convection.[78] The NHC predicted Sean would intensify into a hurricane,[83] although the storm reached peak winds of 65 mph (105 km/h) on November 10 as reported by the Hurricane Hunters.[78] An approaching cold front subsequently induced higher wind shear on the cyclone as it tracked northeastward into cooler waters; this led to weakening. After passing roughly 85 mi (137 km) west-northwest of Bermuda, Sean transitioned into an extratropical cyclone on November 11. Early on the next day, it was absorbed by the cold front.[78]
Sean and its precursor produced light rainfall for several days in Bermuda.[84] Shortly after development, the Bermuda Weather Service issued a tropical storm watch, which was later upgraded to a tropical storm warning. When Sean passed near the island on November 11, it produced sustained winds of 43 mph (69 km/h), with gusts to 62 mph (100 km/h).[78] The storm produced rough seas to the east coast of Florida, which drowned one swimmer in Jensen Beach.[85] Rip currents were also observed in North Carolina, though no fatalities occurred.[86]
Storm names
The following names were used for named storms in the North Atlantic in 2011. Names that were not used are marked in gray. This is the same list used in the 2005 season with the exception of Don, Katia, Rina, Sean, and Whitney, which replaced Dennis, Katrina, Rita, Stan, and Wilma, respectively. The names Don, Katia, Rina, and Sean were used for the first time in the Atlantic Basin.[87] The names not retired from this list will be used again in the 2017 season.
Retirement
On April 13, 2012, at the 34th Session of the World Meteorological Organization's Regional Association Hurricane Committee, the WMO retired the name Irene from its rotating name lists. It was replaced with Irma for the 2017 Atlantic hurricane season.[88]
Season effects
This is a table of all of the storms that have formed in the 2011 Atlantic hurricane season. It includes their duration, names, landfall(s) –denoted by bold location names – damages, and death totals. Deaths in parentheses are additional and indirect (an example of an indirect death would be a traffic accident), but were still related to that storm. Damage and deaths include totals while the storm was extratropical, a wave, or a low, and all of the damage figures are in 2011 USD.
| Saffir–Simpson hurricane wind scale | ||||||
| TD | TS | C1 | C2 | C3 | C4 | C5 |
| Storm name |
Dates active | Storm category
at peak intensity |
Max 1-min wind mph (km/h) |
Min. press. (mbar) |
Areas affected | Damage (millions USD) |
Deaths | |||
|---|---|---|---|---|---|---|---|---|---|---|
| Arlene | June 28 – July 1 | Tropical storm | 65 (100) | 993 | Central America, Mexico (Veracruz), Texas, Florida | 223.4 | 18 (4) | |||
| Bret | July 17–22 | Tropical storm | 70 (110) | 995 | Bahamas, Bermuda, East Coast of the United States | None | 0 | |||
| Cindy | July 20–22 | Tropical storm | 70 (110) | 994 | Bermuda | None | 0 | |||
| Don | July 27–30 | Tropical storm | 50 (85) | 997 | Cuba, Yucatán Peninsula, Northeastern Mexico, Texas | None | 0 | |||
| Emily | August 2–7 | Tropical storm | 50 (85) | 1003 | Antilles, Florida, Bahamas | >5 | 4 (1) | |||
| Franklin | August 12–13 | Tropical storm | 45 (75) | 1004 | Bermuda | None | 0 | |||
| Gert | August 13–16 | Tropical storm | 65 (100) | 1000 | Bermuda | None | 0 | |||
| Harvey | August 19–22 | Tropical storm | 65 (100) | 994 | Lesser Antilles, Hispaniola, Central America (Belize), Mexico (Veracruz) | Minimal | 3 | |||
| Irene | August 21–28 | Category 3 hurricane | 120 (195) | 942 | Antilles (US Virgin Islands, Puerto Rico), Lucayan Archipelago (Bahamas), Eastern United States (North Carolina, New Jersey, New York), Eastern Canada | 16,600 | 49 (7) | |||
| Ten | August 25–26 | Tropical depression | 35 (55) | 1006 | None | None | 0 | |||
| Jose | August 27–28 | Tropical storm | 45 (75) | 1006 | Bermuda | None | 0 | |||
| Katia | August 29 – September 10 | Category 4 hurricane | 140 (220) | 942 | Lesser Antilles, East Coast of the United States, Canada, Europe | ~157 | 4 | |||
| Unnamed | August 31 – September 3 | Tropical storm | 45 (75) | 1002 | None | None | 0 | |||
| Lee | September 1–5 | Tropical storm | 60 (95) | 986 | Gulf Coast of the United States (Louisiana), Eastern United States | ≥1,600 | 18 | |||
| Maria | September 6–16 | Category 1 hurricane | 80 (130) | 983 | Lesser Antilles, Bermuda, Newfoundland, Europe | Minimal | 0 | |||
| Nate | September 7–11 | Category 1 hurricane | 75 (120) | 994 | Mexico (Veracruz) | Minimal | 4 (1) | |||
| Ophelia | September 20 – October 3 | Category 4 hurricane | 140 (220) | 940 | Leeward Islands, Bermuda, Newfoundland, Europe | Minimal | 0 | |||
| Philippe | September 24 – October 8 | Category 1 hurricane | 90 (150) | 976 | None | None | 0 | |||
| Rina | October 23–28 | Category 3 hurricane | 115 (185) | 966 | Central America, Yucatán Peninsula (Quintana Roo), Cuba, Florida | Minimal | 0 | |||
| Sean | November 8–11 | Tropical storm | 65 (100) | 982 | Bermuda | Minimal | (1) | |||
| Season Aggregates | ||||||||||
| 20 cyclones | June 29 – November 12 | 140 (220) | 940 | >18,585.4 | 100 (14) | |||||
Accumulated Cyclone Energy (ACE)
| ACE (104kt²) (Source) — Storm: | |||||
|---|---|---|---|---|---|
| 1 | 27.0 | Katia | 11 | 2.22 | Emily |
| 2 | 18.8 | Irene | 12 | 1.88 | Arlene |
| 3 | 18.7 | Ophelia | 13 | 1.85 | Gert |
| 4 | 15.9 | Philippe | 14 | 1.79 | Lee |
| 5 | 10.1 | Rina | 15 | 1.62 | Don |
| 6 | 9.17 | Maria | 16 | 1.53 | Harvey |
| 7 | 4.31 | Nate | 17 | 0.848 | Unnamed |
| 8 | 3.75 | Sean | 0.848 | Jose | |
| 9 | 3.28 | Bret | 19 | 0.283 | Franklin |
| 10 | 2.31 | Cindy | |||
| Total: 126 | |||||
The table on the right shows the ACE for each storm in the season. Broadly speaking, the ACE is a measure of the power of a hurricane multiplied by the length of time it existed, so storms that last a long time, as well as particularly strong hurricanes, have high ACEs. ACE is calculated for only full advisories on specifically tropical systems reaching or exceeding wind speeds of 34 knots (39 mph, 63 km/h), or tropical storm strength. Accordingly, tropical depressions are not included here. Later the NHC reexamines the data, and produces a final report on each storm, which can lead to the ACE for a storm being revised either upward or downward. Until the final reports are issued, ACEs are, therefore, provisional.
See also
- List of Atlantic hurricanes
- List of Atlantic hurricane seasons
- 2011 Pacific hurricane season
- 2011 Pacific typhoon season
- 2011 North Indian Ocean cyclone season
- South-West Indian Ocean cyclone seasons: 2010–11, 2011–12
- Australian region cyclone seasons: 2010–11, 2011–12
- South Pacific cyclone seasons: 2010–11, 2011–12
- South Atlantic tropical cyclone
References
- 1 2 Climate Prediction Center (August 9, 2012). "Background Information: The North Atlantic Hurricane Season". United States National Oceanic and Atmospheric Administration. Retrieved April 11, 2013.
- 1 2 National Hurricane Center; Hurricane Research Division (July 6, 2016). "Atlantic hurricane best track (HURDAT version 2)". United States National Oceanic and Atmospheric Administration. Retrieved December 5, 2016.
- 1 2 Mark Saunders; Adam Lea (December 6, 2010). "Extended Range Forecast for Atlantic Hurricane Activity in 2011" (PDF). Tropical Storm Risk. Retrieved April 25, 2013.
- 1 2 Philip J. Klotzbach; William M. Gray (December 8, 2010). "Extended Range Forecast of Atlantic Seasonal Hurricane Activity and Landfall Strike Probability for 2011" (PDF). Colorado State University. Archived (PDF) from the original on March 31, 2011. Retrieved April 25, 2013.
- ↑ Mark Saunders/Adam Lea (April 4, 2011). "April Forecast Update for Atlantic Hurricane Activity in 2011" (PDF). Tropical Storm Risk. Retrieved April 21, 2011.
- 1 2 William M. Gray; Philip J. Klotzbach (April 6, 2011). "Extended Range Forecast of Atlantic Seasonal Hurricane Activity and Landfall Strike Probability for 2011" (PDF). Colorado State University. Retrieved April 25, 2013.
- 1 2 Climate Prediction Center (May 19, 2011). "NOAA hurricane outlook indicates an above-normal Atlantic season". National Oceanic and Atmospheric Administration. Archived from the original on May 21, 2011. Retrieved April 25, 2013.
- ↑ Mark Saunders/Adam Lea (May 24, 2011). "Pre-Season Forecast for Atlantic Hurricane Activity in 2011" (PDF). Tropical Storm Risk. Retrieved May 26, 2011.
- 1 2 "UK Met Office 2011 Atlantic tropical storm season forecast". May 26, 2011. Retrieved April 25, 2013.
- 1 2 Philip J. Klotzbach; William M. Gray (June 1, 2011). "Extended Range Forecast of Atlantic Seasonal Hurricane Activity and Landfall Strike Probability for 2011" (PDF). Colorado State University. Retrieved June 1, 2011.
- 1 2 Center for Ocean-Atmospheric Prediction Studies. "2011 FSU COAPS Atlantic Hurricane Season Forecast". Florida State University. Archived from the original on June 19, 2011. Retrieved June 16, 2011.
- ↑ Mark Saunders/Adam Lea (June 6, 2011). "June Forecast Update for Atlantic Hurricane Activity in 2011" (PDF). Tropical Storm Risk. Retrieved June 6, 2011.
- ↑ Mark Saunders/Adam Lea (July 4, 2011). "July Forecast Update for Atlantic Hurricane Activity in 2011" (PDF). Tropical Storm Risk. Retrieved July 4, 2011.
- ↑ Johnathan Erdman. "WSI: Active Hurricane Season Ahead". WSI. The Weather Channel. Archived from the original on July 27, 2011. Retrieved April 25, 2013.
- ↑ William M. Gray; Philip J. Klotzbach (August 3, 2011). "Forecast of Atlantic seasonal hurricane activity and hurricane landfall strike probability for 2011" (PDF). Colorado State University. Retrieved April 25, 2013.
- ↑ Mark Saunders/Adam Lea (August 4, 2011). "August Forecast Update for Atlantic Hurricane Activity in 2011" (PDF). Tropical Storm Risk. Retrieved August 4, 2011.
- ↑ "NOAA's Atlantic hurricane season update calls for increase in named storms". National Oceanic and Atmospheric Administration. Retrieved April 25, 2013.
- ↑ Barbara Rudolph (September 21, 2011). "Weather Authority Cites "Near Record Pace" of First Half of Season". Weather Services International. Retrieved April 25, 2013.
- ↑ Philip J. Klotzbach; William M. Gray (December 10, 2008). "Extended Range Forecast of Atlantic Seasonal Hurricane Activity and U.S. Landfall Strike Probability for 2009" (PDF). Colorado State University. Archived (PDF) from the original on June 12, 2009. Retrieved January 1, 2009.
- ↑ Hurricane Research Division (March 2011). "Atlantic basin Comparison of Original and Revised HURDAT". National Oceanic and Atmospheric Administration. Archived from the original on November 29, 2011. Retrieved 2011-07-23.
- ↑ David Levinson (2008-08-20). "2005 Atlantic Ocean Tropical Cyclones". National Climatic Data Center. Retrieved 2011-12-08.
- 1 2 3 John L. Beven II (August 8, 2012). Tropical Cyclone Report: Tropical Storm Arlene (PDF) (Report). National Hurricane Center. pp. 1–2, 4. Retrieved April 30, 2013.
- ↑ Gaspar Romero (June 28, 2011). "Lluvias en Chiapas dejan derrumbes en carreteras y viviendas dañadas" (in Spanish). Excelsior. Retrieved April 30, 2013.
- ↑ Daniel Pérez González (August 5, 2011). "Para reparar daños por Arlene se requieren de 2 mil 360 millones de pesos del Fonden" (in Spanish). El Visto Bueno. Retrieved August 14, 2011.
- ↑ Curtis Morgan (June 29, 2012). "Tropical Storm Arlene brings much-needed rain to South Florida". The McClatchy Company. Retrieved April 30, 2013.
- ↑ Stacy R. Stewart (December 5, 2011). Tropical Storm Bret Tropical Cyclone Report (PDF) (Report). National Hurricane Center. Retrieved April 30, 2013.
- ↑ Daniel P. Brown (September 16, 2011). "Tropical Cyclone Report: Tropical Storm Cindy" (PDF). National Hurricane Center. National Oceanic and Atmospheric Administration. Retrieved September 20, 2011.
- ↑ Michael J. Brennan (October 28, 2011). Tropical Cyclone Report: Tropical Storm Don (PDF) (Report). National Hurricane Center. pp. 1–2, 4. Retrieved May 12, 2013.
- ↑ Stacy R. Stewart (August 4, 2011). "Tropical Weather Outlook" (TXT). 2011 Atlantic Tropical Weather Outlook Archive. National Hurricane Center. Retrieved May 12, 2013.
- ↑ Todd B. Kimberlain; John P. Cangialosi (January 13, 2012). Tropical Cyclone Report: Tropical Storm Emily (AL052011), 2-7 August 2011 (PDF) (Report). National Hurricane Center. pp. 1–2, 5. Retrieved February 16, 2015.
- ↑ Michael Brennan (August 10, 2011). "Atlantic Tropical Weather Outlook". National Hurricane Center. National Oceanic and Atmospheric Administration. Retrieved August 17, 2011.
- ↑ John Cangialosi and Stacy Stewart (August 12, 2011). "Tropical Depression Six Discussion One". National Hurricane Center. National Oceanic and Atmospheric Administration. Retrieved August 17, 2011.
- ↑ Jack Beven (August 12, 2011). "Tropical Weather Outlook". National Hurricane Center. National Oceanic and Atmospheric Administration. Archived from the original on August 12, 2011. Retrieved August 17, 2011.
- ↑ Stacy Stewart (August 12, 2011). "Tropical Weather Outlook". National Hurricane Center. National Oceanic and Atmospheric Administration. Archived from the original on August 12, 2011. Retrieved August 17, 2011.
- ↑ John Cangialosi and Stacy Stewart (August 12, 2011). "Tropical Depression Six Public Advisory One". National Hurricane Center. National Oceanic and Atmospheric Administration. Retrieved August 17, 2011.
- 1 2 "Bermuda Monthly Weather Summer (August 1–16, 2011)". Bermuda Weather Service. August 17, 2011. Archived from the original on August 17, 2011. Retrieved August 17, 2011.
- ↑ Eric Blake (August 13, 2011). "Tropical Storm Franklin Discussion Three". National Hurricane Center. National Oceanic and Atmospheric Administration. Retrieved August 17, 2011.
- ↑ Stacy Stewart (August 13, 2011). "Tropical Storm Franklin Discussion Four". National Hurricane Center. National Oceanic and Atmospheric Administration. Retrieved August 17, 2011.
- ↑ Stacy Stewart (August 13, 2011). "Tropical Storm Franklin Discussion Five". National Hurricane Center. National Oceanic and Atmospheric Administration. Retrieved August 17, 2011.
- ↑ Jack Beven (August 14, 2011). "Post-Tropical Cyclone Franklin Discussion Six". National Hurricane Center. National Oceanic and Atmospheric Administration. Retrieved August 17, 2011.
- ↑ Huffman, Marshall (2011-08-10). "Tropical Weather Discussion". National Hurricane Center. Retrieved 2011-08-14.
- ↑ Wallace, Patricia (2011-08-12). "Tropical Weather Discussion". National Hurricane Center. Retrieved 2011-08-14.
- ↑ Stewart, Stacy (2011-08-12). "Graphical Tropical Weather Outlook". National Hurricane Center. Retrieved 2011-08-14.
- 1 2 Berg, Robbie (October 26, 2011). "Tropical Cyclone Report" (PDF). National Hurricane Center. Retrieved October 27, 2011.
- ↑ Stewart, Stacy (2011-08-14). "Tropical Storm Gert Discussion Number Four". National Hurricane Center. Retrieved 2011-08-14.
- ↑ Jack Beven (August 16, 2011). "Post-Tropical Cyclone Gert Discussion Twelve (Final)". National Hurricane Center. National Oceanic and Atmospheric Administration. Retrieved August 17, 2011.
- ↑ Kimberlain, Wroe (2011-08-22). "Tropical Depression Harvey Discussion Fifteen". National Hurricane Center. Retrieved 2011-08-22.
- ↑ "N.Y. mayor orders evacuations ahead of Hurricane Irene — latimes.com". Los Angeles Times. Retrieved August 26, 2011.
- ↑ Canadian Broadcasting Corporation (2011-08-29). "Post-tropical Irene soaks Quebec, Maritimes". CBC. Associated Press. Retrieved 2011-08-29.
- ↑ "Irene leaves Vt. facing 'flooding catastrophe'". weather on msnbc. Retrieved 2011-08-29.
- ↑ Lixion A. Avila and John Cangialosi (2011-12-14). "Hurricane Irene Tropical Cyclone Report" (PDF). National Hurricane Center. Retrieved 2012-02-18.
- ↑ Richard Pasch (January 4, 2012). "Tropical Depression Ten Tropical Cyclone Report" (PDF). National Hurricane Center. Retrieved April 25, 2013.
- ↑ John L. Beven II (January 4, 2012). Tropical Cyclone Report: Tropical Storm Jose (PDF) (Report). National Hurricane Center. pp. 1, 4. Retrieved May 10, 2013.
- ↑ Daily Record
- 1 2 Blake, Kimberlain, Eric, Todd (December 2, 2011). "Unnamed Tropical Storm Tropical Cyclone Report" (PDF). National Hurricane Center. Retrieved December 2, 2011.
- ↑ Stewart, Stacy (September 2, 2011). "Graphical Tropical Weather Outlook". Retrieved July 1, 2014.
- ↑ Pasch, Richard (August 30, 2011). "Tropical Weather Outlook". National Hurricane Center. Retrieved August 30, 2011.
- ↑ Brown/Avila (September 1, 2011). "Tropical Depression Thirteen Special Advisory #1". National Hurricane Center. Retrieved September 1, 2011.
- ↑ Stewart (September 2, 2011). "Tropical Storm Lee Intermediate Advisory #4A". National Hurricane Center. Retrieved September 2, 2011.
- ↑ "Storm Lee makes landfall in Louisiana". The Sydney Morning Herald — smh. September 4, 2011. Retrieved September 4, 2011.
- ↑ NewsDesk (September 5, 2011). "Tropical Storm Lee brings more flooding, stokes wildfires". GlobalPost. Retrieved January 5, 2012.
- ↑ "Tropical Storm Lee remnants drench East Coast". CNN. September 8, 2011.
- ↑ Stewart, Stacy. "Tropical Weather Outlook". National Hurricane Center. Retrieved September 7, 2011.
- ↑ Lixion Avila (September 6, 2011). "Tropical Depression Fourteen Discussion One". National Hurricane Center. National Oceanic and Atmospheric Administration. Retrieved September 6, 2011.
- ↑ Lixion Avila (September 7, 2011). "Tropical Storm Maria Discussion Four". National Hurricane Center. National Oceanic and Atmospheric Administration. Retrieved September 7, 2011.
- ↑ Bailey, Sue (September 16, 2011). "Newfoundland 'dodges bullet' as downgraded Maria veers just shy of St. John's". The Star. Toronto.
- ↑ Avila, Lixion (2011-09-06). "Tropical Weather Outlook". National Hurricane Center. Retrieved September 16, 2011.
- ↑ Blake, Zelinsky, Eric, David (2011-09-07). "Tropical Storm Nate Advisory Number 1". National Hurricane Center. Retrieved September 16, 2011.
- 1 2 Kimberlain, Todd (2011-11-18). "Hurricane Nate Tropical Cyclone Report" (PDF). National Hurricane Center. Retrieved December 2, 2011.
- ↑ Brennan, Michael (2011-09-11). "Tropical Storm Nate Advisory Number 16A". National Hurricane Center. Retrieved September 16, 2011.
- ↑ Stewart, Stacy. "NHC Graphical Tropical Weather Outlook". National Hurricane Center. Retrieved September 24, 2011.
- ↑ Blake, Eric. "Tropical Depression Seventeen Public Advisory #1". National Hurricane Center. Retrieved September 24, 2011.
- ↑ Garcia, Felix. "Tropical Weather Discussion". National Hurricane Center. Retrieved October 28, 2011.
- ↑ Avila, Blake, Lixion, Eric. "Graphical Tropical Weather Outlook". National Hurricane Center. Retrieved October 28, 2011.
- ↑ Kimberlain, Todd. "Graphical Tropical Weather Outlook". National Hurricane Center. Retrieved October 28, 2011.
- ↑ Avila, Lixion. "Graphical Tropical Weather Oulook". National Hurricane Center. Retrieved October 28, 2011.
- ↑ Brown, Daniel. "Tropical Depression Eighteen". National Hurricane Center. Retrieved October 28, 2011.
- 1 2 3 4 5 6 7 8 Lixion Avila (January 12, 2012). Tropical Storm Sean Tropical Cyclone Report (PDF) (Report). National Hurricane Center. Retrieved January 3, 2013.
- ↑ Stacy Stewart (November 8, 2011). "Tropical Weather Outlook". National Hurricane Center. Retrieved November 10, 2011.
- ↑ Eric Blake (November 8, 2011). "Subtropical Storm Sean Discussion Number 2". National Hurricane Center. Retrieved November 11, 2011.
- ↑ Eric Blake (November 5, 2011). "Tropical Storm Sean Discussion Number 3". National Hurricane Center. Retrieved November 11, 2011.
- ↑ Eric Blake (November 9, 2011). "Tropical Storm Sean Discussion Number 6". National Hurricane Center. Retrieved November 11, 2011.
- ↑ Eric Blake (November 9, 2011). "Tropical Storm Sean Discussion Number 7". National Hurricane Center. Retrieved November 11, 2011.
- ↑ BWS Daily Climatology Written Summary November 1 2011 to November 30 2011 (Report). Bermuda Weather Service. December 1, 2011. Retrieved January 3, 2013.
- ↑ Storm Data and Unusual Weather Phenomena with Late Reports and Corrections (PDF) (Report). 53. National Climatic Data Center. Retrieved January 3, 2013.
- ↑ David Horn (November 9, 2011). "Tropical Storm Sean stirs waters off NC coast". National Hurricane Center. Retrieved February 23, 2012.
- ↑ "Retired Hurricane Names Since 1954". National Hurricane Center. Retrieved November 29, 2009.
- ↑ "Irene retired from list of Atlantic Basin storm names". National Oceanic and Atmospheric Administration. April 13, 2012. Retrieved April 25, 2013.
External links
Tropical cyclones of the 2011 Atlantic hurricane season | ||
|---|---|---|
| ||
| ||