Meteorological history of Hurricane Andrew
| Category 5 major hurricane (SSHWS/NWS) | |
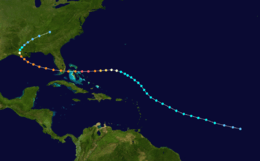 The path of Hurricane Andrew | |
| Formed | August 16, 1992 |
|---|---|
| Dissipated | August 28, 1992 |
| Highest winds |
1-minute sustained: 175 mph (285 km/h) |
| Lowest pressure | 922 mbar (hPa); 27.23 inHg |
| Areas affected | Bahamas, Southern United States |
| Part of the 1992 Atlantic hurricane season | |
|
Effects Other wikis | |
The meteorological history of Hurricane Andrew, the strongest tropical cyclone of the 1992 Atlantic hurricane season, lasted from mid to late August 1992. The hurricane developed from a tropical wave that moved off the coast of Africa on August 14. Tracking westward due to a ridge, favorable conditions allowed it to develop into Tropical Depression Three on August 16 in the deep tropical Atlantic Ocean. The cyclone gradually intensified, becoming a tropical storm on August 17. However, wind shear soon impacted the storm, causing significant increases in barometric pressure and nearly destroying its low-level circulation by August 20. Wind shear sharply decreased starting on August 21, and with warm sea surface temperatures, Andrew began rapid deepening, starting on the following day. By August 23, Andrew peaked as a Category 5 hurricane on the Saffir–Simpson hurricane wind scale while approaching The Bahamas.
The cyclone weakened slightly before making landfall on Eleuthera later that day and the Berry Islands early on August 24. However, the storm then rapidly, but briefly restrengthened into a Category 5 hurricane, and was at that intensity when it struck Elliott Key and just south of Homestead, Florida on August 24. Andrew weakened while crossing Florida, but only reduced to a Category 4 hurricane while it emerged into the Gulf of Mexico. The storm re-intensified slightly in the Gulf, causing it to maintain its status as a Category 4 hurricane. Early on August 26, Andrew weakened slightly to a low-end Category 3 hurricane before making landfall near Morgan City, Louisiana. Once inland, the cyclone rapidly weakened, and less than 24 hours after landfall, Andrew was merely a tropical depression. It continued northeastward across the Southern United States, before merging with a frontal system on August 28, while centered over the southern Appalachian Mountains.
Origins
A tropical wave moved off the coast of Africa on August 14. Under the influence of a ridge of high pressure to its north, the wave tracked quickly westward. An area of convection developed along the wave axis to the south of the Cape Verde islands, and on August 15 meteorologists began classifying the system with the Dvorak technique. The thunderstorm activity became more concentrated, and narrow spiral rainbands developed around a developing center of circulation. Based on a Dvorak T-number of 2.0, it is estimated Tropical Depression Three developed late on August 16 about 1,630 miles (2,620 km) east-southeast of Barbados.[1]

Embedded within the deep easterlies, the depression tracked west-northwestward at 20 miles per hour (32 km/h).[2] Initially, moderate wind shear prevented strengthening, though a decrease in shear allowed the depression to intensify into Tropical Storm Andrew at around 1200 UTC on August 17.[1] By early on August 18, the storm maintained concentrated convection near the center with spiral bands to its west as the winds increased to 50 miles per hour (80 km/h).[3] Shortly thereafter the thunderstorms decreased markedly during the diurnal minimum,[4] and as the storm turned to the northwest increased southwesterly wind shear from an upper-level low prevented Andrew from maintaining deep convection.[1]
On August 19, a Hurricane Hunters flight into the storm failed to locate a well-defined center,[5] and the next day a flight found that the cyclone had degenerated to the extent that only a diffuse low-level circulation center remained; observations indicated the pressure rose to an unusually high 1015 mbar. The flight indicated Andrew maintained a vigorous circulation aloft, with winds of 80 miles per hour (130 km/h) recorded at flight level. Subsequently, the upper-level low weakened and split into a trough, which decreased the wind shear over the storm. Simultaneously, a strong high pressure cell developed over the southeastern United States, which built eastward and caused Andrew to turn to the west.[1] Convection became more organized as upper-level outflow became better established.[6] An eye formed, and Andrew attained hurricane status early on August 22 while located about 650 miles (1,050 km) eastsoutheast of Nassau, Bahamas.[1]
Bahamas and Florida
Six hours after becoming a hurricane, Andrew was predicted to make landfall near Jupiter, Florida with winds of 105 miles per hour (169 km/h).[7] The hurricane accelerated as it tracked due westward into an area of very favorable conditions, and late on August 22 began rapidly intensifying; in a 24‑hour period the pressure dropped 47 mbar to a minimum pressure of 922 mbar.[1] On August 23 the cyclone attained Category 5 status on the Saffir-Simpson Hurricane Scale, and at 1800 UTC Hurricane Andrew reached peak winds of 175 miles per hour (282 km/h) while located a short distance off Eleuthera island in the Bahamas.[8] Operationally, the National Hurricane Center assessed its peak intensity as 150 miles per hour (240 km/h),[9] which was upgraded to 155 miles per hour (249 km/h) in a post-analysis after the season ended; the hurricane was later re-classified as a Category 5 hurricane.[8] The highest reported wind gust was 140 miles per hour (230 km/h) on Harbour Island, although the recording equipment failed after the reading. The hurricane also produced a storm surge of 23 feet (7.0 m) in northwestern Eleuthera.[1]
Hurricane Andrew was a small tropical cyclone, with winds of 35 miles per hour (56 km/h) extending out only about 90 miles (140 km) from its center.[10] Subsequent to peaking in intensity, the hurricane underwent an eyewall replacement cycle,[11] and at 2100 UTC on August 23, Hurricane Andrew struck Eleuthera with winds of 160 miles per hour (260 km/h).[8] The cyclone weakened further while crossing the Bahama Banks, and at 0100 UTC on August 24 Andrew hit the southern Berry Islands of the Bahamas with winds of 150 miles per hour (240 km/h).[8] As it crossed over the warm waters of the Gulf Stream in the Straits of Florida, the hurricane rapidly re-intensified as the eye decreased in size and its eyewall convection deepened.[1] At 0840 UTC on August 24, Andrew struck Elliott Key with winds of 165 miles per hour (266 km/h) and a pressure of 926 mbar. About 25 minutes after its first Florida landfall, Andrew hit just northeast of Homestead with a slightly lower pressure of 922 mbar.[8] A recording station at the National Hurricane Center recorded a peak gust of 163 miles per hour (262 km/h), and sustained winds peaked at 126 miles per hour (203 km/h) in Tamiami.[1]
As the eye moved onshore Florida, the convection in the eyewall strengthened owing to increased convergence, and Hurricane Hunters reported a warmer eyewall temperature than two hours prior. However, Hurricane Andrew weakened as the eye continued further inland, and after crossing southern Florida in four hours, the eye emerged into the Gulf of Mexico with winds of 135 miles per hour (217 km/h).[1]
Final landfall and dissipation
In the Gulf of Mexico, the eye remained well-defined as the hurricane turned to the west-northwest, a change due to the weakening of the ridge to its north.[12] Andrew steadily re-intensified over the Gulf of Mexico, reaching winds of 145 miles per hour (233 km/h) by late on August 25.[8] As the high pressure system to its north weakened, a strong mid-latitude trough approached the area from the northwest. This caused the hurricane to decelerate to the northwest,[1] and winds decreased as Andrew approached the Gulf Coast of the United States. At 0830 UTC on August 26 the cyclone made its final landfall in a sparsely populated area of Louisiana about 20 miles (32 km) west-southwest of Morgan City with winds of 115 miles per hour (185 km/h).[8]
Hurricane Andrew weakened rapidly as it turned to the north and northeast, and within ten hours weakened to a tropical storm. After entering Mississippi, the cyclone deteriorated to tropical depression status early on August 27. Accelerating northeastward, the tropical depression began merging with the approaching frontal system, and by midday on August 28 Andrew ceased to meet the qualifications of a tropical cyclone while located over the southern Appalachian Mountains.[1] The remnants continued to the northeast and lost its identity within the frontal zone over the Mid-Atlantic states.[13]
Reanalysis and statistics
| Rank | Hurricane | Season | Landfall pressure |
|---|---|---|---|
| 1 | "Labor Day" | 1935 | 892 mbar (hPa) |
| 2 | Camille | 1969 | 900 mbar (hPa) |
| 3 | Katrina | 2005 | 920 mbar (hPa) |
| 4 | Andrew | 1992 | 922 mbar (hPa) |
| 5 | "Indianola" | 1886 | 925 mbar (hPa) |
| 6 | "Florida Keys" | 1919 | 927 mbar (hPa) |
| 7 | "Okeechobee" | 1928 | 929 mbar (hPa) |
| 8 | "Great Miami" | 1926 | 930 mbar (hPa) |
| Donna | 1960 | 930 mbar (hPa) | |
| 10 | Carla | 1961 | 931 mbar (hPa) |
| Source: HURDAT,[14] Hurricane Research Division[15] | |||
In 2002, the Atlantic Basin Hurricane Database Reanalysis Project examined Hurricane Andrew and this corridor of extreme winds embedded within Andrew's northern eyewall. The project concluded that Category 5 conditions on land occurred only in a small region of southern Dade (now Miami-Dade) County, specifically close to the coast in Cutler Ridge. The remaining areas affected by Andrew's initial landfall in Florida likely experienced sustained Category 4 and 3 hurricane conditions. Andrew was officially re-classified as a Category 5 storm in 2004, and the reanalysis provided a more comprehensive and detailed examination of Andrew's wind field structure upon landfall than originally assessed in 1992.[8]
Andrew's peak winds in South Florida were not directly measured, primarily because of the destruction or failure of measuring instruments. The Coastal Marine Automated Network (C-MAN) station at Fowey Rocks, with platform elevation of 141 feet (43 m), in its last transmission at 4:30 a.m. EDT, August 24, recorded an 8-minute average wind of 142 miles per hour (229 km/h) with a peak gust of 169 miles per hour (272 km/h) shortly before the equipment was destroyed. It is probable that higher winds occurred at Fowey Rocks after the station was destroyed.[1] The highest recorded surface gust, within Andrew's northern eyewall, occurred at the home of a resident about a mile from the shoreline in Perrine, Florida. During the peak of the storm, a gust of 212 miles per hour (341 km/h) was observed before both the home and anemometer were destroyed. Subsequent wind-tunnel testing at Clemson University of the same type of anemometer revealed a 16.5% error. The observed value was officially corrected to be 177 miles per hour (285 km/h).[1]

Another important wind speed report came from the Kendall-Tamiami Executive Airport, located nine miles (14 km) west of the shoreline. While weather observations had been suspended at the station, the official weather observer there stayed on duty and continued to make wind speed readings. At 4:45 a.m. EDT, August 24, he noted that the wind speed indicator was "pegged" at a position a little beyond the instrument's highest value of 100 kt (115 mph; 185 km/h), at a point he estimated to be around 110 kt (127 mph; 204 km/h). The needle reportedly remained "fixed" at this location for 3–5 minutes before dropping to "0" when the anemometer failed. These observations were closely corroborated by two other observers. He also indicated that the weather conditions continued to worsen for an additional 30 minutes after the anemometer failed. It is probable that much stronger winds occurred at this location.[1]
See also
References
- 1 2 3 4 5 6 7 8 9 10 11 12 13 14 15 Edward N Rappaport; National Hurricane Center (December 10, 1993). Hurricane Andrew (Preliminary Report). United States National Oceanic and Atmospheric Administration's National Weather Service. Retrieved May 8, 2012.
- ↑ Mayfield (1992). "Tropical Depression Three Discussion One". National Hurricane Center. Retrieved 2007-08-27.
- ↑ Rappaport (1992). "Tropical Storm Andrew Discussion Five". National Hurricane Center. Retrieved 2007-08-27.
- ↑ Gerrish (1992). "Tropical Storm Andrew Discussion Eight". National Hurricane Center. Retrieved 2007-08-27.
- ↑ Lawrence (1992). "Tropical Storm Andrew Discussion Thirteen". National Hurricane Center. Retrieved 2007-08-27.
- ↑ Mayfield (1992). "Tropical Storm Andrew Discussion Twenty". National Hurricane Center. Retrieved 2007-08-27.
- ↑ Mayfield (1992). "Hurricane Andrew Discussion Twenty-Three". National Hurricane Center. Retrieved 2007-08-28.
- 1 2 3 4 5 6 7 8 Christopher Landsea; et al. (2004). "A Re-Analysis of Hurricane Andrew's Intensity" (PDF). American Meteorological Society. Retrieved 2007-08-28.
- ↑ Mayfield (1992). "Hurricane Andrew Discussion Thirty". National Hurricane Center. Retrieved 2007-08-28.
- ↑ Chris Landsea (2004). "Aren't big tropical cyclones also intense tropical cyclones?". Hurricane Research Division. Retrieved 2007-08-28.
- ↑ Rappaport, Gerrish, & Pasch (1992). "Hurricane Andrew Discussion Thirty-One". National Hurricane Center. Retrieved 2007-08-28.
- ↑ Avila & Mayfield (1992). "Hurricane Andrew Discussion Thirty-Five". National Hurricane Center. Retrieved 2007-08-28.
- ↑ David Roth (2007). "Rainfall Summary for Hurricane Andrew". Hydrometeorological Prediction Center. Retrieved 2007-08-29.
- ↑ National Hurricane Center; Hurricane Research Division (July 6, 2016). "Atlantic hurricane best track (HURDAT version 2)". United States National Oceanic and Atmospheric Administration. Retrieved December 16, 2016.
- ↑ National Hurricane Center; Hurricane Research Division; Atlantic Oceanographic and Meteorological Laboratory (February 2015). "Continental United States Hurricanes (Detailed Description)". aoml.noaa.gov. Miami: United States National Oceanic and Atmospheric Administration's Office of Oceanic & Atmospheric Research. Retrieved December 16, 2016.