Gillingham (UK Parliament constituency)
| Gillingham | |
|---|---|
|
Former Borough constituency for the House of Commons | |
|
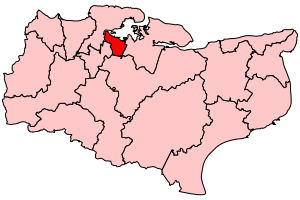
Boundary of Gillingham in Kent for the 2005 general election. | |
|
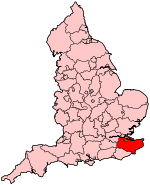
Location of Kent within England. | |
| County | Kent |
| 1918–2010 | |
| Replaced by | Gillingham and Rainham |
Gillingham was a constituency represented in the House of Commons of the Parliament of the United Kingdom. It elected one Member of Parliament (MP) by the first past the post system of election.
Boundaries
1918-1950: The Municipal Borough of Gillingham, part of the Municipal Borough of Rochester, and the Municipal Borough of Chatham ward of St Mary.
1950-1983: The Municipal Borough of Gillingham.
1983-1997: The Borough of Gillingham, and the Borough of Swale ward of Hartlip and Upchurch.
1997-2010: The Borough of Gillingham.
The constituency was based around the towns of Gillingham and Rainham, which at that time were in Kent.
Boundary review
Following their review of parliamentary representation in Kent, the Boundary Commission for England abolished Gillingham, replacing it with the renamed constituency of Gillingham and Rainham.
Members of Parliament
| Election | Member[1] | Party | |
|---|---|---|---|
| 1918 | Sir Gerald Fitzroy Hohler | Conservative | |
| 1929 | Sir Robert Vaughan Gower | Conservative | |
| 1945 | Joseph Binns | Labour | |
| 1950 | Sir Frederick Burden | Conservative | |
| 1983 | James Couchman | Conservative | |
| 1997 | Paul Clark | Labour | |
| 2010 | Constituency abolished: see extended constituency of Gillingham and Rainham. | ||
Elections
Elections in the 2000s
| Party | Candidate | Votes | % | ± | |
|---|---|---|---|---|---|
| Labour | Paul Clark | 18,621 | 41.2 | -3.3 | |
| Conservative | Tim Butcher | 18,367 | 40.7 | +1.6 | |
| Liberal Democrat | Andrew Stamp | 6,734 | 14.9 | +1.3 | |
| UKIP | Craig Mackinlay | 1,191 | 2.6 | +0.4 | |
| Independent | Gordon Bryan | 254 | 0.6 | +0.6 | |
| Majority | 254 | 0.6 | |||
| Turnout | 45,167 | 62.5 | +3.0 | ||
| Labour hold | Swing | −2.4 | |||
| Party | Candidate | Votes | % | ± | |
|---|---|---|---|---|---|
| Labour | Paul Clark | 18,782 | 44.5 | +4.7 | |
| Conservative | Tim Butcher | 16,510 | 39.1 | +3.2 | |
| Liberal Democrat | Jonathan Hunt | 5,755 | 13.6 | -5.4 | |
| UKIP | Tony Scholefield | 933 | 2.2 | +1.0 | |
| Socialist Alliance | Wynford Thomas | 232 | 0.5 | N/A | |
| Majority | 2,272 | 5.4 | |||
| Turnout | 42,212 | 59.5 | -12.5 | ||
| Labour hold | Swing | +0.7 | |||
Elections in the 1990s
| Party | Candidate | Votes | % | ± | |
|---|---|---|---|---|---|
| Labour | Paul Clark | 20,187 | 39.8 | N/A | |
| Conservative | James Couchman | 18,207 | 35.9 | N/A | |
| Liberal Democrat | Robert Sayer | 9,649 | 19.0 | N/A | |
| Referendum | Geoffrey Cann | 1,492 | 2.9 | N/A | |
| UKIP | Craig Mackinlay | 590 | 1.2 | N/A | |
| Monster Raving Loony | David Robinson | 305 | 0.6 | N/A | |
| BNP | Christopher Jury | 194 | 0.4 | N/A | |
| Natural Law | Gabriel Duguay | 58 | 0.1 | N/A | |
| Majority | 1,980 | 3.0 | N/A | ||
| Labour gain from Conservative | Swing | +16 | |||
| Party | Candidate | Votes | % | ± | |
|---|---|---|---|---|---|
| Conservative | James Couchman | 30,201 | 52.3 | -0.7 | |
| Labour | Paul Clark | 13,563 | 23.5 | +6.4 | |
| Liberal Democrat | Mark Wallabank | 13,509 | 23.4 | -6.5 | |
| Independent | Craig Mackinlay | 248 | 0.4 | +0.4 | |
| Natural Law | Daniel Jolicoeur | 190 | 0.3 | +0.3 | |
| Majority | 16,638 | 28.8 | +5.6 | ||
| Turnout | 57,711 | 80.3 | +4.9 | ||
| Conservative hold | Swing | -3.6 | |||
Elections in the 1980s
| Party | Candidate | Votes | % | ± | |
|---|---|---|---|---|---|
| Conservative | James Couchman | 28,711 | 53.07 | +1.35 | |
| SDP–Liberal Alliance | Leighton Russell Andrews | 16,162 | 29.87 | -0.59 | |
| Labour | David John Bishop | 9,230 | 17.06 | -0.75 | |
| Majority | 12,549 | 23.19 | +1.93 | ||
| Turnout | 54,100 | 75.3 | +1.66 | ||
| Registered electors | 71,847 | ||||
| Conservative hold | Swing | +0.97 | |||
| Party | Candidate | Votes | % | ± | |
|---|---|---|---|---|---|
| Conservative | James Couchman | 26,381 | 51.72 | -1.41 | |
| SDP–Liberal Alliance | Christopher Peter Lewcock | 15,538 | 30.46 | +18.13 | |
| Labour | Antony Stanley West | 9,084 | 17.81 | -14.85 | |
| Majority | 10,843 | 21.26 | +0.44 | ||
| Turnout | 51,000 | 73.64 | -5.21 | ||
| Registered electors | 69,256 | ||||
| Conservative hold | Swing | -9.77 | |||
Elections in the 1970s
| Party | Candidate | Votes | % | ± | |
|---|---|---|---|---|---|
| Conservative | Frederick Frank Arthur Burden | 26,791 | 53.13 | +12.74 | |
| Labour | Stephen Sidney Earnest William Love | 16,292 | 32.31 | +0.39 | |
| Liberal | David Philip Sidebottom | 6,219 | 12.33 | - 13.40 | |
| National Front | Sidney George Campbell | 528 | 1.05 | -0.91 | |
| Ecology | Colin Richard Fry | 501 | 0.99 | N/A | |
| Workers Revolutionary | Terence Frederick Beckwith | 92 | 0.18 | N/A | |
| Majority | 10,499 | 20.82 | +12.34 | ||
| Turnout | 50,425 | 78.85 | +2.94 | ||
| Registered electors | 63,951 | ||||
| Conservative hold | Swing | +6.18 | |||
| Party | Candidate | Votes | % | ± | |
|---|---|---|---|---|---|
| Conservative | Frederick Frank Arthur Burden | 19,042 | 40.39 | -0.79 | |
| Labour | Henry Gordon Nansen Clother | 15,046 | 31.92 | +2.31 | |
| Liberal | Owen Trevor Jones | 12,131 | 25.73 | -3.88 | |
| National Front | Sidney George Campbell | 922 | 1.96 | N/A | |
| Majority | 3,996 | 8.48 | -3.09 | ||
| Turnout | 47,139 | 75.91 | -6.75 | ||
| Registered electors | 62,099 | ||||
| Conservative hold | Swing | -1.55 | |||
| Party | Candidate | Votes | % | ± | |
|---|---|---|---|---|---|
| Conservative | Frederick Frank Arthur Burden | 20,934 | 41.18 | -16.66 | |
| Liberal | Robert John Sayer | 15,052 | 29.61 | N/A | |
| Labour | Henry Gordon Nansen Clother | 14,850 | 29.21 | -11.95 | |
| Majority | 5,882 | 11.57 | -6.11 | ||
| Turnout | 50,834 | 82.66 | +9.30 | ||
| Registered electors | 61,498 | ||||
| Conservative hold | Swing | -23.14 | |||
| Party | Candidate | Votes | % | ± | |
|---|---|---|---|---|---|
| Conservative | Frederick Frank Arthur Burden | 14,003 | 58.84 | +9.34 | |
| Labour | Robert E Bean | 18,057 | 41.16 | -0.63 | |
| Majority | 7,756 | 17.68 | +9.97 | ||
| Turnout | 43,869 | 73.36 | -5.14 | ||
| Registered electors | 59,800 | ||||
| Conservative hold | Swing | +4.99 | |||
Elections in the 1960s
| Party | Candidate | Votes | % | ± | |
|---|---|---|---|---|---|
| Conservative | Frederick Frank Arthur Burden | 20,158 | 49.50 | -1.85 | |
| Labour | Joseph Binns | 17,018 | 41.79 | +4.77 | |
| Liberal | Godfrey A Payne | 3,546 | 8.71 | -1.58 | |
| Majority | 3,140 | 7.71 | -6.62 | ||
| Turnout | 40,722 | 78.50 | +0.45 | ||
| Registered electors | 51,874 | ||||
| Conservative hold | Swing | -3.31 | |||
| Party | Candidate | Votes | % | ± | |
|---|---|---|---|---|---|
| Conservative | Frederick Frank Arthur Burden | 20,228 | 51.35 | -7.98 | |
| Labour | John Ryman | 14,584 | 37.02 | -3.65 | |
| Liberal | Godfrey A Payne | 4,052 | 10.29 | N/A | |
| Independent | Frederick Cotter | 527 | 1.34 | N/A | |
| Majority | 5,644 | 14.33 | -4.33 | ||
| Turnout | 39,391 | 78.05 | -2.56 | ||
| Registered electors | 50,471 | ||||
| Conservative hold | Swing | -2.17 | |||
Elections in the 1950s
| Party | Candidate | Votes | % | ± | |
|---|---|---|---|---|---|
| Conservative | Frederick Frank Arthur Burden | 23,142 | 59.33 | +3.85 | |
| Labour | Gerald Bernard Kaufman | 15,863 | 40.67 | -3.85 | |
| Majority | 7,279 | 18.66 | +7.70 | ||
| Turnout | 39,005 | 80.61 | +1.08 | ||
| Registered electors | 48,390 | ||||
| Conservative hold | Swing | +3.85 | |||
| Party | Candidate | Votes | % | ± | |
|---|---|---|---|---|---|
| Conservative | Frederick Frank Arthur Burden | 20,984 | 55.48 | +1.77 | |
| Labour | Lt.-Cmdr. Joseph Huddart | 16,839 | 44.52 | -1.77 | |
| Majority | 4,145 | 10.96 | +3.54 | ||
| Turnout | 37,823 | 79.53 | -5.94 | ||
| Registered electors | 47,561 | ||||
| Conservative hold | Swing | +1.77 | |||
| Party | Candidate | Votes | % | ± | |
|---|---|---|---|---|---|
| Conservative | Frederick Frank Arthur Burden | 21,453 | 53.71 | +1.04 | |
| Labour | Edward Charles Redhead | 18,489 | 46.29 | -1.04 | |
| Majority | 2,964 | 7.42 | +2.08 | ||
| Turnout | 39,942 | 85.47 | +0.60 | ||
| Registered electors | 46,731 | ||||
| Conservative hold | Swing | +1.04 | |||
| Party | Candidate | Votes | % | ± | |
|---|---|---|---|---|---|
| Conservative | Frederick Frank Arthur Burden | 20,504 | 52.67 | +5.94 | |
| Labour | Joseph Binns | 18,424 | 47.33 | -5.94 | |
| Majority | 2,080 | 5.34 | N/A | ||
| Turnout | 38,928 | 84.87 | +13.54 | ||
| Registered electors | 45,866 | ||||
| Conservative gain from Labour | Swing | +5.94 | |||
Elections in the 1940s
| Party | Candidate | Votes | % | ± | |
|---|---|---|---|---|---|
| Labour | Joseph Binns | 15,110 | 53.27 | +18.39 | |
| Conservative | Major John Bigelow Dodge | 13,254 | 46.73 | -18.39 | |
| Majority | 1,856 | 6.54 | N/A | ||
| Turnout | 28,364 | 71.33 | -0.08 | ||
| Registered electors | 39,765 | ||||
| Labour gain from Conservative | Swing | +18.39 | |||
Elections in the 1930s
| Party | Candidate | Votes | % | ± | |
|---|---|---|---|---|---|
| Conservative | Sir Robert Vaughan Gower | 18,726 | 65.12 | -3.90 | |
| Labour | Evan Frank Mottram Durbin | 10,032 | 34.88 | +3.90 | |
| Majority | 8,694 | 30.23 | -7.70 | ||
| Turnout | 28,758 | 71.41 | -2.66 | ||
| Registered electors | 40,271 | ||||
| Conservative hold | Swing | -3.90 | |||
| Party | Candidate | Votes | % | ± | |
|---|---|---|---|---|---|
| Conservative | Sir Robert Vaughan Gower | 20,277 | 69.02 | +21.05 | |
| Labour | Mrs CM Wadham | 9,103 | 30.98 | -8.52 | |
| Majority | 11,174 | 38.03 | +29.56 | ||
| Turnout | 29,380 | 74.07 | +0.05 | ||
| Registered electors | 39,664 | ||||
| Conservative hold | Swing | +14.79 | |||
Elections in the 1920s
| Party | Candidate | Votes | % | ± | |
|---|---|---|---|---|---|
| Conservative | Sir Robert Vaughan Gower | 13,612 | 47.97 | -4.72 | |
| Labour | George Pearce Blizard | 11,207 | 39.50 | +4.24 | |
| Liberal | R Ronald Tyrer | 3,556 | 12.53 | -4.90 | |
| Majority | 2,405 | 8.47 | -3.97 | ||
| Turnout | 28,375 | 74.02 | -3.98 | ||
| Registered electors | 38,336 | ||||
| Conservative hold | Swing | -4.48 | |||
| Party | Candidate | Votes | % | ± | |
|---|---|---|---|---|---|
| Conservative | Gerald Fitzroy Hohler | 12,418 | 52.69 | +5.55 | |
| Labour | Maurice Spencer | 8,309 | 35.26 | +0.56 | |
| Liberal | George Herbert Bryans | 2,839 | 17.43 | +5.38 | |
| Majority | 4,109 | 12.44 | -3.84 | ||
| Turnout | 23,566 | 78.00 | +4.08 | ||
| Registered electors | 30,212 | ||||
| Conservative hold | Swing | +2.50 | |||
| Party | Candidate | Votes | % | ± | |
|---|---|---|---|---|---|
| Conservative | Gerald Fitzroy Hohler | 10,426 | 47.14 | -11.00 | |
| Labour | Maurice Spencer | 7,674 | 34.70 | -7.16 | |
| Liberal | George Herbert Bryans | 4,015 | 18.16 | N/A | |
| Majority | 2,752 | 12.44 | -3.84 | ||
| Turnout | 22,115 | 73.92 | +1.63 | ||
| Registered electors | 29,919 | ||||
| Conservative hold | Swing | -1.92 | |||
| Party | Candidate | Votes | % | ± | |
|---|---|---|---|---|---|
| Conservative | Gerald Fitzroy Hohler | 12,425 | 58.14 | -10.44 | |
| Labour | 8,944 | 41.86 | +15.95 | ||
| Majority | 3,481 | 16.28 | -26.39 | ||
| Turnout | 21,369 | 72.29 | +7.19 | ||
| Registered electors | 29,560 | ||||
| Conservative hold | Swing | -13.20 | |||
Elections in the 1910s
| Party | Candidate | Votes | % | ± | |
|---|---|---|---|---|---|
| Conservative | Gerald Fitzroy Hohler | 12,455 | 68.58 | N/A | |
| Labour | 4,705 | 25.91 | N/A | ||
| Other | 1,001 | 5.51 | N/A | ||
| Majority | 7,750 | 42.67 | N/A | ||
| Turnout | 18,161 | 65.10 | N/A | ||
| Registered electors | 27,899 | ||||
| Conservative win (new seat) | |||||
See also
Notes and references
- ↑ Leigh Rayment's Historical List of MPs – Constituencies beginning with "G" (part 1)
- ↑ "Politics Resources". Election 1992. Politics Resources. 9 April 1992. Retrieved 6 December 2010.
- 1 2 "'Gillingham', June 1983 up to May 1997". ElectionWeb Project. Cognitive Computing Limited. Retrieved 14 April 2016.
- ↑ Kimber, Richard. "UK General Election results 1987". Political Science Resources. Retrieved 14 April 2016.
- ↑ Kimber, Richard. "UK General Election results 1983". Political Science Resources. Retrieved 14 April 2016.
- 1 2 3 "'Gillingham', Feb 1974 - May 1983". ElectionWeb Project. Cognitive Computing Limited. Retrieved 14 April 2016.
- ↑ Kimber, Richard. "UK General Election results 1979". Political Science Resources. Retrieved 14 April 2016.
- ↑ Kimber, Richard. "UK General Election results October 1974". Political Science Resources. Retrieved 14 April 2016.
- ↑ Kimber, Richard. "UK General Election results February 1974". Political Science Resources. Retrieved 14 April 2016.
- ↑ Kimber, Richard. "UK General Election results 1970". Political Science Resources. Retrieved 14 April 2016.
- ↑
- ↑ Kimber, Richard. "UK General Election results 1966". Political Science Resources. Retrieved 14 April 2016.
- ↑
- ↑ Kimber, Richard. "UK General Election results 1964". Political Science Resources. Retrieved 14 April 2016.
- ↑
- ↑ Kimber, Richard. "UK General Election results 1959". Political Science Resources. Retrieved 14 April 2016.
- ↑
- ↑ Kimber, Richard. "UK General Election results 1955". Political Science Resources. Retrieved 14 April 2016.
- ↑
- ↑ Kimber, Richard. "UK General Election results 1951". Political Science Resources. Retrieved 14 April 2016.
- ↑
- ↑ Kimber, Richard. "UK General Election results 1950". Political Science Resources. Retrieved 14 April 2016.
- ↑
- 1 2 3 4 5 6 7 8 "Rochester Gillingham PBDivCon through time - Political Life Statistics - Groupings of Political Parties". A Vision of Britain through Time. GB Historical GIS / University of Portsmouth. Retrieved 14 April 2016.
- 1 2 3 4 5 6 7 8 "Rochester Gillingham PBDivCon through time - Political Life Statistics - Total Electorate". A Vision of Britain through Time. GB Historical GIS / University of Portsmouth. Retrieved 14 April 2016.
- ↑ Kimber, Richard. "UK General Election results 1945". Political Science Resources. Retrieved 14 April 2016.
- ↑ Kimber, Richard. "UK General Election results 1935". Political Science Resources. Retrieved 14 April 2016.
- ↑ Kimber, Richard. "UK General Election results 1931". Political Science Resources. Retrieved 14 April 2016.
- 1 2 British Parliamentary Election Results 1918-1949, FWS Craig
Coordinates: 51°23′N 0°33′E / 51.383°N 0.550°E