Geography of Louisville, Kentucky

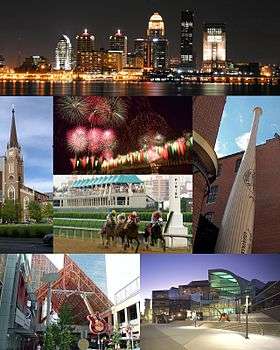
Louisville is a city in Jefferson County, in the U.S. state of Kentucky. It is located at the Falls of the Ohio River.
Louisville is located at 38°13′31″N 85°44′30″W / 38.225371°N 85.741613°WCoordinates: 38°13′31″N 85°44′30″W / 38.225371°N 85.741613°W.[1] According to the U.S. Census Bureau, Louisville Metro (in 2015 measurements for Jefferson County) has a total area of 397.68 square miles (1,030.0 km2), of which 380.46 square miles (985.4 km2) is land and 17.23 square miles (44.6 km2) (4.33%) is covered by water.[2]
Topography and geomorphology
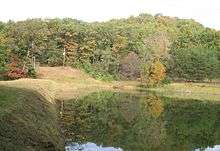
Although the soils and underlying rocks officially put Louisville in the outer Bluegrass region, the city's landscape is better described as being in a very wide part of the Ohio River flood plain. Louisville's part of the valley is located between two plateaus, the karst plateau of Southern Indiana and the Bluegrass plateau of Kentucky, both with an elevation of around 900 feet. Elevations drop off the Indiana plateau very sharply via the Muldraugh Escarpment, whereas the rise in elevation up to the Bluegrass plateau is done more gradually.
The flood plain is much longer north to south than it is east to west. For example, within several miles of downtown, the Highlands sitting at 540 feet is out of the thousand year flood plain, whereas areas 10 miles from downtown such as Fairdale and Okolona (both between seven and 11 miles from the river) have the same elevation as downtown Louisville. Most areas in the east end have an elevation from 600 to 700 feet, which, with the typically east bound winds, trap in heat and pollutants.
Areas along and west of the south fork of Beargrass Creek (and more generally, I-65) are located where the Ohio River once ran, so the land here is very flat and is composed of harder rocks. Prior to urbanization much of this area was composed of wetlands, and early roads through these were made of wooden planks. This history is occasionally still readily evident in street names, for example the spoke road Poplar Level, whose name describes its original construction on planks of poplar. 3rd Street was formerly called Central Plank Road for the same reason. As industry, namely Standiford Field airport, moved into the area in the 1950s most creeks through the area were rerouted into ditches to alleviate the area's poor drainage and constant flooding.
Areas east of I-65 were generally not in the flood plain and thus are mostly gentle rollings hills composed of soft loess soils, hence the reason roads here (such as Eastern Parkway) are very prone to potholes. The southern quarter of Jefferson County is in the scenic and rugged Knobs region. This is the only part of Jefferson County to not have experienced any urbanization and is today almost entirely parkland for the Jefferson Memorial Forest. The eastern third is in the Eden Shale Hills section of the Bluegrass region and has also experienced less urbanization than the flood plain, although that is starting to change.
Political geography and population

The Louisville-Jefferson County, KY-IN Metropolitan Statistical Area (MSA), the 43rd-largest in the United States,[3] includes the Kentucky counties of Jefferson (coterminous with Louisville Metro), Bullitt, Henry, Meade, Nelson, Oldham, Shelby, Spencer and Trimble. The southern Indiana counties Clark, Floyd, Harrison and Washington are also included in the Louisville MSA. This MSA is included in the Louisville-Elizabethtown-Scottsburg, KY-IN Combined Statistical Area (CSA), which also includes the Elizabethtown, KY MSA (composed of Hardin and LaRue Counties) as well as the Scottsburg, IN Micropolitan Statistical Area.
Louisville's Metro Area was expanded more than any other in the country during a March 2003 overhaul of U.S. Metropolitan Area statistics by the federal government. In the 2000 census, even very fast growing counties such as Spencer County weren't included. The Metro Area's ranking rose from 49th to 42nd, and the added Combined Statistical Area measured the area as the nation's 31st-largest. The total Metro area population also increased dramatically from just over 1 million to nearly 1.4 for the CSA.
Seventeen percent of the state's population lives in Jefferson County and 25% live in counties in the Louisville CSA, and also Jefferson County has two-and-a-half times more people than Kentucky's second-most populous county, Fayette County. Twelve of the 15 buildings in Kentucky over 300 feet are located in Downtown Louisville. Almost 40% of the population growth in Kentucky are in Louisville's CSA counties.
Climate
| Louisville | ||||||||||||||||||||||||||||||||||||||||||||||||||||||||||||
|---|---|---|---|---|---|---|---|---|---|---|---|---|---|---|---|---|---|---|---|---|---|---|---|---|---|---|---|---|---|---|---|---|---|---|---|---|---|---|---|---|---|---|---|---|---|---|---|---|---|---|---|---|---|---|---|---|---|---|---|---|
| Climate chart (explanation) | ||||||||||||||||||||||||||||||||||||||||||||||||||||||||||||
| ||||||||||||||||||||||||||||||||||||||||||||||||||||||||||||
| ||||||||||||||||||||||||||||||||||||||||||||||||||||||||||||
Louisville has a humid subtropical climate (Köppen Cfa) with four distinct seasons and is located in USDA hardiness zones 6b and 7a.[4] Spring-like conditions typically begin in mid-to-late March, summer from mid-to-late-May to late September, with fall in the October–November period. Seasonal extremes in both temperature and precipitation are not uncommon during early spring and late fall; severe weather is not uncommon, with occasional tornado outbreaks in the region. Winter typically brings a mix of rain, sleet, and snow, with occasional heavy snowfall and icing. Louisville averages 5.8 days with low temperatures dipping to 10 °F (−12 °C), while readings of 0 °F (−18 °C) or below occur on average every several years, the last occurrence being January 7, 2014; the average window for freezing temperatures is October 31 thru April 6, allowing a growing season of 207 days.[5] Summer is typically hazy, hot, and humid with long periods of 90–100 °F (32–38 °C) temperatures and drought conditions at times. Louisville averages 35 days a year with high temperatures at or above 90 °F (32 °C),[lower-alpha 1] and the average window for such temperatures on average fall on June 7 and September 10, respectively. The mean annual temperature is 58.2 °F (14.6 °C),[lower-alpha 2] with an average seasonal snowfall of 12.5 in (32 cm) and an average annual rainfall of 44.9 inches (1,140 mm).[lower-alpha 3][lower-alpha 4] The first and last measurable (≥0.1 in or 0.25 cm) snowfalls of the season on average fall on December 8 and March 12, respectively. The greatest amount of precipitation in 24 hours was 10.48 inches (266.2 mm) on March 1, 1997 and the heaviest 24-hour snowfall total was 15.5 in (39.4 cm), occurring only two days before the all-time record low (see below).[5]
The wettest seasons are spring and summer, although rainfall is fairly constant year round. During the winter, particularly in January and February, several days of snow can be expected. January is the coldest month, with a mean temperature of 34.9 °F (1.6 °C). July is the average hottest month with a mean of 79.3 °F (26.3 °C).[6] The highest recorded temperature was 107 °F (42 °C), which last occurred on July 14, 1936, and the lowest recorded temperature was −22 °F (−30 °C) on January 19, 1994.[7] The record high daily minimum was 84 °F (29 °C) on August 19, 1936, while the record low daily maximum was −2 °F (−19 °C) on January 12, 1918; the only other sub-0 °F (−18 °C) daily maximum occurred on January 5, 1884. In 2012, Louisville had the fourth-hottest summer on record, with the temperature rising up to 106 °F (41 °C) in July and the June all-time monthly record-high temperature being broken on two consecutive days.[5] As the city exemplifies the urban heat island effect, temperatures in commercial areas and in the industrialized areas along interstates are often higher than in the suburbs, often as much as 5 °F (2.8 °C).
Air pollution is trapped in Louisville's Ohio River Valley location. The city is ranked by Environmental Defense as America's 38th-worst city for air quality.[8]
Louisville's lowest solar noon is 28.4 degrees with the shortest daylength being 9 hours and 30 seconds, both occurring from December 17–26. The city's highest solar noon is 75.2 degrees with the longest daylength being 14 hours and 39 seconds, both occurring from June 17–25. The city's March and September equinox occurs at 50.5 degrees.[9]
| Climate data for Louisville International Airport, Kentucky (1981–2010 normals,[lower-alpha 5] extremes 1872–present[lower-alpha 6]) | |||||||||||||
|---|---|---|---|---|---|---|---|---|---|---|---|---|---|
| Month | Jan | Feb | Mar | Apr | May | Jun | Jul | Aug | Sep | Oct | Nov | Dec | Year |
| Record high °F (°C) | 77 (25) |
78 (26) |
88 (31) |
91 (33) |
98 (37) |
105 (41) |
107 (42) |
105 (41) |
104 (40) |
93 (34) |
85 (29) |
76 (24) |
107 (42) |
| Mean maximum °F (°C) | 64.7 (18.2) |
69.4 (20.8) |
78.5 (25.8) |
84.2 (29) |
87.8 (31) |
92.9 (33.8) |
95.5 (35.3) |
95.7 (35.4) |
91.8 (33.2) |
84.3 (29.1) |
75.3 (24.1) |
65.3 (18.5) |
97.0 (36.1) |
| Average high °F (°C) | 43.0 (6.1) |
47.8 (8.8) |
57.9 (14.4) |
68.8 (20.4) |
77.1 (25.1) |
85.3 (29.6) |
88.7 (31.5) |
88.3 (31.3) |
81.5 (27.5) |
70.1 (21.2) |
57.9 (14.4) |
45.8 (7.7) |
67.8 (19.9) |
| Average low °F (°C) | 26.8 (−2.9) |
29.9 (−1.2) |
37.8 (3.2) |
47.3 (8.5) |
57.0 (13.9) |
66.0 (18.9) |
69.9 (21.1) |
68.5 (20.3) |
60.5 (15.8) |
48.9 (9.4) |
39.5 (4.2) |
30.0 (−1.1) |
48.6 (9.2) |
| Mean minimum °F (°C) | 4.9 (−15.1) |
10.2 (−12.1) |
20.1 (−6.6) |
30.4 (−0.9) |
41.0 (5) |
52.1 (11.2) |
58.7 (14.8) |
57.2 (14) |
44.7 (7.1) |
32.8 (0.4) |
23.0 (−5) |
9.2 (−12.7) |
0.2 (−17.7) |
| Record low °F (°C) | −22 (−30) |
−19 (−28) |
−1 (−18) |
21 (−6) |
31 (−1) |
42 (6) |
49 (9) |
45 (7) |
33 (1) |
23 (−5) |
−1 (−18) |
−15 (−26) |
−22 (−30) |
| Average precipitation inches (mm) | 3.24 (82.3) |
3.18 (80.8) |
4.17 (105.9) |
4.01 (101.9) |
5.27 (133.9) |
3.79 (96.3) |
4.23 (107.4) |
3.33 (84.6) |
3.05 (77.5) |
3.22 (81.8) |
3.59 (91.2) |
3.83 (97.3) |
44.91 (1,140.7) |
| Average snowfall inches (cm) | 3.7 (9.4) |
4.5 (11.4) |
1.4 (3.6) |
0.1 (0.3) |
0 (0) |
0 (0) |
0 (0) |
0 (0) |
0 (0) |
0.1 (0.3) |
0.1 (0.3) |
2.6 (6.6) |
12.5 (31.8) |
| Average precipitation days (≥ 0.01 in) | 10.4 | 10.1 | 11.9 | 11.7 | 12.6 | 10.3 | 10.0 | 8.0 | 8.0 | 7.7 | 10.1 | 12.0 | 122.8 |
| Average snowy days (≥ 0.1 in) | 3.6 | 3.6 | 1.2 | 0.1 | 0 | 0 | 0 | 0 | 0 | 0.1 | 0.3 | 2.9 | 11.8 |
| Average relative humidity (%) | 68.6 | 68.1 | 64.0 | 61.5 | 67.2 | 68.9 | 70.9 | 71.7 | 72.9 | 69.9 | 69.4 | 70.2 | 68.6 |
| Mean monthly sunshine hours | 140.5 | 148.9 | 188.6 | 221.1 | 263.4 | 288.9 | 293.6 | 272.6 | 234.3 | 208.5 | 135.7 | 118.3 | 2,514.4 |
| Percent possible sunshine | 46 | 49 | 51 | 56 | 60 | 65 | 65 | 65 | 63 | 60 | 45 | 40 | 56 |
| Source: NOAA (sun 1961–1990)[10][5][11] | |||||||||||||
See also
Notes
- ↑ The number of 90 °F+ days has historically ranged from 3 in 1974 to 85 in 2010.[5]
- ↑ The coolest year on record was 53.6 °F (12.0 °C) in 1917, while the warmest 60.8 °F (16.0 °C) in 2012. Monthly mean temperatures have ranged from 18.6 °F (−7.4 °C) in January 1977 to 85.0 °F (29.4 °C) in August 2007, although the highest average monthly minimum temperature was 74.5 °F (23.6 °C) in July 2011.[5]
- ↑ Historically, winter snowfall has ranged from 0.9 in (2.3 cm) in 1988–89 to 50.2 in (128 cm) in 1917–18.
- ↑ Annual precipitation has ranged from 23.88 in (607 mm) in 1930 to 68.02 in (1,728 mm) in 2011.
- ↑ Mean monthly maxima and minima (i.e. the expected highest and lowest temperature readings at any point during the year or given month) calculated based on data at said location from 1981 to 2010.
- ↑ Official records for Louisville were kept at the Weather Bureau Office from August 1872 to June 1945, Bowman Field from July 1945 to November 1947, Louisville Int'l from December 1947 to October 1995, the Weather Forecast Office (38°06′54″N 85°38′42″W / 38.1150°N 85.6450°W) from November 1995 to December 2005, and again at Louisville Int'l since January 2006. For more information, see Threadex
References
- ↑ "U.S. Gazetteer file for Kentucky places (Louisville city)". United States Census Bureau. 2015. Retrieved August 26, 2016.
- ↑ "U.S. Gazetteer file for Kentucky counties (Jefferson County)". United States Census Bureau. 2015. Retrieved August 26, 2016.
- ↑ "Table 1. Annual Estimates of the Population of Metropolitan and Micropolitan Statistical Areas: April 1, 2010 to July 1, 2013" (CSV). 2013 Population Estimates. United States Census Bureau, Population Division. March 2014. Retrieved June 15, 2014.
- ↑ "USDA Plant Hardiness Zone Interactive Map". Planthardiness.ars.usda.gov. Retrieved March 31, 2014.
- 1 2 3 4 5 6 "NowData - NOAA Online Weather Data". National Oceanic and Atmospheric Administration. Retrieved 2016-11-02.
- ↑ Climate information from NOAA
- ↑ Maximum and minimum temperatures from Yahoo! Weather
- ↑ "Clean Air in your city". Environmental Defense. Archived from the original on August 13, 2007. Retrieved July 24, 2007.
- ↑ "Sunrise and sunset in Louisville - Kentucky - U.S.A". Timeanddate.com. Retrieved January 27, 2011.
- ↑ "Station Name: KY LOUISVILLE INTL AP". National Oceanic and Atmospheric Administration. Retrieved 2014-03-30.
- ↑ "WMO Climate Normals for LOUISVILLE/STANDIFORD FIELD KY 1961–1990". National Oceanic and Atmospheric Administration. Retrieved 2014-03-11.
Further reading
- Conkin, Barbara (2003). Why Are The Highlands High?: The Geology beneath the Landscapes of Jefferson County. Louisville, Kentucky: Hycliffe Publishing, LLC. ISBN 0-9674662-7-X.
External links
- Louisville/Jefferson County Information Consortium
- Metro Mapper - Interactive Maps for the Louisville Metro Area
- Historic Maps of Louisville/Jefferson County, Kentucky — University of Louisville Libraries
| History |
|  |
|---|---|---|
| Geography |
| |
| Government |
| |
| Transportation | ||
| Other subject areas | ||
| Top subjects | ||
| National Historic Landmarks | ||
| Prominent suburbs (over 10K pop.) | ||
| ||