Blackstrap (electoral district)
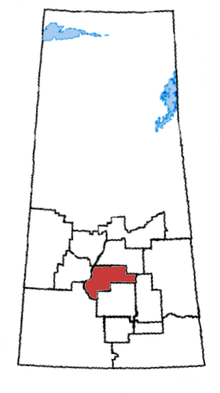 Blackstrap in relation to other Saskatchewan federal electoral districts | |
| Defunct federal electoral district | |
| Legislature | House of Commons |
| District created | 1996 |
| District abolished | 2013 |
| First contested | 1997 |
| Last contested | 2011 |
| District webpage | profile, map |
| Demographics | |
| Population (2011)[1] | 85,541 |
| Electors (2011) | 59,797 |
| Area (km²)[2] | 10,921.10 |
| Census divisions | Saskatoon |
| Census subdivisions | Saskatoon, Corman Park No. 344 |
Blackstrap was a federal electoral district in Saskatchewan, Canada, that had been represented in the Canadian House of Commons since 1997. It is named for Blackstrap Lake. The riding was abolished prior to the 2015 Canadian federal election.
Geography
The riding included the southeast quadrant of the city of Saskatoon and extended south to Elbow, southeast to Bladworth, and east to Jansen.
History
The electoral district was created in 1996 from Saskatoon—Dundurn and portions of Mackenzie, Moose Jaw—Lake Centre and Saskatoon—Humboldt ridings.
For the 2015 Canadian Federal election, the riding was abolished, with the Saskatoon portion becoming part of Saskatoon—Grasswood, while the rural portion became part of Moose Jaw—Lake Centre—Lanigan.
Members of Parliament
This riding has elected the following members of the House of Commons:
| Parliament | Years | Member | Party | |
|---|---|---|---|---|
| Blackstrap Riding created from Saskatoon—Dundurn, Mackenzie, Moose Jaw—Lake Centre and Saskatoon—Humboldt |
||||
| 36th | 1997–2000 | Allan Kerpan | Reform | |
| 2000–2000 | Alliance | |||
| 37th | 2000–2003 | Lynne Yelich | ||
| 2003–2004 | Conservative | |||
| 38th | 2004–2006 | |||
| 39th | 2006–2008 | |||
| 40th | 2008–2011 | |||
| 41st | 2011–2015 | |||
| Riding dissolved into Moose Jaw—Lake Centre—Lanigan, Saskatoon—Grasswood and Regina—Qu'Appelle |
||||
Election results
| Canadian federal election, 2011 | ||||||||
|---|---|---|---|---|---|---|---|---|
| Party | Candidate | Votes | % | ∆% | Expenditures | |||
| Conservative | Lynne Yelich | 23,281 | 54.4 | +0.5 | $66,677 | |||
| New Democratic | Darien Moore | 15,768 | 36.8 | +11.1 | $59,199 | |||
| Liberal | Deb Walker | 2,713 | 6.3 | -8.0 | $13,295 | |||
| Green | Shawn Setyo | 1,033 | 2.4 | -3.6 | $0 | |||
| Total valid votes/Expense limit | 42,795 | 100.0 | – | |||||
| Total rejected ballots | 113 | 0.3 | -0.1 | |||||
| Turnout | 42,908 | 70.6 | +6.0 | |||||
| Eligible voters | 60,641 | – | – | |||||
| Canadian federal election, 2008 | ||||||||
|---|---|---|---|---|---|---|---|---|
| Party | Candidate | Votes | % | ∆% | Expenditures | |||
| Conservative | Lynne Yelich | 20,747 | 53.9 | +6.0 | $68,414 | |||
| New Democratic | Patti Gieni | 9,876 | 25.7 | -4.9 | $30,120 | |||
| Liberal | Deb Ehmann | 5,509 | 14.3 | -2.6 | $24,743 | |||
| Green | Imre Pallagi | 2,325 | 6.0 | +2.8 | $3,352 | |||
| Total valid votes/Expense limit | 38,456 | 100.0 | $81,893 | |||||
| Total rejected ballots | 152 | 0.4 | +0.1 | |||||
| Turnout | 38,609 | 64.6 | -4 | |||||
| Canadian federal election, 2006 | ||||||||
|---|---|---|---|---|---|---|---|---|
| Party | Candidate | Votes | % | ∆% | Expenditures | |||
| Conservative | Lynne Yelich | 19,430 | 48.0 | +6.5 | $62,564 | |||
| New Democratic | Don Kossick | 12,376 | 30.6 | +7.0 | $41,367 | |||
| Liberal | Herta Barron | 6,841 | 16.9 | -14.5 | $25,287 | |||
| Green | Mike Fornssler | 1334 | 3.3 | +0.2 | $550 | |||
| Independent | D. Jay Krozser | 410 | 1.0 | – | $4,469 | |||
| Communist | Sonje Kristtorn | 96 | 0.2 | – | $515 | |||
| Total valid votes | 40,487 | 100.0 | – | |||||
| Total rejected ballots | 105 | 0.3 | 0.0 | |||||
| Turnout | 40,592 | 69 | +5 | |||||
| Canadian federal election, 2004 | ||||||||
|---|---|---|---|---|---|---|---|---|
| Party | Candidate | Votes | % | ∆% | Expenditures | |||
| Conservative | Lynne Yelich | 15,608 | 41.5 | +2.6 | $71,019 | |||
| Liberal | Tiffany Paulsen | 11,815 | 31.4 | +8.8 | $50,307 | |||
| New Democratic | Don Kossick | 8,862 | 23.6 | -2.8 | $51,849 | |||
| Green | Lynn Oliphant | 1,168 | 3.1 | +1.7 | $25 | |||
| Christian Heritage | Clayton Sundberg | 177 | 0.5 | – | – | |||
| Total valid votes | 37,630 | 100.0 | – | |||||
| Total rejected ballots | 98 | 0.3 | 0.0 | |||||
| Turnout | 37,728 | 64 | -2 | |||||
Note: Conservative vote is compared to the total of the Canadian Alliance vote and Progressive Conservative vote in 2000 election.
| Canadian federal election, 2000 | ||||||||
|---|---|---|---|---|---|---|---|---|
| Party | Candidate | Votes | % | ∆% | Expenditures | |||
| Alliance | Lynne Yelich | 16,028 | 44.2 | +7.4 | $40,528 | |||
| New Democratic | Noreen Johns | 9,551 | 26.4 | -1.3 | $43,141 | |||
| Liberal | J. Wayne Zimmer | 8,206 | 22.6 | -5.7 | $28,857 | |||
| Progressive Conservative | Tim Stephenson | 1,926 | 5.3 | -1.3 | $1,200 | |||
| Green | Neil Sinclair | 519 | 1.4 | – | $17 | |||
| Total valid votes | 36,230 | 100.0 | – | |||||
| Total rejected ballots | 93 | 0.3 | -0.1 | |||||
| Turnout | 36,323 | 66 | -4 | |||||
Note: Canadian Alliance vote is compared to the Reform vote in 1997 election.
| Canadian federal election, 1997 | ||||||||
|---|---|---|---|---|---|---|---|---|
| Party | Candidate | Votes | % | ∆% | Expenditures | |||
| Reform | Allan Kerpan | 13,502 | 36.9 | – | $31,124 | |||
| Liberal | Morris Bodnar | 10,365 | 28.3 | – | $48,752 | |||
| New Democratic | Steven Bobiash | 10,117 | 27.6 | – | $53,988 | |||
| Progressive Conservative | Bob Chisholm | 2,414 | 6.6 | – | $9,565 | |||
| Natural Law | Leon Laforge | 208 | 0.6 | – | $169 | |||
| Total valid votes | 36,606 | 100.0 | – | |||||
| Total rejected ballots | 138 | 0.4 | ||||||
| Turnout | 36,744 | 70 | ||||||
See also
References
- "(Code 47002) Census Profile". 2011 census. Statistics Canada. 2012. Retrieved 2011-03-03.
- Riding history for Blackstrap (1996– ) from the Library of Parliament
- Expenditures – 2008
- Expenditures – 2004
- Expenditures – 2000
- Expenditures – 1997
- Website of the Parliament of Canada
Notes
- ↑ Stastistics Canada: 2012
- ↑ Stastistics Canada: 2012
.png)