Balearic parliamentary election, 1987
| | |||||||||||||||||||||||||||||||||||||||||||||||||||||||||||||||||||
| |||||||||||||||||||||||||||||||||||||||||||||||||||||||||||||||||||
| |||||||||||||||||||||||||||||||||||||||||||||||||||||||||||||||||||
|
| |||||||||||||||||||||||||||||||||||||||||||||||||||||||||||||||||||
| Most voted party by district.
| |||||||||||||||||||||||||||||||||||||||||||||||||||||||||||||||||||
| |||||||||||||||||||||||||||||||||||||||||||||||||||||||||||||||||||
.jpg)


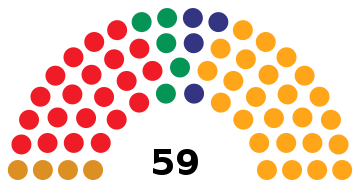
The 1987 Balearic parliamentary election was held on Sunday, 10 June 1987, to elect the 2nd Parliament of the Balearic Islands, the unicameral regional legislature of the Spanish autonomous community of the Balearic Islands. At stake were all 59 seats in the Parliament, determining the President of the Balearic Islands.
Results
Overall
 | ||||||
| Party | Popular vote | Seats | ||||
|---|---|---|---|---|---|---|
| Votes | % | ±pp | Won | +/− | ||
| People's Alliance–Liberal Party (AP–PL)[lower-alpha 1] | 123,130 | 36.71 | +1.13 | 25 | +4 | |
| Spanish Socialist Workers' Party (PSOE) | 108,910 | 32.47 | –2.24 | 21 | ±0 | |
| Democratic and Social Centre (CDS) | 34,146 | 10.18 | +8.05 | 5 | +5 | |
| Majorcan Union (UM) | 30,247 | 9.02 | –6.07 | 4 | –2 | |
| Nationalist Left (PSM–EN–EEM) | 20,750 | 6.19 | –0.47 | 4 | ±0 | ||
|---|---|---|---|---|---|---|---|
| Socialist Party of Majorca–Nationalist Agreement (PSM–EN) | 16,383 | 4.88 | –0.58 | 2 | ±0 | ||
| Left of Minorca Agreement (PSMe–EU) | 4,367 | 1.30 | +0.10 | 2 | ±0 | ||
| United Left (EU–IU)[lower-alpha 2] | 7,428 | 2.21 | –0.26 | 0 | ±0 | |
| People's Democratic Party (PDP) | 5,212 | 1.55 | New | 0 | ±0 |
| Parties with less than 1.0% of the vote | 2,033 | 0.61 | – | 0 | –2 | |
|---|---|---|---|---|---|---|
| Workers' Party of Spain–Communist Unity (PTE–UC) | 1,072 | 0.32 | New | 0 | ±0 | |
| Life and Autonomy (VIA) | 961 | 0.29 | New | 0 | ±0 | |
| Liberal Democratic Party (PDL) | N/A | N/A | –1.25 | 0 | –1 | |
| Minorcan Independent Candidacy (CIM) | N/A | N/A | –1.05 | 0 | –1 | |
| Blank ballots | 3,525 | 1.05 | +0.46 | |||
| Total | 335,381 | 100.00 | 59 | +5 | ||
| Valid votes | 335,381 | 98.77 | +0.31 | |||
| Invalid votes | 4,163 | 1.23 | –0.31 | |||
| Votes cast / turnout | 339,544 | 66.94 | +2.27 | |||
| Abstentions | 167,714 | 33.06 | –2.27 | |||
| Registered voters | 507,258 | |||||
| Source: Government of the Balearic Islands | ||||||
| ||||||
Results by district
Formentera
| Party | Popular vote | Seats | ||||
|---|---|---|---|---|---|---|
| Votes | % | ±pp | Won | +/− | ||
| Spanish Socialist Workers' Party (PSOE) | 1,156 | 46.78 | –2.31 | 1 | ±0 | |
| People's Alliance–Liberal Party (AP–PL)[lower-alpha 1] | 959 | 38.81 | –0.42 | 0 | ±0 | |
| Democratic and Social Centre (CDS) | 337 | 13.64 | New | 0 | ±0 | |
| Blank ballots | 19 | 0.77 | +0.58 | |||
| Total | 2,471 | 100.00 | 1 | ±0 | ||
| Valid votes | 2,471 | 99.12 | +0.50 | |||
| Invalid votes | 22 | 0.88 | –0.50 | |||
| Votes cast / turnout | 2,493 | 75.78 | +2.96 | |||
| Abstentions | 797 | 24.22 | –2.96 | |||
| Registered voters | 3,290 | |||||
| Source: Government of the Balearic Islands | ||||||
| ||||||
Ibiza
| Party | Popular vote | Seats | ||||
|---|---|---|---|---|---|---|
| Votes | % | ±pp | Won | +/− | ||
| People's Alliance–Liberal Party (AP–PL)[lower-alpha 1] | 14,289 | 53.35 | +1.88 | 7 | +1 | |
| Spanish Socialist Workers' Party (PSOE) | 9,296 | 34.71 | +4.04 | 4 | ±0 | |
| Democratic and Social Centre (CDS) | 2,049 | 7.65 | New | 1 | +1 | |
| United Left (EU–IU)[lower-alpha 2] | 879 | 3.28 | –0.44 | 0 | ±0 | |
| Liberal Democratic Party (PDL) | N/A | N/A | –14.62 | 0 | –1 | |
| Blank ballots | 269 | 1.00 | +0.60 | |||
| Total | 26,782 | 100.00 | 12 | +1 | ||
| Valid votes | 26,782 | 99.04 | +0.21 | |||
| Invalid votes | 260 | 0.96 | –0.21 | |||
| Votes cast / turnout | 27,042 | 58.50 | –0.01 | |||
| Abstentions | 19,186 | 41.50 | +0.01 | |||
| Registered voters | 46,288 | |||||
| Source: Government of the Balearic Islands | ||||||
| ||||||
Majorca
| Party | Popular vote | Seats | ||||
|---|---|---|---|---|---|---|
| Votes | % | ±pp | Won | +/− | ||
| People's Alliance–Liberal Party (AP–PL)[lower-alpha 1] | 96,470 | 34.85 | +0.53 | 13 | +2 | |
| Spanish Socialist Workers' Party (PSOE) | 87,986 | 31.79 | –2.87 | 11 | ±0 | |
| Majorcan Union (UM) | 30,247 | 10.93 | –7.39 | 4 | –2 | |
| Democratic and Social Centre (CDS) | 29,028 | 10.49 | +8.11 | 3 | +3 | |
| Socialist Party of Majorca–Nationalist Agreement (PSM–EN) | 16,383 | 5.92 | –0.71 | 2 | ±0 | |
| United Left (EU–IU)[lower-alpha 2] | 6,549 | 2.37 | –0.18 | 0 | ±0 | |
| People's Democratic Party (PDP) | 5,212 | 1.88 | New | 0 | ±0 | |
| Workers' Party of Spain–Communist Unity (PTE–UC) | 1,072 | 0.39 | New | 0 | ±0 | |
| Life and Autonomy (VIA) | 961 | 0.35 | New | 0 | ±0 | |
| Blank ballots | 2,883 | 1.04 | +0.48 | |||
| Total | 276,791 | 100.00 | 33 | +3 | ||
| Valid votes | 276,791 | 98.73 | +0.31 | |||
| Invalid votes | 3,554 | 1.27 | –0.31 | |||
| Votes cast / turnout | 280,345 | 67.76 | +2.71 | |||
| Abstentions | 133,411 | 32.24 | –2.71 | |||
| Registered voters | 413,756 | |||||
| Source: Government of the Balearic Islands | ||||||
| ||||||
Minorca
| Party | Popular vote | Seats | ||||
|---|---|---|---|---|---|---|
| Votes | % | ±pp | Won | +/− | ||
| People's Alliance–Liberal Party (AP–PL)[lower-alpha 1] | 11,412 | 38.90 | +6.24 | 5 | +1 | |
| Spanish Socialist Workers' Party (PSOE) | 10,472 | 35.70 | –2.01 | 5 | ±0 | |
| Left of Minorca Agreement (PSMe–EU) | 4,367 | 14.89 | +1.41 | 2 | ±0 | |
| Democratic and Social Centre (CDS) | 2,732 | 9.31 | +7.47 | 1 | +1 | |
| Minorcan Independent Candidacy (CIM) | N/A | N/A | –11.74 | 0 | –1 | |
| Blank ballots | 354 | 1.21 | +0.21 | |||
| Total | 29,337 | 100.00 | 13 | +1 | ||
| Valid votes | 29,337 | 98.90 | +0.51 | |||
| Invalid votes | 327 | 1.10 | –0.51 | |||
| Votes cast / turnout | 29,664 | 67.44 | +0.63 | |||
| Abstentions | 14,320 | 32.56 | –0.63 | |||
| Registered voters | 43,984 | |||||
| Source: Government of the Balearic Islands | ||||||
| ||||||
Post-election
Investiture vote
| Candidate: Gabriel Cañellas | |||
|---|---|---|---|
| Choice | Vote | ||
| Parties | Votes | ||
| Yes | AP–PL (25), UM (4) | 29 / 59 | |
| No | PSOE (21), PSM (2), PSMe–EU (2) | 25 / 59 | |
| Abstentions | CDS (5) | 5 / 59 | |
| Source: Historia Electoral | |||
| Candidate: Gabriel Cañellas | |||
|---|---|---|---|
| Choice | Vote | ||
| Parties | Votes | ||
| |
AP–PL (25), UM (4) | 29 / 59 | |
| No | PSOE (21), PSM (2), PSMe–EU (2) | 25 / 59 | |
| Abstentions | CDS (5) | 5 / 59 | |
| Source: Historia Electoral | |||
References
| Parliamentary elections | |
|---|---|
| General elections | |
This article is issued from Wikipedia - version of the 11/21/2016. The text is available under the Creative Commons Attribution/Share Alike but additional terms may apply for the media files.