Thurrock (UK Parliament constituency)
| Thurrock | |
|---|---|
|
Borough constituency for the House of Commons | |
|
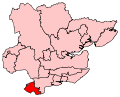
Boundary of Thurrock in Essex. | |
|
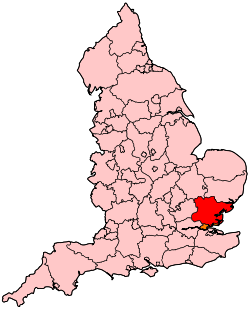
Location of Essex within England. | |
| County | Essex |
| Electorate | 77,667 (December 2010)[1] |
| Major settlements | Grays, Tilbury, South Ockendon and Chafford |
| Current constituency | |
| Created | 1945 |
| Member of parliament | Jackie Doyle-Price (Conservative) |
| Number of members | One |
| Overlaps | |
| European Parliament constituency | East of England |
Thurrock is a constituency[n 1] represented in the House of Commons of the UK Parliament since 2010 by Jackie Doyle-Price, a Conservative.[n 2]
Boundaries

1945-1983: The Urban District of Thurrock.
1983-2010: The Borough of Thurrock wards of Aveley, Belhus, Chadwell St Mary, East Tilbury, Grays Thurrock North, Grays Thurrock Town, Little Thurrock, Ockendon, Stifford, Tilbury, and West Thurrock.
2010-present: The Borough of Thurrock wards of Aveley and Uplands, Belhus, Chadwell St Mary, Chafford and North Stifford, Grays Riverside, Grays Thurrock, Little Thurrock Blackshots, Little Thurrock Rectory, Ockendon, South Chafford, Stifford Clays, Tilbury Riverside and Thurrock Park, Tilbury St Chads, West Thurrock, and South Stifford.
History
- Political history
Thurrock was for 38 years from 1945 a safe Labour seat, at which time it saw a relatively marginal majority of fewer than 2000 votes, and four years later a Conservative gained it in 1987 with a slim majority and held it for one Parliament before it was regained by Labour, namely Andrew MacKinlay, who was during his tenure as MP criticised for his questioning technique used of weapons expert Dr. David Kelly.
In the 2010 general election, a Conservative gained the seat, with Jackie Doyle-Price being elected as the MP with a majority of only 92 votes, the third most marginal in that election behind the lowest majority of 4 votes in Fermanagh and South Tyrone and the majority of 54 won by her party colleague Dan Byles. The seat has bellwether outcome status since 1997.
- Prominent frontbenchers
Dr Oonagh McDonald was Opposition Spokesman on Defence from 1981–1983, and then Opposition Spokesman on Treasury and Economic Affairs from 1983–1987.
Constituency profile
The seat has seen considerable settlement growth since 1989 when housing projects marking the start of a phase of development, dovetailing with the Thames Gateway initiative, began – see Chafford Hundred in the seat, for example. Retail and distribution are major areas of West Thurrock which contains Lakeside Shopping Centre.
Workless claimants, registered jobseekers, were in November 2012 higher than the national average of 3.8%, at 4.8% of the population based on a statistical compilation by The Guardian. The regional average for the Eastern England region was considerably lower, at 3.2% of the population.[2]
Members of Parliament
Elections
Elections in the 2010s
Thurrock is a unique 3-way ultra-marginal seat, the Conservatives will need to defend against UKIP and Labour to hold it. It is number 1 on UKIP's 2020 target list, the party only needs a 0.98% swing to win the seat from third place.[4] The constituency is also at number 7 on Labour's target list, with a 0.54% swing needed for their candidate to gain.[5]
At the 2015 general election the already-marginal seat became a 3-way contest, less than 1,000 votes separated the top three candidates. The fourth-placed Liberal Democrats returned less than 1,000 votes and lost their deposit.
| Party | Candidate | Votes | % | ± | |
|---|---|---|---|---|---|
| Conservative | Jackie Doyle-Price | 16,692 | 33.7 | −3.1 | |
| Labour | Polly Billington[8] | 16,156 | 32.6 | −4.0 | |
| UKIP | Tim Aker[9] | 15,718 | 31.7 | +24.3 | |
| Liberal Democrat | Rhodri Jamieson-Ball | 644 | 1.3 | −9.4 | |
| CISTA | Jamie Barnes | 244 | 0.5 | N/A | |
| Independent | Daniel Munyambu | 79 | 0.2 | N/A | |
| All People's Party | Aba Kristilolu | 31 | 0.1 | N/A | |
| Majority | 536 | 1.1 | |||
| Turnout | 49,564 | 63.9 | |||
| Conservative hold | Swing | 0.4 | |||
| Party | Candidate | Votes | % | ± | |
|---|---|---|---|---|---|
| Conservative | Jackie Doyle-Price | 16,869 | 36.8 | +3.6 | |
| Labour | Carl Morris | 16,777 | 36.6 | −9.6 | |
| Liberal Democrat | Carys Davis | 4,901 | 10.7 | −0.4 | |
| BNP | Emma Colgate | 3,618 | 7.9 | +2.1 | |
| UKIP | Clive Broad | 3,390 | 7.4 | +4.0 | |
| Christian Peoples | Arinola Araba | 267 | 0.6 | N/A | |
| Majority | 92 | 0.2 | |||
| Turnout | 45,822 | 59.1 | +4.2 | ||
| Conservative gain from Labour | Swing | +6.6 | |||
Elections in the 2000s
| Party | Candidate | Votes | % | ± | |
|---|---|---|---|---|---|
| Labour | Andrew MacKinlay | 20,636 | 47.2 | −9.3 | |
| Conservative | Garry Paul Hague | 14,261 | 32.6 | +2.8 | |
| Liberal Democrat | Earnshaw Desmond Palmer | 4,770 | 10.9 | +0.6 | |
| BNP | Nick Geri | 2,526 | 5.8 | N/A | |
| UKIP | Carol Jackson | 1,499 | 3.4 | 0.0 | |
| Majority | 6,375 | 14.6 | |||
| Turnout | 43,692 | 54.9 | 5.9 | ||
| Labour hold | Swing | −6.1 | |||
| Party | Candidate | Votes | % | ± | |
|---|---|---|---|---|---|
| Labour | Andrew MacKinlay | 21,121 | 56.5 | −6.8 | |
| Conservative | Mike Penning | 11,124 | 29.8 | +3.0 | |
| Liberal Democrat | John Lathan | 3,846 | 10.3 | +2.2 | |
| UKIP | Christopher Sheppard | 1,271 | 3.4 | +1.6 | |
| Majority | 9,997 | 26.7 | |||
| Turnout | 37,362 | 49.0 | −16.7 | ||
| Labour hold | Swing | ||||
Elections in the 1990s
| Party | Candidate | Votes | % | ± | |
|---|---|---|---|---|---|
| Labour | Andrew MacKinlay | 29,896 | 63.3 | +17.8 | |
| Conservative | Andrew Rosindell | 12,640 | 26.8 | -16.9 | |
| Liberal Democrat | Joe White | 3,843 | 8.1 | -1.4 | |
| UKIP | Peter Compobassi | 833 | 1.8 | N/A | |
| Majority | 17,256 | 36.55 | |||
| Turnout | 47,212 | 65.79 | |||
| Labour hold | Swing | +17.2 | |||
| Party | Candidate | Votes | % | ± | |
|---|---|---|---|---|---|
| Labour | Andrew MacKinlay | 24,791 | 45.9 | +4.8 | |
| Conservative | Tim Janman | 23,619 | 43.7 | +1.2 | |
| Liberal Democrat | Alan J. Banton | 5,145 | 9.5 | −7.0 | |
| Pensioners' Party | Charles Rogers | 391 | 0.7 | N/A | |
| Anti-Federalist League | Peter Compobassi | 117 | 0.2 | N/A | |
| Majority | 1,172 | 2.2 | +0.7 | ||
| Turnout | 54,063 | 78.1 | +6.6 | ||
| Labour gain from Conservative | Swing | +1.8 | |||
Elections in the 1980s
| Party | Candidate | Votes | % | ± | |
|---|---|---|---|---|---|
| Conservative | Tim Janman | 20,527 | 42.5 | ||
| Labour | Oonagh McDonald | 19,837 | 41.0 | ||
| Social Democratic | Donald S. Benson | 7,970 | 16.5 | ||
| Majority | 690 | 1.43 | |||
| Turnout | 48,334 | 71.5 | |||
| Conservative gain from Labour | Swing | ||||
| Party | Candidate | Votes | % | ± | |
|---|---|---|---|---|---|
| Labour | Oonagh McDonald | 17,600 | 39.21 | ||
| Conservative | T Jallon | 15,878 | 35.37 | ||
| SDP–Liberal Alliance | D Benson | 9,761 | 21.74 | ||
| Independent | M Bibby | 1,200 | 2.67 | ||
| BNP | R Sinclair | 252 | 0.6 | ||
| Communist | J Paul | 199 | 0.4 | ||
| Majority | 1,722 | 3.8 | |||
| Turnout | 44,891 | 67.7 | |||
| Labour hold | Swing | ||||
Elections in the 1970s
| Party | Candidate | Votes | % | ± | |
|---|---|---|---|---|---|
| Labour | Oonagh McDonald | 33,449 | 48.55 | ||
| Conservative | Anthony Baldry | 27,030 | 39.24 | ||
| Liberal | M Crowson | 6,445 | 9.36 | ||
| National Front | E Burdett | 1,358 | 1.97 | ||
| Independent | B Chattaway | 365 | 0.53 | ||
| Workers Revolutionary | M Daly | 242 | 0.35 | ||
| Majority | 6,419 | 9.32 | |||
| Turnout | 68,884 | 75.11 | |||
| Labour hold | Swing | ||||
| Party | Candidate | Votes | % | ± | |
|---|---|---|---|---|---|
| Labour | Oonagh McDonald | 22,191 | 45.27 | -10.30 | |
| Conservative | Percy Lomax | 17,352 | 35.39 | +10.95 | |
| Liberal | Anthony Charlton | 5,977 | 12.19 | -7.80 | |
| National Front | John Roberts | 3,255 | 6.64 | N/A | |
| English National | Frank Hansford-Miller | 187 | 0.38 | N/A | |
| World Grid Sunshine Room Party | Peter Bishop | 72 | 0.15 | N/A | |
| Majority | 4,839 | 9.88 | |||
| Turnout | 49,034 | ||||
| Labour hold | Swing | ||||
| Party | Candidate | Votes | % | ± | |
|---|---|---|---|---|---|
| Labour | Hugh James Delargy | 34,066 | 55.57 | ||
| Conservative | P Lomax | 14,986 | 24.44 | ||
| Liberal | A Charlton | 12,255 | 19.99 | ||
| Majority | 19,080 | 31.12 | |||
| Turnout | 68.54 | ||||
| Labour hold | Swing | ||||
| Party | Candidate | Votes | % | ± | |
|---|---|---|---|---|---|
| Labour | Hugh James Delargy | 36,217 | 52.15 | ||
| Conservative | Graham Frank James Bright | 17,699 | 25.48 | ||
| Liberal | Miss Kaye Fleetwood | 15,534 | 22.37 | ||
| Majority | 18,518 | 26.66 | |||
| Turnout | 78.41 | ||||
| Labour hold | Swing | ||||
| Party | Candidate | Votes | % | ± | |
|---|---|---|---|---|---|
| Labour | Hugh James Delargy | 30,874 | 55.75 | ||
| Conservative | Graham Frank James Bright | 19,486 | 35.18 | ||
| Liberal | Miss Kaye Fleetwood | 5,024 | 9.07 | ||
| Majority | 11,388 | 20.56 | |||
| Turnout | 55,384 | 65.67 | |||
| Labour hold | Swing | ||||
Elections in the 1960s
| Party | Candidate | Votes | % | ± | |
|---|---|---|---|---|---|
| Labour | Hugh James Delargy | 31,998 | 60.67 | ||
| Conservative | Cedric J Hodgson | 14,094 | 26.72 | ||
| Liberal | James C Moran | 6,648 | 12.61 | ||
| Majority | 17,904 | 33.95 | |||
| Turnout | 72.74 | ||||
| Labour hold | Swing | ||||
| Party | Candidate | Votes | % | ± | |
|---|---|---|---|---|---|
| Labour | Hugh James Delargy | 30,372 | 57.22 | ||
| Conservative | Robert Arthur McCrindle | 14,615 | 27.53 | ||
| Liberal | A Noel H Blackburn | 8,094 | 15.25 | ||
| Majority | 15,757 | 29.68 | |||
| Turnout | 53,081 | 74.22 | |||
| Labour hold | Swing | ||||
Elections in the 1950s
| Party | Candidate | Votes | % | ± | |
|---|---|---|---|---|---|
| Labour | Hugh James Delargy | 32,270 | 61.52 | ||
| Conservative | William E McNamara | 20,188 | 38.48 | ||
| Majority | 12,082 | 23.03 | |||
| Turnout | 52,458 | 78.23 | |||
| Labour hold | Swing | ||||
| Party | Candidate | Votes | % | ± | |
|---|---|---|---|---|---|
| Labour | Hugh James Delargy | 31,375 | 66.16 | ||
| Conservative | Gerald A Petty | 16,046 | 33.84 | ||
| Majority | 15,329 | 32.33 | |||
| Turnout | 75.24 | ||||
| Labour hold | Swing | ||||
| Party | Candidate | Votes | % | ± | |
|---|---|---|---|---|---|
| Labour | Hugh James Delargy | 28,851 | 65.55 | ||
| Conservative | Godfrey William Lagden | 15,166 | 34.45 | ||
| Majority | 13,685 | 31.09 | |||
| Turnout | 82.81 | ||||
| Labour hold | Swing | ||||
| Party | Candidate | Votes | % | ± | |
|---|---|---|---|---|---|
| Labour | Hugh James Delargy | 22,893 | 52.68 | ||
| Conservative | Airey Neave | 13,306 | 30.62 | ||
| Independent Labour | Leslie Solley | 4,250 | 9.78 | ||
| Liberal | William Harold Henry Siddons | 3,010 | 6.93 | ||
| Majority | 9,587 | 22.06 | |||
| Turnout | 85.28 | ||||
| Labour hold | Swing | ||||
Election in the 1940s
| Party | Candidate | Votes | % | ± | |
|---|---|---|---|---|---|
| Labour | Leslie Solley | 23,171 | 70.05 | ||
| Conservative | T Adam | 9,909 | 29.95 | ||
| Majority | 13,262 | 40.09 | |||
| Turnout | 76.89 | ||||
| Labour hold | Swing | ||||
See also
Notes
- ↑ A county constituency (for the purposes of election expenses and type of returning officer)
- ↑ As with all constituencies, the constituency elects one Member of Parliament (MP) by the first past the post system of election at least every five years.
References
- ↑ "Electorate Figures – Boundary Commission for England". 2011 Electorate Figures. Boundary Commission for England. 4 March 2011. Retrieved 13 March 2011.
- ↑ Unemployment claimants by constituency The Guardian
- ↑ Leigh Rayment's Historical List of MPs – Constituencies beginning with "T" (part 1)
- ↑
- ↑
- ↑ "Election Data 2015". Electoral Calculus. Archived from the original on 17 October 2015. Retrieved 17 October 2015.
- ↑ "Thurrock". bbc.co.uk.
- ↑ "The Labour Party". labour.org.uk.
- ↑ "Tim Aker announced as UKIP candidate for Thurrock". Your Thurrock. Retrieved 2014-02-20.
- ↑ "Election Data 2010". Electoral Calculus. Archived from the original on 26 July 2013. Retrieved 17 October 2015.
- ↑ "BBC NEWS – Election 2010 – Thurrock". BBC News.
- ↑ "Election Data 2005". Electoral Calculus. Archived from the original on 15 October 2011. Retrieved 18 October 2015.
- ↑ "Election Data 2001". Electoral Calculus. Archived from the original on 15 October 2011. Retrieved 18 October 2015.
- ↑ "Election Data 1997". Electoral Calculus. Archived from the original on 15 October 2011. Retrieved 18 October 2015.
- ↑ "Election Data 1992". Electoral Calculus. Archived from the original on 15 October 2011. Retrieved 18 October 2015.
- ↑ "UK General Election results April 1992". Richard Kimber's Political Science Resources. Politics Resources. 9 April 1992. Retrieved 6 December 2010.
- ↑ "Election Data 1987". Electoral Calculus. Archived from the original on 15 October 2011. Retrieved 18 October 2015.
- ↑ "Election Data 1983". Electoral Calculus. Archived from the original on 15 October 2011. Retrieved 18 October 2015.
- ↑ "UK General Election results: June 1983 [Archive]". politicsresources.net.
- ↑ "UK General Election results: May 1979 [Archive]". politicsresources.net.
Coordinates: 51°29′N 0°19′E / 51.48°N 0.32°E