Matawinie Regional County Municipality
| Matawinie | |
|---|---|
| Regional county municipality | |
 | |
| Coordinates: 46°16′N 73°47′W / 46.267°N 73.783°WCoordinates: 46°16′N 73°47′W / 46.267°N 73.783°W[1] | |
| Country |
|
| Province |
|
| Region | Lanaudière |
| Effective | January 1, 1982 |
| County seat | Rawdon |
| Government[2] | |
| • Type | Prefecture |
| • Prefect | Gaétan Morin |
| Area[2][3] | |
| • Total | 10,430.00 km2 (4,027.05 sq mi) |
| • Land | 9,527.58 km2 (3,678.62 sq mi) |
| Population (2011)[3] | |
| • Total | 49,516 |
| • Density | 5.2/km2 (13/sq mi) |
| • Pop 2006-2011 |
|
| • Dwellings | 34,229 |
| Time zone | EST (UTC−5) |
| • Summer (DST) | EDT (UTC−4) |
| Area code(s) | 450 and 579 |
| Website |
www |
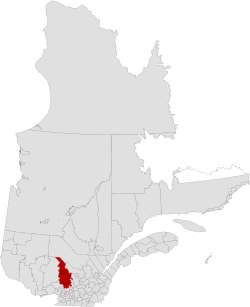
Matawinie is a regional county municipality in the region of Lanaudière in southwestern Quebec, Canada. Its seat is Rawdon. The population according to the Canada 2011 Census is 49,516.[3]
Subdivisions
There are 27 subdivisions within the RCM:[2]
|
|
|
Demographics
Population
| Canada census – Matawinie Regional County Municipality community profile | |||
|---|---|---|---|
| 2011 | 2006 | 2001 | |
| Population: | 49,516 (-0.4% from 2006) | 49,717 (+15.4% from 2001) | 43,177 (+4.5% from 1996) |
| Land area: | 9,527.58 km2 (3,678.62 sq mi) | 9,520.43 km2 (3,675.86 sq mi) | 9,667.31 km2 (3,732.57 sq mi) |
| Population density: | 5.2/km2 (13/sq mi) | 5.2/km2 (13/sq mi) | 4.5/km2 (12/sq mi) |
| Median age: | 49.4 (M: 49.3, F: 49.4) | 46.8 (M: 46.7, F: 46.8) | 44.1 (M: 44.0, F: 44.2) |
| Total private dwellings: | 34,229 | 33,240 | 31,868 |
| Median household income: | $43,708 | $39,569 | $32,697 |
| References: 2011[3] 2006[4] 2001[5] | |||
| Historical Census Data - Matawinie Regional County Municipality, Quebec[6] | ||||||||||||||||||||||||||||||||
|---|---|---|---|---|---|---|---|---|---|---|---|---|---|---|---|---|---|---|---|---|---|---|---|---|---|---|---|---|---|---|---|---|
|
|
| ||||||||||||||||||||||||||||||
Language
| Canada Census Mother Tongue - Matawinie Regional County Municipality, Quebec[6] | ||||||||||||||||||
|---|---|---|---|---|---|---|---|---|---|---|---|---|---|---|---|---|---|---|
| Census | Total | French |
English |
French & English |
Other | |||||||||||||
| Year | Responses | Count | Trend | Pop % | Count | Trend | Pop % | Count | Trend | Pop % | Count | Trend | Pop % | |||||
| 2011 |
49,055 |
43,990 | |
89.67% | 1,975 | |
4.03% | 315 | |
0.64% | 2,775 | |
5.66% | |||||
| 2006 |
49,250 |
44,490 | |
90.33% | 1,590 | |
3.23% | 255 | |
0.52% | 2,915 | |
5.92% | |||||
| 2001 |
42,605 |
38,270 | |
89.83% | 1,800 | |
4.22% | 270 | |
0.63% | 2,265 | |
5.32% | |||||
| 1996 |
40,710 |
36,495 | n/a | 89.65% | 2,025 | n/a | 4.97% | 290 | n/a | 0.71% | 1,900 | n/a | 4.67% | |||||
Transportation
Access Routes
Highways and numbered routes that run through the municipality, including external routes that start or finish at the county border:[7]
|
|
See also
References
- ↑ Reference number 141056 of the Commission de toponymie du Québec (French)
- 1 2 3 Geographic code 620 in the official Répertoire des municipalités (French)
- 1 2 3 4 "2011 Community Profiles". Canada 2011 Census. Statistics Canada. July 5, 2013. Retrieved 2014-03-01.
- ↑ "2006 Community Profiles". Canada 2006 Census. Statistics Canada. March 30, 2011. Retrieved 2014-03-01.
- ↑ "2001 Community Profiles". Canada 2001 Census. Statistics Canada. February 17, 2012. Retrieved 2014-03-01.
- 1 2 Statistics Canada: 1996, 2001, 2006, 2011 census
- ↑ Official Transport Quebec Road Map
External links
 |
La Tuque TE | Mékinac RCM | | |
| Antoine-Labelle RCM | |
Maskinongé RCM | ||
| ||||
| | ||||
| Les Laurentides RCM Les Pays-d'en-Haut RCM |
La Rivière-du-Nord RCM / Montcalm RCM / Joliette RCM | D'Autray RCM |
| Regional county municipalities and equivalent territories | |
|---|---|
| Municipalities | |
This article is issued from Wikipedia - version of the 4/13/2014. The text is available under the Creative Commons Attribution/Share Alike but additional terms may apply for the media files.