Income in the United Kingdom
In terms of global poverty criteria, the United Kingdom is a wealthy country, with virtually no people living on less than £10 a day. In 2012-13, median income was approximately £21,000 a year but varies considerably by age, location, data source, occupation and gender.[1] There is both significant income redistribution and income inequality; for instance, in 2013/14 income in the top and bottom fifth of households was £80,800 and £5,500, respectively, before taxes and benefits (15:1). After tax and benefits, household income disparities are significantly reduced to £60,000 and £15,500 (4:1).[2]
The UK Gini coefficient for 2013/14 estimated at 0.34.[3] There were 720,000 net worth Sterling millionaires in the United Kingdom in 2015 (1 in 65 adults).[4]
Data sources
There are a number of different sources of data on income which results in different estimates of income due to different sample sizes, population types (e.g. whether the population sample includes the self-employed, pensioners, individuals not liable to tax), definitions of income (e.g. gross earnings vs original income vs gross income vs net income vs post tax income).[5]
The Survey of Personal Incomes (SPI) is a dataset from HM Revenue and Customs (HMRC) based on individuals who could be liable to tax. HMRC does not hold information on individuals whose income is below the personal allowance (£8,105 in 2012/13).[6] Furthermore, SPI does not include income from non taxable benefits such as housing benefits or job seekers allowance.[1][5]
The Annual Survey of Hours and Earnings (ASHE) is a dataset from an annual survey of approximately 50,000 businesses by the Office for National Statistics (ONS) and covers annual earnings, public and private sector pay differential and the gender pay gap. ASHE does not cover individuals who are self-employed.[5][7]
The Households Below Average Income (HBAI) dataset is based on the Family Resources Survey (FRS) from the Department for Work and Pensions (DWP). It includes information on equalised household disposable income and can be used to represent the distribution of household income and income inequality (Gini coefficient).[3][5]
Other data sources include Average Weekly Earnings, Labour Force Survey, Index of Labour Cost per Hour, Unit Labour Costs, Effects of Taxes and Benefits on Household Income / Living Costs and Food Survey, European Union Statistics on Income and Living Conditions, Pensioners Income Series, Wealth and Assets Survey, National Accounts Estimates of Gross Disposable Household Income, and Small Area Income Estimates.[5]
Taxable income

The most recent SPI report (2012/13) gave annual median income as £21,000 before tax and £18,700 after tax.[1] The 2013/14 HBAI report gave median household income (2 adults) as £23,556.[3] The provisional results from the April 2014 ASHE report gives median gross annual earnings of £22,044 for all employees and £27,195 for full-time employees.[7]
According to the OECD the average household net-adjusted disposable income per capita is $27,029 a year (in USD, ranked 14/36 OECD countries), the average household net financial wealth per capita is estimated at $60,778 (in USD, ranked 8/36), and the average net-adjusted disposable income of the top 20% of the population is an estimated $57,010 a year, whereas the bottom 20% live on an estimated $10,195 a year giving a ratio of 5.6 (in USD, ranked 25/36).[8]
The 2013/14 HBAI reported that 15% of people had a relative low income (below 60% of median threshold) before housing costs.[3]
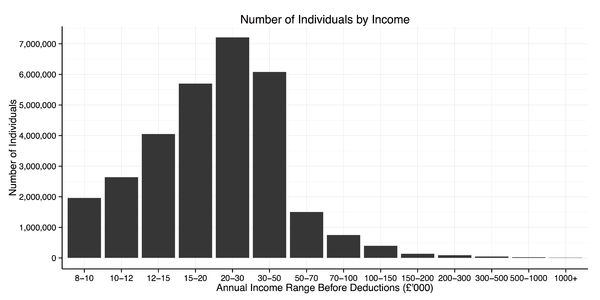
Data from HMRC 2012-13; incomes are before tax for individuals. The personal allowance or income tax threshold was £8,105 (people with incomes below this level did not pay income tax).[6]
Income by location

Income can vary considerably by location. For example, the locations (local administrative unit) with the highest incomes were the City of London, Kensington and Chelsea, and Westminster with median annual incomes of £58,300, £37,800 and £35,200 respectively. The locations with the lowest incomes were Hyndburn, Torbay, and West Somerset with median annual incomes of £17,000, £16,900 and £16,000 respectively.
Income by age and gender
Data from the Survey of Personal Incomes 2012/13.

Income by occupation
The tables below shows the ten highest and ten lowest paid occupations in the UK respectively, as at April 2014.[9]
| Occupation | Median full-time gross weekly pay (£) |
|---|---|
| Aircraft pilots and flight engineers | 1,746.6 |
| Air traffic controllers | 1,549.4 |
| Chief executives and senior officials | 1,533.3 |
| Marketing and sales directors | 1,298.7 |
| Advertising and public relations directors | 1,289.5 |
| Information technology and telecommunications directors | 1,226.7 |
| Legal professionals (not included elsewhere) | 1,217.3 |
| Medical practitioners | 1,167.1 |
| Brokers | 1,149.9 |
| Financial managers and directors | 1,143.0 |
| Occupation | Median full-time gross weekly pay (£) |
|---|---|
| Cleaners and domestics | 285.5 |
| Nursery nurses and assistants | 285.2 |
| Other elementary services occupations (not included elsewhere) | 279.9 |
| Retail cashiers and check-out operators | 278.7 |
| Leisure and theme park attendants | 272.7 |
| Kitchen and catering assistants | 268.4 |
| Hairdressers and barbers | 267.8 |
| Launderers, dry cleaners and pressers | 259.3 |
| Waiters and waitresses | 257.6 |
| Bar staff | 253.6 |
Post tax household income

Data from the Households Below Average Income (HBAI) report from the Department of Work and Pensions 2013/14:

Data from HMRC – Percentile points of the income distribution as estimated from the Survey of Personal Incomes, note this only includes individuals who pay some income tax:

Wealth
The net worth information is based on data from HMRC for 2004–2005[10] and includes marketable assets including house equity, cash, shares, bonds and investment trusts. These values do not include personal possessions.
| Percentile point | Wealth to qualify | Percentage of total wealth owned by people at and above this level |
|---|---|---|
| Top 1% | £688,228 | 21% of total UK wealth |
| 2% | £460,179 | 28% of total UK wealth |
| 5% | £270,164 | 40% of total UK wealth |
| 10% | £176,221 | 53% of total UK wealth |
| 25% | £76,098 | 72% of total UK wealth |
| 50% | £35,807 | 93% of total UK wealth |
High income
The Institute for Fiscal Studies issued a report on the UK's highest earners in January 2008. There are 42 million adults in the UK of whom 29 million are income tax payers. (The remainder are pensioners, students, homemakers, the unemployed, those earning under the personal allowance, and other unwaged.) A summary of key findings is shown in the table below:
| All taxpayers | Top 10% to 1% (adults) | Top 1% to 0.1% (adults) | Top 0.1% (adults) | |
|---|---|---|---|---|
| Number | 29.5 million | 4.21 million | 421,000 | 42,000 |
| Entry level for group | £5,093 | £35,345 | £99,727 | £351,137 |
| Mean value for group | £24,769 | £49,960 | £155,832 | £780,043 |
| Average income tax paid | £4,415 | £10,550 | £49,477 | £274,482 |
| Percentage of national personal income | 100% | 27.6% | 8.6% | 4.2% |
The top 0.1% are 90% male and 50% of these people are in the 45 to 54 year age group. 31% of these people live in London and 21% in South East England. 33% of these people are company directors (as reported to HMRC). 30% work in finance and 38% in general business (includes law). The very richest rely on earnings (salary and bonuses) for 58% of income. Income from self-employment (such as partnerships in law or accountancy firms) accounts for 23% of income and about 18% from investment income (interest and share dividends).
Sources of income
The Family Resources Survey is a document produced by the Department for Work and Pensions. This details income amongst a representative sample of the British population. This report tabulates sources of income as a percentage of total income.[11]
| Region | Employment (salaries & wages) | Self employed | Investment income | Working tax credit | State pensions | Occupational pensions | Disability benefits | Other social security benefits | Other income sources |
|---|---|---|---|---|---|---|---|---|---|
| UK | 64% | 11% | 2% | 1% | 6% | 7% | 2% | 5% | 2% |
| Northern Ireland | 60% | 11% | 1% | 2% | 7% | 5% | 4% | 7% | 3% |
| Scotland | 66% | 7% | 2% | 2% | 7% | 7% | 3% | 5% | 2% |
| Wales | 60% | 8% | 2% | 2% | 8% | 8% | 4% | 6% | 1% |
| England | 64% | 11% | 2% | 1% | 6% | 7% | 2% | 5% | 2% |
| North East England | 64% | 5% | 2% | 2% | 8% | 6% | 4% | 7% | 2% |
| North West England | 59% | 13% | 2% | 2% | 7% | 7% | 3% | 6% | 2% |
| Yorkshire | 64% | 7% | 2% | 2% | 7% | 7% | 2% | 5% | 3% |
| East Midlands | 65% | 9% | 2% | 1% | 7% | 6% | 2% | 5% | 3% |
| West Midlands | 62% | 8% | 3% | 2% | 8% | 6% | 2% | 5% | 3% |
| Eastern England | 56% | 22% | 2% | 1% | 5% | 7% | 1% | 3% | 2% |
| London | 71% | 10% | 2% | 1% | 4% | 4% | 1% | 5% | 3% |
| South East | 66% | 9% | 4% | 1% | 7% | 8% | 1% | 4% | 2% |
| South West England | 60% | 9% | 4% | 1% | 7% | 10% | 2% | 4% | 2% |
Other social security benefits include: Housing Benefit, Income Support and Jobseeker's Allowance
See also
- Poverty in the United Kingdom
- Taxation in the United Kingdom
- Pension provision in the United Kingdom
- United Kingdom labour law
References
- 1 2 3 "Personal income by tax year". HM Revenue and Customs. 2014-01-31. Retrieved 2015-09-15.
- ↑ "The Effects of Taxes and Benefits on Household Income, Financial Year Ending 2014". Office for National Statistics. 2015-06-29. Retrieved 2015-09-15.
- 1 2 3 4 "Households below average income (HBAI) statistics". Department for Work and Pensions. 2015-06-25. Retrieved 2015-09-15.
- ↑ "One in 65 UK adults now a millionaire, figures show". The Guardian. 2015-08-27. Retrieved 2015-09-15.>
- 1 2 3 4 5 "A Guide to Sources of Data on Earnings and Income" (PDF). Office for National Statistics. 2015-01-01. Retrieved 2015-09-15.
- 1 2 "Income Tax rates and allowances: current and past". HM Revenue & Customs. 2015-04-06. Retrieved 2015-09-15.
- 1 2 "Annual Survey of Hours and Earnings". Office for National Statistics. 2014-11-19. Retrieved 2015-09-15.
- ↑ "OECD Better Life Index". OECD Better Life Index. Retrieved 2015-09-15.
- ↑ "Annual Survey of Hours and Earnings, 2014 Provisional Results, Selected Estimates, Table 11". Officer for National Statistics. 2014-11-19. Retrieved 2015-09-15.
- ↑ HMRC Distribution among the adult population of marketable wealth (Series C) (Table 13.5)
- ↑ Family Resources Survey 2005-06