Unemployment in the United Kingdom
Unemployment in the United Kingdom is measured by the Office for National Statistics and in the three months to September 2016 the headline unemployment rate stood at 4.8%, or 1.6 million people. This is a reduction in unemployed people of 146,000 from a year earlier, and is the lowest jobless rate since 2005. The ONS said the employment rate, or percentage of people in work for those aged between 16 and 64, was 74.5% for the three months to September. This is the joint highest employment rate since comparable records began in 1971. There were 31.8 million people in work, 461,000 more than a year earlier.[1]
The figures are compiled through the Labour Force Survey, which asks a sample of 53,000 households and is conducted every 3 months.[2]
Unemployment levels and rates are published each month by the Office for National Statistics in the Labour Market Statistical Bulletin. Estimates are available by sex, age, duration of unemployment and by area of the UK.
The definition and measurement of UK unemployment
The definition of unemployment used by the Office for National Statistics is based on the internationally agreed and recommended definition from the International Labour Organisation (ILO) – an agency of the United Nations. Use of this definition allows international comparisons of unemployment rates.
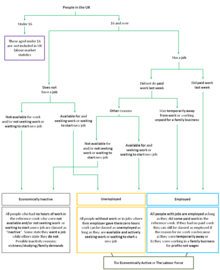
Unemployed people are defined as those aged 16 or over who are without work, available to start work in the next two weeks and who have either:
- a) been actively seeking work in the past four weeks, or
- b) are waiting to start a new job they have already obtained.[3]
Those who are without work who do not meet the criteria of unemployment are classed as “out of the labour force”, otherwise known as “economically inactive”. For example, a person who wants a job but is not available for work due to sickness or disability would be classed as economically inactive, not unemployed.
A short video explaining the basic labour market concepts of employment, unemployment and economic inactivity is available on the ONS YouTube channel.
The UK unemployment rate
In the UK the official unemployment rate is defined as the percentage of the labour force that is classed as unemployed.[4]

The denominator here is also known as the "Labour Force" or the "Economically Active Population".
In the three months to January 2014 there were 32.49 million people in the UK labour force and 2.34 million people classed as unemployed. These figures gave an official UK unemployment rate of 7.2%.[5]
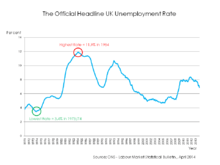
UK unemployment rates consistent with this definition are available from 1971. Considering this consistent time series, the highest unemployment rate recorded since 1971 was 11.9% in 1984 and the lowest was 3.4% in late 1973/early 1974.[6]
Data consistent with current international definitions is not available for years before 1971 due to there not being a Labour Force Survey before this time.
There is some data available on UK unemployment rates from before 1971 but it is not consistent with the current international definitions as it is more closely related to the Claimant Count.
However, if you wish to know more about this historic data, an article on it can be accessed at this pdf. This data is also available in an excel spreadsheet named CLA01 which can be accessed here .
Unemployment data and the claimant count
The headline unemployment figure arising from the official definition differs from the “Claimant Count” which is published alongside it.
The Claimant Count aims to measure the number of people claiming a benefit principally because they are unemployed.
However, some people classed as unemployed cannot claim unemployment benefits and some people claiming unemployment benefits are not classed as unemployed.
Examples[7]
- Someone looking for work alongside full-time study ← unemployed but not eligible for unemployment benefits
- Someone working for low wages ← not classed as unemployed but may be eligible for unemployment benefits
The current unemployment benefits available are Jobseeker’s Allowance and Universal Credit, however because Universal Credit is still relatively new, the Claimant Count data only measures the number of people claiming Jobseeker’s Allowance with the aim of including those receiving Universal Credit when possible.[8]
More information on the differences between the official headline unemployment figure and the Claimant Count is in this document.
Early history of UK unemployment
In sixteenth century England no distinction was made between vagrants and the jobless. Both were categorised as "sturdy beggars", to be punished and moved on.[9]
The closing of the monasteries in the 1530s increased poverty, as the church had helped the poor. In addition, there was a significant rise in enclosure during the Tudor period, limiting the land available for people to work on.
Those unable to find work had a stark choice: starve or break the law. In 1535, a bill was drawn up calling for the creation of a system of public works to deal with the problem of unemployment, to be funded by a tax on income and capital. A law passed a year later allowed vagabonds to be whipped and hanged.[10]
In 1547, a bill was passed that subjected vagrants to some of the more extreme provisions of the criminal law, namely two years servitude and branding with a "V" as the penalty for the first offence and death for the second.[11] In the 1576 Act each town was required to provide work for the unemployed.[12]
The Act for the Relief of the Poor 1601, known commonly as the "Elizabethan Poor Law", was one of the world's first government-sponsored welfare programs. It distinguished between those who were unable to work and those able-bodied people who refused employment. Under the Poor Law systems of England and Wales, Scotland and Ireland a workhouse was a place where people who were unable to support themselves, could go to live and work.[13] According to Jackson J. Spielvogel, "Poverty was a highly visible problem in the eighteenth century, both in cities and in the countryside... In France and Britain by the end of the century, an estimated 10 percent of the people depended on charity or begging for their food."[14] By 1776 some 1,912 parish and corporation workhouses had been established in England and Wales, housing almost 100,000 paupers.
UK unemployment data from 1881
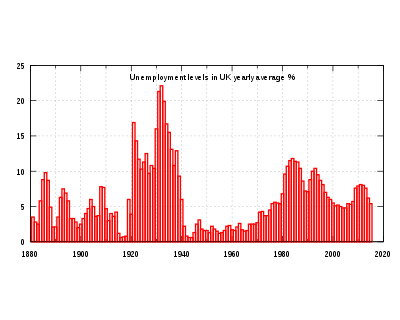

There is data available on UK unemployment from 1881 but it is not consistent with the current international definition. The data is more closely related to the “Claimant Count” but the coverage of the data between 1881 and 1948 is limited.[15]
Data available from 1881 to 1912 is based on the records of trade unions that paid unemployment benefit to their members. In 1912 there were 1.4 million members of trade unions that paid benefits. This means the unemployment rates for this period are based on a very small section of the UK population at the time (mainly manual workers). The lowest unemployment rate recorded in this period was 1.4% in 1890 and the highest was 10.2% in 1892.[15]
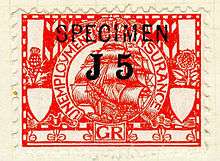
In 1911 a compulsory national scheme of insurance against unemployment was introduced. This meant there was a significant change to the way data on the unemployed was collected. From 1911 onwards it became a count based on the number of insured persons registered as unemployed.[15]
However, only a limited number of people could be insured, the act of 1911 only included around 2.25 million manual workers aged 16 years and over who were deemed to be working in an industry where employment was insecure. Therefore, unemployment data for 1912 to 1916 is still based on a relatively small section of the UK population at the time.[15]
The section of the population contributing to the unemployment data expanded in 1916 when the Unemployment Insurance Act brought a further 1.25 million workers into the National Insurance scheme. Considering the data based on this expansion, the highest recorded unemployment rate between 1916 and 1920 was 6.6% in December 1919 and the lowest was 2.6% in June 1920 (excluding the war years).[15]
The National Insurance Act of 1920 brought an additional 8 million workers into the scope of the scheme. This increased the total number of workers covered to around 11/12 million. Considering the data between 1920 and 1948 the highest recorded unemployment rate was 23.4% in May 1921 and the lowest was 1.6% in September 1947 (excluding the war years). Long periods of relatively high unemployment rates were also recorded in the UK in the Depression of the early 1930s.[15]
In 1948 there came a second National Insurance Act meaning the scheme now covered all male and female employees aged 15 and over. The data on the unemployed from 1948 to 1982 is referred to as the registrant count as it referred to the number of people registered at government offices as looking for work. The lowest recorded unemployment rate in this period is 1% in the mid 1950s, the highest was in September 1982 when it reached 14%.[15]
From 1982 onwards the count changed from the registrant count to the “Claimant Count” because from then on it aimed to count the number of people claiming benefits principally because they were unemployed. This count is still published today alongside the headline unemployment figure which is based on the Labour Force Survey.[15]
The introduction of the Labour Force Survey
From 1971 onwards there are two series of data on unemployment. The claimant count and the headline estimate of unemployment based on data collected in the Labour Force Survey. More information on the difference between the claimant count and the headline measure of unemployment is in this pdf.
Considering the data from 1971 that is consistent with the headline figure of unemployment currently published, around 1 million people were classed as unemployed in the early 1970s with an unemployment rate of around 4%. The level rose to 1.5 million by 1978 and the rate to around 5.5%, with many jobs being lost in the recession of 1973 to 1975, while industrial decline and technological advances also contributed to job losses. Unemployment was a major political theme at the 1979 general election, with the Conservative opposition campaign claiming "Labour isn't working" in an attack on the Labour government. The Conservatives won this election, Margaret Thatcher became Britain's first female prime minister and the party remained in power for 18 years, winning a total of four consecutive general elections.
Unemployment soared in the early 1980s as a result of another recession, the official level exceeding 3 million by 1982 and the official rate reaching 11.9% in 1984.[17] Most of these jobs had been lost in the heavy industry sector,[18] which was in decline, with the Conservative government's monetarist policies to tackle inflation also being blamed for the economic downturn and subsequent mass unemployment, which was particularly severe in Scotland, Northern Ireland, the north of England, and in South Wales. The south of England recovered well from the recession, however, enjoying the greatest benefits of thriving financial markets and strong growth in the service sector, while the rapid growth in the computing industry also created many new jobs.
Unemployment remained high until an economic boom during the second half of the 1980s. The official level fell below 3 million in mid 1987, dropped below 2 million in early 1989 and was down to 1.6 million by the end of that year, with the official rate of unemployment stood at 7.0% at the end of 1989.[17]
In spite of overseeing the highest unemployment figures seen in Britain for half a century, Margaret Thatcher's Conservative government was re-elected at the general elections of 1983 and 1987.
However, increases in the inflation rate towards the end of the 1980s led to increased interest rates[19] and another recession which began in 1990. Unemployment began to increase and by the end of 1992 the official level had again risen to almost 3 million with the official rate around 10.6%, although inflation was brought under control during this time, falling from over 10% in 1990 to just over 1% by 1993. The economic situation of the UK improved after 1992, however, and the official unemployment level fell below 2 million by 1997 with the rate standing at around 6.8%, with inflation also remaining low. Re-established economic growth was also strong.[17]
High unemployment and a recession-hit economy did not prevent the Conservative government from winning a fourth consecutive general election under Thatcher's successor John Major in 1992, but Major's government suffered a comprehensive defeat at the next general election five years later, being ousted by Tony Blair's revitalised "New Labour", in spite of the economic upturn and fall in unemployment that Major's government had overseen.
The official level of unemployment remained below 2 million after 1996, dropping below 1.5 million at several stages between 2000 and 2005, with an official rate around 5% until 2008. There was a slight rise in unemployment during 2005 and 2006, as the workforce expanded partly due to increased immigration (mostly from the Eastern European states which had just joined the European Union), and as a result of a decline in manufacturing, with the West Midlands of England being particularly hard hit by the collapse of MG Rover in Birmingham in 2005 and Peugeot's decision to close its Ryton plant near Coventry the following year. MG Rover employed more than 6,000 people, but added onto job losses in dealerships, supply industries and other businesses which had largely relied on trade from MG Rover and its employees, as many as 30,000 jobs were believed to have been lost as a result of the carmaker's collapse. More than 2,000 people were employed at the Peugeot factory by the time of its closure. Many employers also moved some or all of their manufacturing to other countries (including EU member states), citing lower labour costs as a reason for doing so.
The economic downturn in 2008 caused the official level of unemployment to exceed 2 million by 2009 and 2.5 million a year later, with the rate reaching 8.0%. The rate and level then both began to fall slightly for a while before both rising again to reach 2.6 million and 8.3% respectively by the end of 2011, largely due to public sector job losses resulting from the Conservative-led government's spending cuts.[17]
In 2013, the Governor of the Bank of England Mark Carney stated that the Bank would only raise interest rates when the official unemployment rate fell to 7% or under.[20] In the three months leading to April 2014 the official unemployment rate fell to 6.9%[17] but economists suggested it was still too soon to see any upward movement in interest rates.[21]
Hidden unemployment
“Hidden” unemployment is not an official statistical concept, however it is a phrase sometimes used to describe certain types of people who are not included in the official headline figures for unemployment. The types of people sometimes considered as “hidden” include:
- Those workers who would like to work more hours – also known as the "underemployed"
- Those without work aged between 16 and 59 who have savings in excess of £16,000 - because this makes them ineligible for claiming Jobseekers Allowance, they are classed as "economically inactive" rather than "unemployed", whether or not they are actively looking for work
and the Potential Additional Labour Force, who Eurostat defines as:[22]
- Those available to work but not seeking a job – a subset of which are known as "discouraged workers"
- Those who are seeking work but who are not immediately available to start a job.
Underemployed workers
The definition of underemployed workers used by the Office for National Statistics is as follows:
Underemployed workers are those people in employment who are willing to work more hours, either by working in an additional job, by working more hours in their current job, or by switching to a replacement job. They must also be available to start working longer hours within 2 weeks and their current weekly hours must be below 40 hours if they are between 16 and 18 and below 48 hours if they are over 18.[23]
Statistics on underemployed workers are not updated by the Office for National Statistics on a regular basis. However data on underemployed workers is available from 2000 when all the questions needed to calculate underemployment were added to the Labour Force Survey.
In 2000 it was estimated that there were just over 2 million underemployed workers in the UK. This figure fell to just below 1.8 million in 2004 before rising to just over 3 million in 2012. A rise of 980,000 occurred between the 2008 economic downturn and 2012.[24] The most recent figures available on the number of underemployed workers are for the period April to June 2013 when it was estimated that there were 3.08 million underemployed workers in the UK.[25]
Underemployment and Zero Hours Contracts
Some underemployed people may be on a zero hour contract but estimates of the number of people on these contracts are separate to the estimates of the number of underemployed people. Some people on zero hour contracts do not want or are not available to work more hours, therefore they cannot be considered to be underemployed.
Proxy Measures of Underemployment
The number of people working in part-time jobs because they could not find a full-time one is sometimes used as a proxy for the number of underemployed people in the economy.
These figures are published in the monthly Labour Market Bulletin and the series runs from 1992. In March to May 1992 it was estimated that 11.3% of all part-time workers (excluding unpaid family workers and those on government schemes) were working in a part-time role because they could not find a full-time job. In March to May 2013 it was estimated that 18.4% of part-time workers were in this situation.[26]
Another proxy measure for unemployment is the number of workers with a second job. This is also published by the Office for National Statistics in the monthly Labour Market Bulletin and the series is available from March to May 1992.[26]
The potential additional labour force
Available for work but not seeking
The number of jobless people who are available to work but not seeking it is not published by the Office for National Statistics on a monthly basis but it is available in some Eurostat publications. It was estimated that in 2012 there were 774,000 people aged 15 to 74 in the UK who were available to work but not seeking work.[27]
In 2014 the UK government looks to improve unemployment and increase the labour force through implementing measures that affect the boundaries in which UK jobs are advertised. Proposals call for UK jobs to be advertised more prominently within the UK rather than across Europe as this has been attributed to a rise in unemployment in nationals whilst the UK has experienced an increased in non-nationals seeking employment in the UK.[28]
Discouraged workers
- In the UK some jobless people aged 16 to 64 who are available to work but not seeking it are referred to as “discouraged workers”.
- The official definition of discouraged workers are those workers aged 16 to 64 who are available to work but not seeking it because they believe there are no jobs available for them. As they are not actively seeking work, they are not included in the headline unemployment figures.[29]
- The Office for National Statistics publishes monthly estimates of the number of discouraged workers and the series runs from March to May 1993 when it was estimated there were 167,000 of them. In March to May 2013 it was estimated there were 63,000 discouraged workers.[26] However because this estimate comes from a survey it may be that the number of discouraged workers is undercounted because people are embarrassed to state that they do not believe there are any jobs available for them.
Seeking work but not available
Figures on those people seeking work but not immediately available to start are not published in the monthly labour market bulletin but they are available in some Eurostat publications. In 2012 it was estimated that there were 334,000 people aged 15 to 74 in the UK who were in this situation.[27]
A measure of the potential additional labour force in the UK
The Office for National Statistics publishes monthly figures on the number of economically inactive people who want a job but who are not included in the unemployment figures either because they did not actively seek work in the 4 weeks previous to the survey date or because they are not available to start work within the 2 weeks following the survey date.
These figures run from March to May 1992 when it was estimated there were just under 2 million people who were economically inactive but who wanted a job. In March to May 2013 it was estimated that there were 2.3 million people in this situation.[30]
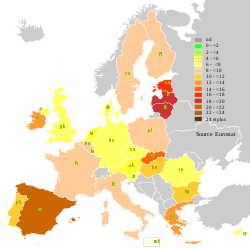
Labour market comparisons across Europe
Eurostat defines the unemployed as those people aged 15 to 74 who:
- Are not working
- Looked for work in the last 4 weeks
- Are ready to start in 2 weeks.
They define long-term unemployment as a period of unemployment that lasts for over 1 year.
Eurostat uses the European Union Labour Force Survey, which collects quarterly data for all member states.[31]
To find out more about the economies of Europe visit this page: Economy of the European Union
Employment in the UK
The employment rate in the UK for those aged 16–64 was 73.9% in the three months to October 2015, which is the highest since records began in 1971. There were 31.3 million people in work and this can be broken down by gender into 16.7 million men and 14.6 million women in work or into 22.9 million working full-time and 8.4 million working part-time. There were 26.52 million employees and 4.61 million self-employed people.[32]
In Q3 2016, there were 28.39 million UK nationals aged 16 and over employed in the UK, up 213,000 on a year ago. 74.9% of all UK nationals aged 16-64 were in employment. The number of non-UK nationals working in the UK has also increased in the past year by 241,000 to 3.49 million. 72.8% of non-UK nationals aged 16-64 living in the UK were in employment.[33]
Job security, job searching and income insurance
Job security
- Redundancy under Employment Rights Act 1996 s 135
- Unfair dismissal, ERA 1996 ss 94-98
- Reasonable notice, ERA 1996, s 86
- Works councils
- Information and consultation
Job searching
- Jobcentre Plus
- Public employment agency
- Employment Agencies Act 1973
- LEAP (Learning and Enterprise Access Points)
Income insurance
- Supplementary Benefit 1966, abolished in 1988
- Statutory sick pay
- Severe Disablement Allowance replaced by Incapacity benefit in 2001.
- Income Support, means tested benefit for people on low incomes.
- Employment and Support Allowance 2008, replaced incapacity benefit and split off and replaced income support on grounds of sickness or disability
- Housing Benefit
- Jobseeker's Allowance
Economic theory
- Automatic stabilisers
- JM Keynes, The General Theory of Employment, Interest and Money (1936)
- Effective aggregate demand
- Fiscal stimulus
- Natural rate of unemployment
Law
- United Nations Universal Declaration of Human Rights
- Jobseekers Act 1995 (c 18) and Jobseeker's Allowance and Jobcentre Plus
- Jobseekers Act 1995 s 19, disparity in definitions on misconduct
- New Deal (United Kingdom)
See also
- Economy of the United Kingdom
- Youth unemployment in the United Kingdom
- NEET
- Employment Promotion and Protection against Unemployment Convention, 1988
- New Deal (United Kingdom)
- ILO, Unemployment Convention, 1919
- Adams v. Tanner, 244 U.S. 590 (1917)
- Unemployment Insurance Act 1920, Unemployment Insurance Act 1921, Unemployment Insurance Act 1924, Unemployment Insurance Act 1927 and Unemployment Insurance Act 1930
- ILO, Unemployment Provision Convention, 1934 (shelved)
- Unemployment Act 1934 and Unemployment Assistance Board
- Interwar unemployment and poverty in the United Kingdom
- Great Depression in the United Kingdom
- United States, Employment Act of 1946 and the Humphrey–Hawkins Full Employment Act of 1978 and full employment
- National Assistance Act 1946
- Poor Law Amendment Act 1834 and Royal Commission into the Operation of the Poor Laws 1832
- Karl Marx, Das Kapital (1867) and reserve army of labour
- National Insurance Act 1911 and National Insurance
- UK labour law
- List of countries by unemployment rate
- List of recessions in the United Kingdom
- List of stock market crashes
- Relationship of automation to unemployment
Notes
- ↑ "UK Labour Market, November 2016". ONS. 2016-11-16. Retrieved 2016-11-16.
- ↑ See Office for National Statistics, 'How exactly is unemployment measured?' (August 2010)
- ↑ See points 47 and 48 in this document (ILO Resolution Document)
- ↑ "Labour Market Statistics, April 2014". ONS. 2014-04-16. Retrieved 2014-06-03.
- ↑ "Employment up 193,000 compared with the previous quarter". ONS. 2014-02-19. Retrieved 2014-06-03.
- ↑ Unhide the rows on tab 2 of reference table A01 in the April 2014 Labour Market Statistical Bulletin
- ↑ http://www.ons.gov.uk/.../unemployment-and-the-claimant-count.pdf
- ↑ See footnote 1 in table CLA01(ONS Claimant Count Summary April 2014)
- ↑ "Sturdy Beggars". Probertencyclopaedia.com. Retrieved 2009-07-22.
- ↑ "Poor Tudors". Localhistories.org. Retrieved 2009-07-22.
- ↑ R. O. Bucholz, Newton Key, Early modern England, 1485–1714, p176
- ↑ "Poverty in Elizabethan England". BBC - History.
- ↑ "British social policy, 1601-1948", The Robert Gordon University, Aberdeen.
- ↑ JJ Spielvogel, Western Civilization: Since 1500 (Cengage Learning 2008) 566
- 1 2 3 4 5 6 7 8 9 Denman, James; McDonald, Paul (1 Jan 1996). "Unemployment statistics from 1881 to the present day" (PDF). Labour Market Trends. Retrieved Jul 3, 2016.
- ↑ "UK Labour Market: June 2016". Office for National Statistics. 2016. Retrieved Jul 3, 2016.
- 1 2 3 4 5 "Release Edition Reference Tables". ONS. 2014-04-16. Retrieved 2014-06-03.
- ↑ "In Pictures | Thatcher years in graphics". BBC News. 2005-11-18. Retrieved 2014-06-03.
- ↑ "Historical UK Inflation And Price Conversion". Safalra.com. 2013-10-28. Retrieved 2014-06-03.
- ↑ "Monetary Policy | Forward Guidance". Bank of England. Retrieved 2014-06-03.
- ↑ "BBC News - UK unemployment falls to five-year low of 2.2m". Bbc.co.uk. 2014-04-16. Retrieved 2014-06-03.
- ↑ "Unemployment and beyond - Statistics Explained". Epp.eurostat.ec.europa.eu. Retrieved 2014-06-03.
- ↑ "People in Work Wanting More Hours Increases by 1 million Since 2008". ONS. 2012-11-28. Retrieved 2014-06-03.
- ↑ "People in Work Wanting More Hours Increases by 1 million Since 2008". ONS. 2012-11-28. Retrieved 2014-06-03.
- ↑ http://www.ons.gov.uk/ons/about-ons/business-transparency/freedom-of-information/what-can-i-request/published-ad-hoc-data/labour/october-2013/level-and-rate-of-underemployment-for-april-to-june-2000---2013.xls
- 1 2 3 From this link download table A01 and go to tab 3
- 1 2 "File:Unemployment and supplementary indicators, 2012 YB14.png - Statistics Explained". Epp.eurostat.ec.europa.eu. 2014-03-17. Retrieved 2014-06-03.
- ↑ http://globalyoungexecutive.com/2014/08/08/the-uk-job-market-its-not-for-everyone/
- ↑ "A guide to labour market statistics". ONS. 2012-11-14. Retrieved 2014-06-03.
- ↑ From this link download table A01 and go to tab 13
- ↑ "European Commission, Eurostat". Retrieved 5 November 2009.
- ↑ "UK Labour Market, March 2016". ONS. 2016-03-16. Retrieved 2016-03-16.
- ↑ "Employment by Country of Birth and Nationality, 21 November 2016" (PDF). House of Commons Library. 2016-11-21. Retrieved 2016-11-30.
References
- Articles
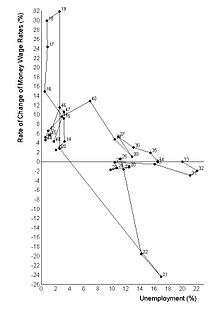
- AW Phillips, 'The Relation between Unemployment and the Rate of Change of Money Wage Rates in the United Kingdom, 1861-1957 (1958) Economica
- Books
- K Marx, Das Kapital (1867)
- JM Keynes, The General Theory of Employment, Interest and Money (1936)
- W Beveridge, Full Employment in a Free Society (1944)
- Reports
- Royal CoInter-Departmental Committee on Social Insurance and Allied Services (1942) Cmd 6404
- International Labour Organisation, 'Resolution concerning statistics of the economically active population, employment, unemployment and underemployment' Thirteenth (October 1982) International Conference of Labour Statisticians
External links
- Office for National Statistics, 'How exactly is unemployment measured?' (August 2010)
- Eurostat's page on unemployment