Waynesburg, Ohio
| Waynesburg, Ohio | |
|---|---|
| Village | |
|
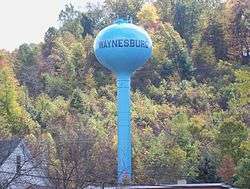
Waynesburg water tower | |
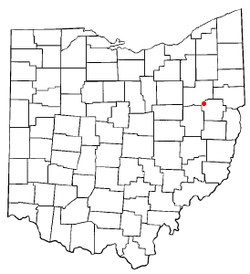 Location within the state of Ohio | |
 Location of Waynesburg in Stark County | |
| Coordinates: 40°40′4″N 81°15′25″W / 40.66778°N 81.25694°WCoordinates: 40°40′4″N 81°15′25″W / 40.66778°N 81.25694°W | |
| Country | United States |
| State | Ohio |
| County | Stark |
| Township | Sandy |
| Area[1] | |
| • Total | 0.52 sq mi (1.35 km2) |
| • Land | 0.52 sq mi (1.35 km2) |
| • Water | 0 sq mi (0 km2) |
| Population (2010)[2] | |
| • Total | 923 |
| • Estimate (2012[3]) | 920 |
| • Density | 1,775.0/sq mi (685.3/km2) |
| Time zone | Eastern (EST) (UTC-5) |
| • Summer (DST) | EDT (UTC-4) |
Waynesburg is a village in Stark County, Ohio, United States. The population was 923 at the 2010 census,[4] a decrease from 1,003 in 2000. It is part of the Canton-Massillon, OH Metropolitan Statistical Area.
History
Waynesburg was platted in 1814, and named in honor of Anthony Wayne.[5] A post office called Waynesburgh was established in 1824, and the name was changed to Waynesburg in 1893.[6]
Geography
Waynesburg is located at 40°40′4″N 81°15′25″W / 40.66778°N 81.25694°W (40.667911, -81.257029),[7] along Sandy Creek.[8]
According to the United States Census Bureau, the village has a total area of 0.52 square miles (1.35 km2), all land.[1]
Waynesburg lies at the intersection of Ohio State Routes 43 and 183 with SR 171 also present.
Waynesburg is also close to Lake Mohawk.
Demographics
2010 census
As of the census[2] of 2010, there were 923 people, 361 households, and 249 families residing in the village. The population density was 1,775.0 inhabitants per square mile (685.3/km2). There were 408 housing units at an average density of 784.6 per square mile (302.9/km2). The racial makeup of the village was 97.6% White, 1.0% African American, 0.1% Native American, 0.1% Asian, and 1.2% from two or more races. Hispanic or Latino of any race were 0.7% of the population.
There were 361 households of which 33.8% had children under the age of 18 living with them, 47.1% were married couples living together, 16.9% had a female householder with no husband present, 5.0% had a male householder with no wife present, and 31.0% were non-families. 28.5% of all households were made up of individuals and 14.7% had someone living alone who was 65 years of age or older. The average household size was 2.56 and the average family size was 3.10.
The median age in the village was 39 years. 25.7% of residents were under the age of 18; 8.2% were between the ages of 18 and 24; 24.4% were from 25 to 44; 28.1% were from 45 to 64; and 13.5% were 65 years of age or older. The gender makeup of the village was 50.2% male and 49.8% female.
2000 census
As of the census[9] of 2000, there were 1,003 people, 391 households, and 276 families residing in the village. The population density was 1,944.5 people per square mile (744.7/km²). There were 410 housing units at an average density of 794.9 per square mile (304.4/km²). The racial makeup of the village was 95.71% White, 2.89% African American, 0.30% Native American, 0.20% Asian, and 0.90% from two or more races. Hispanic or Latino of any race were 1.00% of the population.
There were 391 households out of which 35.0% had children under the age of 18 living with them, 50.4% were married couples living together, 15.3% had a female householder with no husband present, and 29.4% were non-families. 25.8% of all households were made up of individuals and 14.8% had someone living alone who was 65 years of age or older. The average household size was 2.57 and the average family size was 3.09.
In the village the population was spread out with 27.2% under the age of 18, 7.1% from 18 to 24, 28.7% from 25 to 44, 20.6% from 45 to 64, and 16.4% who were 65 years of age or older. The median age was 36 years. For every 100 females there were 97.1 males. For every 100 females age 18 and over, there were 93.1 males.
The median income for a household in the village was $34,125, and the median income for a family was $39,861. Males had a median income of $34,792 versus $19,779 for females. The per capita income for the village was $14,996. About 13.2% of families and 16.4% of the population were below the poverty line, including 24.2% of those under age 18 and 4.5% of those age 65 or over.
Education
| Historical population | |||
|---|---|---|---|
| Census | Pop. | %± | |
| 1870 | 425 | — | |
| 1880 | 622 | 46.4% | |
| 1890 | 510 | −18.0% | |
| 1900 | 613 | 20.2% | |
| 1910 | 760 | 24.0% | |
| 1920 | 978 | 28.7% | |
| 1930 | 1,186 | 21.3% | |
| 1940 | 1,223 | 3.1% | |
| 1950 | 1,258 | 2.9% | |
| 1960 | 1,442 | 14.6% | |
| 1970 | 1,337 | −7.3% | |
| 1980 | 1,160 | −13.2% | |
| 1990 | 1,068 | −7.9% | |
| 2000 | 1,003 | −6.1% | |
| 2010 | 923 | −8.0% | |
| Est. 2015 | 923 | [10] | 0.0% |
| Sources:[11][12] | |||
Students attend the Sandy Valley Local School District.[13] Students may also attend the parochial school called Saint James Elementary.
Notable person
- Joseph J. Cicchetti — soldier in the United States Army who received the Medal of Honor in World War II during actions in the campaign to recapture the Philippines from Japanese forces in 1945.
References
- 1 2 "US Gazetteer files 2010". United States Census Bureau. Retrieved 2013-01-06.
- 1 2 "American FactFinder". United States Census Bureau. Retrieved 2013-01-06.
- ↑ "Population Estimates". United States Census Bureau. Retrieved 2013-06-17.
- ↑ Ohio Department of Development
- ↑ Overman, William Daniel (1958). Ohio Town Names. Akron, OH: Atlantic Press. p. 140.
- ↑ "Post offices". Jim Forte Postal History. Retrieved 21 June 2016.
- ↑ "US Gazetteer files: 2010, 2000, and 1990". United States Census Bureau. 2011-02-12. Retrieved 2011-04-23.
- ↑ DeLorme (1991). Ohio Atlas & Gazetteer. Yarmouth, Maine: DeLorme. ISBN 0-89933-233-1.
- ↑ "American FactFinder". United States Census Bureau. Retrieved 2008-01-31.
- ↑ "Annual Estimates of the Resident Population for Incorporated Places: April 1, 2010 to July 1, 2015". Retrieved July 2, 2016.
- ↑ census data: 1870 : 1870 page 24 , 1880 : Howe, Henry (1907). Historical Collections of Ohio, The Ohio Centennial Edition. The State of Ohio. p. 305. , 1890,1900 : Hunt, William C. (1901). Population of the United States by states and territories, counties, and minor Civil Divisions, as returned at the Twelfth Census: 1900. United States Census Printing Office. p. 345. , 1910, 1920, 1930 : 1930 page 56 , 1940, 1950 : 1950 page 27 , 1960, 1970 : 1970 page=148 , 1990 : 1990 , 2000 : 2000
- ↑ Data in historical populations table from US Census, 2000; "American Factfinder". United States Census Bureau. Retrieved 2012-12-25.
- ↑ PUC Ohio map of School Districts Stark County
Municipalities and communities of Stark County, Ohio, United States | ||
|---|---|---|
| Cities | 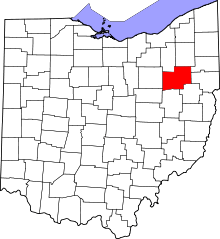 | |
| Villages | ||
| Townships | ||
| CDPs | ||
| Unincorporated communities | ||
| Footnotes | ‡This populated place also has portions in an adjacent county or counties | |