Portuguese local election, 1982
| Portugal |
 This article is part of the series: |
The Portuguese local election of 1982 took place on 12 December. This was the third local election in Portugal since the democratic revolution of 1974 introduced the concept of democratic local power.
The election consisted of three separate elections in the 305 Portuguese municipalities that existed at the time, the election for the Municipal Chambers, whose winner is elected mayor, another election for the Municipal Assembly and a last one for the lower-level Parish Assembly, whose winner is elected parish president, this last was held separately in the more than 4,000 parishes around the country.
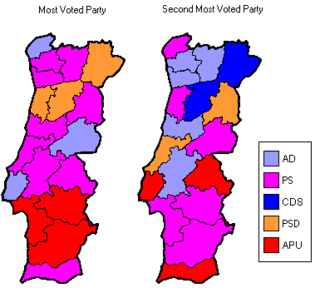
The Socialist Party finished once more on the top of the results table, increasing its share by 4%, however that was because the coalition between the two major right-wing parties, the Democratic and Social Center and the Social Democratic Party, the Democratic Alliance, did not participate in all Municipalities and Parishes, being the parties which composed it, separated in many Municipalities. This right wing coalition did, however, lose some voting in relation to the previous election.
The left-wing United People Alliance dominated the election in the municipalities of the South of the country, gathering more than 60% of the voting and achieving its best result ever with 20.7% and 55 mayors.
Parties
The main political forces involved in the election were:
- Democratic Alliance (AD) (only in some municipalities)
- Democratic and Social Center (CDS) (only in some municipalities)
- Socialist Party (PS)
- Social Democratic Party (PSD) (only in some municipalities)
- United People Alliance (APU)
National summary of votes and seats
Municipal Councils
| Parties | Votes | % | Candidacies | Councillors | Mayors | ||||
|---|---|---|---|---|---|---|---|---|---|
| # | ± | # | ± | ||||||
| PS | 1,547,664 | 31.18 | 619 | 83 | |||||
| United People Alliance | 1,038,033 | 20.91 | 316 | |
55 | ||||
| Democratic Alliance | 988,347 | 19.91 | 322 | 49 | |||||
| PSD | 745,048 | 15.01 | 439 | 88 | |||||
| Democratic and Social Centre | 369,263 | 7.44 | 185 | 27 | |||||
| People's Democratic Union | 31,567 | 0.64 | 3 | 0 | |||||
| Socialist / UEDS | 31,251 | 0.63 | 11 | — | 1 | — | |||
| Workers' Communist Party | 15,315 | 0.31 | 0 | 0 | |||||
| People's Monarchist Party | 11,149 | 0.22 | 5 | 1 | |||||
| Workers Party of Socialist Unity | 5,684 | 0.11 | 0 | 0 | |||||
| Independent Social Democratic Action | 4,236 | 0.09 | 7 | — | 1 | — | |||
| Democratic Union | 3,840 | 0.08 | 2 | — | 0 | — | |||
| OCMLP | 1,388 | 0.03 | 0 | — | 0 | — | |||
| Christian Democratic Party | 855 | 0.02 | 0 | 0 | |||||
| Total valid | 4,785,586 | 96.40 | — | 1,909 | 305 | ||||
| Blank ballots | 87,381 | 1.76 | |||||||
| Invalid ballots | 91,403 | 1.84 | |||||||
| Total (turnout 71.05%) | 4,964,370 | 100.00 | |||||||
Municipal Assemblies
| Parties | Votes | % | Candidacies | Mandates | |||||
|---|---|---|---|---|---|---|---|---|---|
| # | ± | ||||||||
| PS | 1,583,804 | 31.23 | 3,182 | ||||||
| United People Alliance | 1,070,247 | 21.10 | 1,763 | ||||||
| Democratic Alliance | 990,315 | 19.53 | 1,625 | ||||||
| PSD | 717,131 | 14.14 | 2,148 | ||||||
| Democratic and Social Centre | 379,833 | 7.49 | 1,003 | ||||||
| People's Democratic Union | 35,128 | 0.70 | 21 | ||||||
| Socialist / UEDS | 31,481 | 0.63 | 52 | — | |||||
| Democratic Union | 30,707 | 0.61 | 40 | — | |||||
| People's Monarchist Party | 10,314 | 0.21 | 28 | ||||||
| Workers' Communist Party | 7,120 | 0.14 | 1 | ||||||
| Independent Social Democratic Action | 3,858 | 0.08 | 32 | — | |||||
| Workers Party of Socialist Unity | 2,499 | 0.05 | 0 | — | |||||
| Christian Democratic Party | 847 | 0.02 | 2 | ||||||
| OCMLP | 526 | 0.01 | 0 | — | |||||
| Total valid | 4,865,027 | 95.93 | — | 9,897 | |||||
| Blank ballots | 115,352 | 2.27 | |||||||
| Invalid ballots | 91,128 | 1.80 | |||||||
| Total (turnout 71.28%) | 5,071,507 | 100.00 | |||||||
Parish Assemblies

| Parties | Votes | % | Candidacies | Mandates | Presidents | ||||
|---|---|---|---|---|---|---|---|---|---|
| # | ± | # | ± | ||||||
| PS | 1,527,322 | 31.03 | 12,803 | |
|||||
| United People Alliance | 1,071,831 | 21.76 | 4,997 | ||||||
| Democratic Alliance | 905,696 | 18.40 | 7,684 | |
|||||
| PSD | 760,847 | 15.46 | 9,499 | ||||||
| Democratic and Social Centre | 381,150 | 7.74 | 4,837 | ||||||
| Independents | 65,865 | 1.34 | 1,038 | ||||||
| Democratic Union | 29,284 | 0.59 | 342 | — | — | ||||
| Socialist / UEDS | 25,265 | 0.51 | 258 | — | — | ||||
| People's Democratic Union | 24,799 | 0.50 | 30 | ||||||
| People's Monarchist Party | 6,261 | 0.13 | 99 | ||||||
| Workers' Communist Party | 5,023 | 0.10 | 0 | ||||||
| Independent Social Democratic Action | 2,768 | 0.06 | 49 | — | — | ||||
| Workers Party of Socialist Unity | 856 | 0.02 | 0 | ||||||
| Christian Democratic Party | 482 | 0.00 | 0 | |
|||||
| OCMLP | 444 | 0.00 | 0 | — | — | ||||
| Total valid | 4,738,913 | 96.28 | — | 41,636 | — | ' | — | ||
| Blank ballots | 87,935 | 1.79 | |||||||
| Invalid ballots | 95,380 | 1.94 | |||||||
| Total (turnout 69.59%) | 4,922,228 | 100.00 | |||||||
End notes
- The source of the voting data is the Portuguese Electoral Commission
Further Notes:
- Democratic Alliance (AD) was composed by the Democratic Social Center (CDS), the Social Democratic Party (PSD) and the People's Monarchist Party (PPM).
- Although the PSD, the CDS and the PPM were united in the Democratic Alliance, they appear in the scorecard because they ran separated in several municipalities.
- United People Alliance (APU) was composed by the Portuguese Communist Party (PCP) and the Portuguese Democratic Movement (MDP/CDE).
- The number of candidacies expresses the number of municipalities or parishes in which the party or coalition presented lists.
- The number of mandates expresses the number of municipal deputies in the Municipal Assembly election and the number of parish deputies in the Parish Assembly election.
- The turnout varies because one may choose not to vote for all the organs.
References
- "CNE Resultados". Comissão Nacional de Eleições. Retrieved 17 January 2006.
- "Centro de Estudos do Pensamento Político". Retrieved 17 January 2006.
| Presidential elections | |
|---|---|
| Parliamentary elections |
|
| Local elections | |
| European elections | |
| Referendums | |
| |