Portuguese legislative election, 1983
| | |||||||||||||||||||||||||||||||||||||||||||||||
| |||||||||||||||||||||||||||||||||||||||||||||||
| |||||||||||||||||||||||||||||||||||||||||||||||
|
| |||||||||||||||||||||||||||||||||||||||||||||||
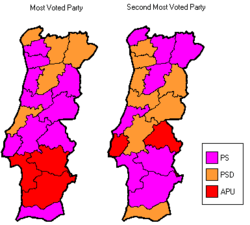
| The first and the second most voted parties in each district (Azores and Madeira are not shown) | |||||||||||||||||||||||||||||||||||||||||||||||
| |||||||||||||||||||||||||||||||||||||||||||||||
_square.jpg)

| Portugal |
 This article is part of the series: |
The Portuguese legislative election of 1983 took place on 25 April. The last election, in October 1980 had been won by a right-wing coalition, the Democratic Alliance and Francisco Sá Carneiro had retained office as Prime Minister with an increased majority. However, Sá Carneiro, along with other important members of the coalition, died in an aircrash only two months after the election, on 5 December 1980. Such happenings caused a massive political instability and Francisco Pinto Balsemão, a senior official of the Social Democratic Party, the largest party in the Alliance, became Prime Minister. But Balsemão lacked support from such senior members of his party as Aníbal Cavaco Silva, and several ministers resigned. Moreover, the right-wing policy was criticized by the left-wing and by the trade unions, and in February, the General Confederation of the Portuguese Workers, with the support of the Communists, called for a general strike that shook the government. The wave of resignations among Balsemão's ministers continued and by the end of the year, he also resigned. Because no one inside the Social Democratic Party accepted the office of Prime Minister, the President Ramalho Eanes dissolved the Parliament and called an election for April.
The election was won by the Socialist Party with 36%, and Mário Soares was nominated Prime Minister. However, the Socialists lacked a majority in the Assembly of the Republic and were forced to form a coalition with the Social Democrats, in what was called the "Central Block". Although this coalition allowed Soares to govern, several members of both parties were against it, and internal attacks led to the collapse of the coalition after less than two years. In the election that followed, the Communist-dominated United People Alliance lost 3 MPs and the Democratic and Social Center, after the dissolution of the Democratic Alliance, was now alone in the Parliament with 30 MPs, a loss of 16. The election marked the beginning of a process of bi-polarization of Portuguese politics.
This was the last legislative election to be won by the Socialist Party until 1995.
Parties
The major parties involved and the respective leaders:
- United People Alliance (APU), Álvaro Cunhal
- Socialist Party (PS), Mário Soares
- Social Democratic Party (PSD), Mota Pinto
- Democratic and Social Center (CDS), Lucas Pires
Mário Soares, leader of the Socialist Party, was nominated Prime Minister.
National summary of votes and seats
| Parties | Votes | % | ± | Seats | |||||
|---|---|---|---|---|---|---|---|---|---|
| 1980 | 1983 | ± | % | ± | |||||
| Socialist[A] | 2,061,309 | 36.11 | 741 | 101 | 40.40 | ||||
| Social Democratic[B] | 1,554,804 | 27.24 | N/A | 82 | 75 | 30.00 | |||
| United People Alliance[C] | 1,031,609 | 18.07 | 41 | 44 | 17.60 | ||||
| Democratic and Social Centre[B] | 716,705 | 12.56 | N/A | 46 | 30 | 12.00 | |||
| Christian Democratic Party | 39,180 | 0.69 | N/A | N/A | 0 | N/A | 0.00 | N/A | |
| People's Monarchist Party[B] | 27,635 | 0.48 | N/A | 6 | 0 | 0.00 | |||
| People's Democratic Union | 27,260 | 0.48 | 1 | 0 | 0.00 | ||||
| People's Democratic Union / PSR | 25,222 | 0.44 | N/A | N/A | 0 | N/A | 0.00 | N/A | |
| Workers' Communist Party | 20,995 | 0.37 | 0 | 0 | 0.00 | ||||
| Workers Party of Socialist Unity | 19,657 | 0.34 | 0 | 0 | 0.00 | ||||
| Revolutionary Socialist Party | 13,327 | 0.23 | 0 | 0 | 0.00 | ||||
| Socialist Workers League | 11,500 | 0.20 | N/A | N/A | 0 | N/A | 0.00 | N/A | |
| OCMLP | 6,113 | 0.11 | 0 | 0 | 0.00 | ||||
| Democratic Party of the Atlantic | 5,523 | 0.10 | 0 | 0 | 0.00 | ||||
| Communist Party (Reconstructed)[D] | 86 | 0.00 | N/A | N/A | 0 | N/A | 0.00 | N/A | |
| Total valid | 5,561,011 | 97.43 | 250 | 250 | 100.00 | ||||
| Blank ballots | 42,494 | 0.74 | |||||||
| Invalid ballots | 104,276 | 1.83 | |||||||
| Total (turnout 77.79%) | 5,707,695 | 100.00 | |||||||
| A The Socialist Party contested the 1980 election in a coalition (Republican and Socialist Front). B The Social Democratic Party, the Democratic and Social Centre and the People's Monarchist Party contested, together, the 1980 election in a coalition (Democratic Alliance). C Portuguese Communist Party (41 MPs) and Portuguese Democratic Movement (3 MPs) ran in coalition.[3] D Communist Party (Reconstructed) list only in Europe and Rest of the World. | |||||||||
| Source: Comissão Nacional de Eleições, Mapa oficial. D.R. n.º 121, Suplemento, Série I de 1983-05-26 | |||||||||
1 Socialist Party results are compared to the combined totals of the Republican and Socialist Front in the 1980 election.
2 Social Democratic Party results are compared to the combined totals of the Democratic Alliance in the 1980 election.
Distribution by constituency
| Constituency | % | S | % | S | % | S | % | S | Total S |
|---|---|---|---|---|---|---|---|---|---|
| PS | PSD | APU | CDS | ||||||
| Azores | 31.1 | 2 | 54.4 | 3 | 3.1 | - | 4.7 | - | 5 |
| Aveiro | 36.6 | 6 | 34.8 | 6 | 7.0 | 1 | 16.4 | 2 | 15 |
| Beja | 28.0 | 2 | 11.8 | - | 49.4 | 3 | 4.1 | - | 5 |
| Braga | 39.7 | 7 | 27.0 | 5 | 8.8 | 1 | 18.3 | 3 | 16 |
| Bragança | 30.4 | 1 | 35.8 | 2 | 4.8 | - | 20.9 | 1 | 4 |
| Castelo Branco | 37.1 | 3 | 30.6 | 2 | 11.3 | - | 13.2 | 1 | 6 |
| Coimbra | 45.3 | 6 | 27.8 | 3 | 10.7 | 1 | 10.2 | 1 | 11 |
| Évora | 23.9 | 1 | 18.6 | 1 | 47.6 | 3 | 4.5 | - | 5 |
| Faro | 43.2 | 5 | 23.1 | 2 | 18.6 | 2 | 7.4 | - | 9 |
| Guarda | 33.5 | 2 | 31.5 | 2 | 4.9 | - | 23.8 | 1 | 5 |
| Leiria | 32.7 | 4 | 35.6 | 4 | 9.5 | 1 | 16.2 | 2 | 11 |
| Lisbon | 35.8 | 21 | 21.8 | 13 | 25.3 | 15 | 11.7 | 7 | 56 |
| Madeira | 24.4 | 1 | 56.2 | 4 | 2.8 | - | 8.2 | - | 5 |
| Portalegre | 38.5 | 2 | 19.1 | 1 | 28.7 | 1 | 7.5 | - | 4 |
| Porto | 43.0 | 18 | 26.2 | 10 | 13.6 | 5 | 12.5 | 5 | 38 |
| Santarém | 38.4 | 5 | 24.7 | 3 | 20.0 | 3 | 10.0 | 1 | 12 |
| Setúbal | 30.6 | 6 | 12.7 | 2 | 45.8 | 8 | 5.1 | 1 | 17 |
| Viana do Castelo | 32.5 | 2 | 32.6 | 3 | 9.9 | - | 18.4 | 1 | 6 |
| Vila Real | 32.3 | 2 | 42.0 | 3 | 5.4 | - | 12.7 | 1 | 6 |
| Viseu | 30.9 | 4 | 36.6 | 4 | 4.6 | - | 20.7 | 2 | 10 |
| Europe | 33.6 | 1 | 31.2 | 1 | 17.1 | - | 11.1 | - | 2 |
| Rest of the World | 7.0 | - | 48.2 | 1 | 2.8 | - | 34.1 | 1 | 2 |
| Total | 36.1 | 101 | 27.2 | 75 | 18.1 | 44 | 12.6 | 30 | 250 |
| Source: Comissão Nacional de Eleições | |||||||||
References
External links
See also
| Presidential elections | |
|---|---|
| Parliamentary elections |
|
| Local elections | |
| European elections | |
| Referendums | |
| |