Oxford City Council election, 2010
Elections for Oxford City Council were held on Thursday 6 May 2010.[1] As Oxford City Council is elected by halves, one seat in each of the 24 wards was up for election.
Labour gained 2 seats (Barton and Sandhills ward from the Liberal Democrats and Northfield Brook ward from the Independent Working Class Association), the Liberal Democrats also gained two seats (Carfax and St Clement's ward, both from the Green Party). As a result of this election, Labour gained control of the city council, with 25 out of 48 seats.
A general election was held on the same day, which accounts for the higher turnout (61.7%).
Election results
| Oxford Local Election Result 2010 | ||||||||||
|---|---|---|---|---|---|---|---|---|---|---|
| Party | Seats | Gains | Losses | Net gain/loss | Seats % | Votes % | Votes | +/− | ||
| Labour | 13 | 2 | 0 | +2 | 54.2 | 34.5 | 23,716 | −0.1 | ||
| Liberal Democrat | 9 | 2 | 1 | +1 | 37.5 | 30.6 | 21,038 | +7.8 | ||
| Green | 2 | 0 | 2 | −2 | 8.3 | 14.0 | 9,637 | −2.9 | ||
| Conservative | 0 | 0 | 0 | 0 | 0 | 19.6 | 13,490 | −0.6 | ||
| UKIP | 0 | 0 | 0 | 0 | 0 | 0.2 | 136 | N/A | ||
| Independent | 0 | 0 | 0 | 0 | 0 | 1.0 | 671 | −0.6 | ||
Note: one Independent is standing in 2010, compared with three in 2008 and two in 2006. No candidates representing the Independent Working Class Association are standing in this election. No UKIP candidates were standing in 2008.
This result has the following consequences for the total number of seats on the Council after the elections:
| Party | Previous council | Staying councillors | Seats up for election | Election result | New council | |
|---|---|---|---|---|---|---|
| Labour | 23 | 12 | 11 | 13 | 25 | |
| Liberal Democrats | 16 | 8 | 8 | 9 | 17 | |
| Green | 7 | 3 | 4 | 2 | 5 | |
| Independent Working Class | 2 | 1 | 1 | 0 | 1 | |
| Conservatives | 0 | 0 | 0 | 0 | 0 | |
| UKIP | 0 | 0 | 0 | 0 | 0 | |
| Independent | 0 | 0 | 0 | 0 | 0 | |
| Total | 48 | 24 | 24 | 24 | 48 | |
Results by ward

Note: Gains and holds of wards are noted with respect to the 2006 council election (or a by-election of the same seat). Percentage changes are given with respect to the 2008 council election (or the latest by-election).
Turnout figures are the sum of the votes for each candidate only and do not yet include rejected ballots. These numbers will be included in the sum when available.
Barton and Sandhills
| Party | Candidate | Votes | % | ± | |
|---|---|---|---|---|---|
| Labour | Van Coulter | 1,239 | 42.7 | +8.7 | |
| Liberal Democrat | Barry Crossman | 815 | 28.1 | −6.2 | |
| Conservative | Timothy Hamer | 661 | 22.8 | −3.6 | |
| Green | Raymond Hitchins | 188 | 6.5 | +1.2 | |
| Turnout | 2,903 | ||||
| Labour gain from Liberal Democrat | Swing | ||||
Blackbird Leys
| Party | Candidate | Votes | % | ± | |
|---|---|---|---|---|---|
| Labour | Rae Humberstone | 1,510 | 69.5 | +15.2 | |
| Conservative | Elizabeth Mills | 299 | 13.8 | +7.2 | |
| Liberal Democrat | Mark Wheeler | 270 | 12.4 | +10.7 | |
| Green | Jackie Chandler-Oatts | 93 | 4.3 | +1.9 | |
| Turnout | 2,172 | ||||
| Labour hold | Swing | ||||
Carfax
| Party | Candidate | Votes | % | ± | |
|---|---|---|---|---|---|
| Liberal Democrat | Tony Brett | 985 | 37.6 | +1.9 | |
| Green | Vincent Larochelle | 565 | 21.6 | +1.8 | |
| Labour | Joe Ottaway | 535 | 20.4 | +3.1 | |
| Conservative | Patricia Jones | 535 | 20.4 | −6.7 | |
| Turnout | 2,620 | ||||
| Liberal Democrat gain from Green | Swing | ||||
Churchill
| Party | Candidate | Votes | % | ± | |
|---|---|---|---|---|---|
| Labour | Joe McManners | 1,168 | 47.6 | +5.9 | |
| Liberal Democrat | Peter Bonney | 629 | 25.6 | +9.5 | |
| Conservative | Jonathan Asbridge | 469 | 19.1 | +6.9 | |
| Green | Julian Faultless | 187 | 7.6 | +4.3 | |
| Turnout | 2,453 | ||||
| Labour hold | Swing | ||||
Cowley
| Party | Candidate | Votes | % | ± | |
|---|---|---|---|---|---|
| Labour | Shah Khan | 1,264 | 45.9 | −2.3 | |
| Liberal Democrat | Qasim Aziz | 601 | 21.8 | +6.2 | |
| Conservative | Judith Harley | 506 | 18.4 | +1.0 | |
| Green | Clare Valerie | 385 | 14.0 | +1.5 | |
| Turnout | 2,756 | ||||
| Labour hold | Swing | ||||
Note that Shah Khan won the Cowley seat in the 2006 elections for the Liberal Democrats, but crossed the floor to Labour in 2007. So when comparing to the 2006 elections, Labour gain from Liberal Democrats.
Cowley Marsh
| Party | Candidate | Votes | % | ± | |
|---|---|---|---|---|---|
| Labour | Mohammed Abbasi | 1,124 | 39.8 | −11.6 | |
| Conservative | Clara Bantry White | 816 | 28.9 | +20.2 | |
| Liberal Democrat | Shah Nawaz | 467 | 16.5 | −13.2 | |
| Green | John Kentish | 415 | 14.7 | +4.5 | |
| Turnout | 2,822 | ||||
| Labour hold | Swing | ||||
Headington
| Party | Candidate | Votes | % | ± | |
|---|---|---|---|---|---|
| Liberal Democrat | David Rundle | 1,297 | 44.6 | +9.2 | |
| Labour | Jane Darke | 761 | 26.2 | +9.5 | |
| Conservative | Paul Hernandez | 572 | 19.7 | −14.7 | |
| Green | Jill Haas | 275 | 9.5 | −4.0 | |
| Turnout | 2,905 | ||||
| Liberal Democrat hold | Swing | ||||
Headington Hill and Northway
| Party | Candidate | Votes | % | ± | |
|---|---|---|---|---|---|
| Liberal Democrat | Mohammed Altaf-Khan | 1,054 | 41.7 | +15.3 | |
| Labour | Jamila Azad | 733 | 29.0 | −9.3 | |
| Conservative | Siddo Deva | 521 | 20.6 | −10.4 | |
| Green | Chris Brewer | 218 | 8.6 | +4.3 | |
| Turnout | 2,526 | ||||
| Liberal Democrat hold | Swing | ||||
Note: ±% figures are calculated with respect to the results of the by-election of 26 March 2009.
Hinksey Park
| Party | Candidate | Votes | % | ± | |
|---|---|---|---|---|---|
| Labour | Bob Price | 1,530 | 48.9 | −3.3 | |
| Liberal Democrat | John Pinfold | 681 | 21.8 | +10.7 | |
| Conservative | Simon Mort | 501 | 16.0 | +2.7 | |
| Green | Chip Sherwood | 417 | 13.3 | −10.1 | |
| Turnout | 3,129 | ||||
| Labour hold | Swing | ||||
Holywell
| Party | Candidate | Votes | % | ± | |
|---|---|---|---|---|---|
| Liberal Democrat | Mark Mills | 1,073 | 38.9 | −1.5 | |
| Green | Sophie Lewis | 621 | 22.5 | +7.0 | |
| Conservative | Frances Kennett | 583 | 21.2 | −2.9 | |
| Labour | Alistair Strathern | 478 | 17.4 | −2.6 | |
| Turnout | 2,755 | ||||
| Liberal Democrat hold | Swing | ||||
Note: ±% figures are calculated with respect to the results of the by-election of 12 June 2008.
Iffley Fields
| Party | Candidate | Votes | % | ± | |
|---|---|---|---|---|---|
| Green | David Williams | 1,094 | 37.2 | −21.4 | |
| Labour | Mike Rowley | 889 | 30.3 | −0.2 | |
| Liberal Democrat | Doug Hale | 667 | 22.7 | N/A | |
| Conservative | Carolyn Ten Holter | 288 | 9.8 | −1.1 | |
| Turnout | 2,938 | ||||
| Green hold | Swing | ||||
Jericho and Osney
| Party | Candidate | Votes | % | ± | |
|---|---|---|---|---|---|
| Labour | Susanna Pressel | 1,793 | 53.0 | −0.2 | |
| Liberal Democrat | Catherine Hilliard | 769 | 22.7 | +5.1 | |
| Conservative | Bill Wilson | 513 | 15.2 | +2.5 | |
| Green | Kaihsu Tai | 311 | 9.2 | −7.3 | |
| Turnout | 3,386 | ||||
| Labour hold | Swing | ||||
Littlemore
| Party | Candidate | Votes | % | ± | |
|---|---|---|---|---|---|
| Labour | Gill Sanders | 1,299 | 47.8 | −2.9 | |
| Liberal Democrat | Dorian Hancock | 641 | 23.6 | +12.8 | |
| Conservative | Yvonne Lowe | 585 | 21.5 | −3.3 | |
| Green | Jenny Nicholson | 191 | 7.0 | −6.7 | |
| Turnout | 2,716 | ||||
| Labour hold | Swing | ||||
Lye Valley
| Party | Candidate | Votes | % | ± | |
|---|---|---|---|---|---|
| Labour | Ben Lloyd-Shogbesan | 1,320 | 44.9 | −15.1 | |
| Liberal Democrat | Faisal Aziz | 697 | 23.7 | +14.8 | |
| Conservative | Allen Mills | 647 | 22.0 | +1.1 | |
| Green | Anna Pickering | 275 | 9.4 | −0.8 | |
| Turnout | 2,939 | ||||
| Labour hold | Swing | ||||
Marston
| Party | Candidate | Votes | % | ± | |
|---|---|---|---|---|---|
| Labour | Mary Clarkson | 1,292 | 38.9 | +4.4 | |
| Independent | Mick Haines | 671 | 20.2 | −0.4 | |
| Liberal Democrat | Farida Anwar | 622 | 18.7 | −6.9 | |
| Conservative | Duncan Hatfield | 468 | 14.1 | −0.1 | |
| Green | Alistair Morris | 272 | 8.2 | +3.1 | |
| Turnout | 3,325 | ||||
| Labour hold | Swing | ||||
North
| Party | Candidate | Votes | % | ± | |
|---|---|---|---|---|---|
| Liberal Democrat | Alan Armitage | 1,303 | 44.6 | +7.4 | |
| Conservative | Mark Hanson | 715 | 24.5 | −5.8 | |
| Labour | Michael Boyd | 489 | 16.7 | +1.9 | |
| Green | Peter Furtado | 413 | 14.1 | −3.6 | |
| Turnout | 2,920 | ||||
| Liberal Democrat hold | Swing | ||||
Northfield Brook
| Party | Candidate | Votes | % | ± | |
|---|---|---|---|---|---|
| Labour | Scott Seamons | 1,264 | |||
| Liberal Democrat | Rosemary Morlin | 503 | |||
| Conservative | 419 | ||||
| Green | Alyson Duckmanton | 140 | |||
| Turnout | 2,326 | ||||
| Labour gain from Independent Working Class | Swing | ||||
Quarry and Risinghurst
| Party | Candidate | Votes | % | ± | |
|---|---|---|---|---|---|
| Labour | Dee Sinclair | 1,276 | |||
| Liberal Democrat | Gavin Baylis | 938 | |||
| Conservative | Tia Macgregor | 733 | |||
| Green | Sue Tibbles | 207 | |||
| UKIP | Julia Gasper | 136 | |||
| Turnout | 3,290 | ||||
| Labour hold | Swing | ||||
Rose Hill and Iffley
| Party | Candidate | Votes | % | ± | |
|---|---|---|---|---|---|
| Labour | Antonia Bance | 1,356 | 50.3 | ||
| Liberal Democrat | John Wilde | 619 | 23.0 | ||
| Conservative | Moznu Miah | 438 | 16.2 | ||
| Green | Rachel Bottley | 284 | 10.5 | ||
| Turnout | 2,697 | ||||
| Labour hold | Swing | ||||
St. Clement's
| Party | Candidate | Votes | % | ± | |
|---|---|---|---|---|---|
| Liberal Democrat | Graham Jones | 898 | |||
| Green | Mary-Jane Sareva | 884 | |||
| Labour | Sabir Mirza | 762 | |||
| Conservative | Neil Prestidge | 500 | |||
| Turnout | 3,044 | ||||
| Liberal Democrat gain from Green | Swing | ||||
St. Margaret's
| Party | Candidate | Votes | % | ± | |
|---|---|---|---|---|---|
| Liberal Democrat | Jim Campbell | 1,390 | 49.0 | +15.6 | |
| Conservative | Vernon Porter | 727 | 25.6 | −1.3 | |
| Green | Hafiz Ladell | 384 | 13.5 | −14.3 | |
| Labour | James Fry | 335 | 11.8 | −0.2 | |
| Turnout | 2,836 | ||||
| Liberal Democrat hold | Swing | ||||
St. Mary's
| Party | Candidate | Votes | % | ± | |
|---|---|---|---|---|---|
| Green | Dick Wolff | 824 | |||
| Liberal Democrat | Peter Sloman | 745 | |||
| Labour | Pat Kennedy | 631 | |||
| Conservative | George Saliagopoulos | 342 | |||
| Turnout | 2,542 | ||||
| Green hold | Swing | ||||
Summertown
| Party | Candidate | Votes | % | ± | |
|---|---|---|---|---|---|
| Liberal Democrat | Jean Fooks | 1,613 | |||
| Conservative | Laura Goodchild | 904 | |||
| Green | Ann Duncan | 498 | |||
| Labour | Tom Watts | 321 | |||
| Turnout | 3,336 | ||||
| Liberal Democrat hold | Swing | ||||
Wolvercote
| Party | Candidate | Votes | % | ± | |
|---|---|---|---|---|---|
| Liberal Democrat | John Goddard | 1,412 | 42.0 | ||
| Conservative | Jonathan Gittos | 1,149 | 34.3 | ||
| Green | Oliver Tickell | 444 | 13.3 | ||
| Labour | Michael Taylor | 347 | 10.4 | ||
| Turnout | 3,352 | ||||
| Liberal Democrat hold | Swing | ||||
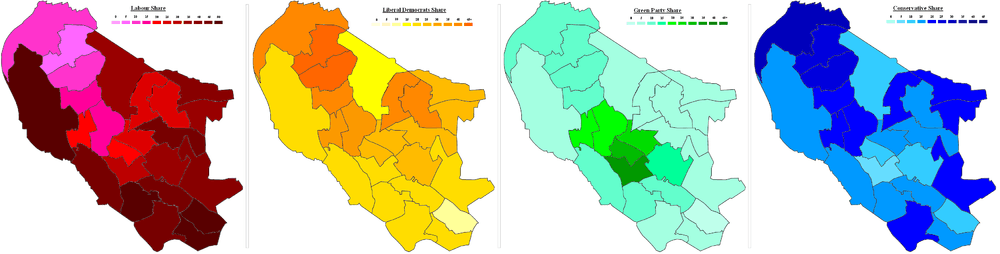
Party Share of Vote Map