Oxford City Council elections

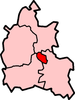
Wards for the local elections from 2002
Oxford City Council in Oxford, England is elected every two years, with half of the 48 seats in the City Council up for election on each occasion. Elections are held in even-numbered years; the next is due to take place in 2016. Until 2002 the council was elected by thirds.
As vacancies arise between elections, by-elections are held to elect a replacement councillor.
Council elections
- Oxford City Council election, 1973
- Oxford City Council election, 1976
- Oxford City Council election, 1979 (New ward boundaries)[1]
- Oxford City Council election, 1980
- Oxford City Council election, 1982
- Oxford City Council election, 1983
- Oxford City Council election, 1984
- Oxford City Council election, 1986
- Oxford City Council election, 1987
- Oxford City Council election, 1988
- Oxford City Council election, 1990
- Oxford City Council election, 1991 (Some new ward boundaries & city boundary changes also took place)[2]
- Oxford City Council election, 1992
- Oxford City Council election, 1994
- Oxford City Council election, 1995
- Oxford City Council election, 1996
- Oxford City Council election, 1998
- Oxford City Council election, 1999
- Oxford City Council election, 2000
- Oxford City Council election, 2002 (New ward boundaries)[3]
- Oxford City Council election, 2004
- Oxford City Council election, 2006
- Oxford City Council election, 2008
- Oxford City Council election, 2010
- Oxford City Council election, 2012
- Oxford City Council election, 2014
- Oxford City Council election, 2016
Political control
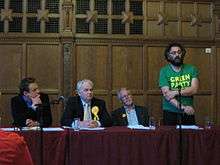
Political group leaders and senior politicians for the Oxford City Council (outgoing council at the election in 2010). From left to right: Jonathan Gittos candidate for the Conservatives, Councillor Stephen Brown leader of the political group of Liberal Democrats, Councillor John Tanner senior member of the Labour group, Councillor Craig Simmons leader of the Green group.
Since the foundation of the council, political control of the council has been held by the following parties:[4]
| Years | Party | |
|---|---|---|
| 2010–present | Labour | |
| 2004–2010 | No overall control | |
| 2002–2004 | Labour | |
| 2000–2002 | No overall control | |
| 1980–2000 | Labour | |
| 1976–1980 | Conservative | |
| 1973–1976 | Labour | |
By-election results
| Party | Candidate | Votes | % | ± | |
|---|---|---|---|---|---|
| Labour | Chewe Munkonge | 782 | 42.3 | -1.3 | |
| Liberal Democrat | Roz Smith | 615 | 33.2 | +7.8 | |
| Conservative | Katharine Harborne | 222 | 12.0 | -7.2 | |
| Green | Liz Taylor | 186 | 10.0 | -1.7 | |
| English Democrat | Julia Gasper | 43 | 2.3 | +2.3 | |
| Majority | 167 | 9.1 | |||
| Turnout | 1848 | 38 | |||
| Labour hold | Swing | ||||
| Party | Candidate | Votes | % | ± | |
|---|---|---|---|---|---|
| Labour | Alex Hollingsworth | 168 | 44.2 | +11.9 | |
| Liberal Democrat | Tony Brett | 101 | 26.6 | +3.3 | |
| Green | Richard Scrase | 63 | 16.6 | -9.8 | |
| Conservative | Maryam Ahmed | 24 | 6.3 | -11.6 | |
| UKIP | Kenrick Bird | 24 | 6.3 | +6.3 | |
| Majority | 67 | 17.6 | |||
| Turnout | 380 | 8.6 | |||
| Labour hold | Swing | ||||
| Party | Candidate | Votes | % | ± | |
|---|---|---|---|---|---|
| Labour | David Henwood | 512 | 39.4 | -11.9 | |
| Green | Hazel Dawe | 269 | 20.7 | -2.1 | |
| Independent | Artwell | 257 | 19.8 | +19.8 | |
| Conservative | Katharine Harborne | 152 | 11.7 | -4.5 | |
| UKIP | Ian Macdonald | 72 | 5.5 | +5.5 | |
| Liberal Democrat | Prakash Sharma | 39 | 3.0 | -13.2 | |
| Majority | 243 | 18.7 | |||
| Turnout | 1301 | 28 | |||
| Labour hold | Swing | ||||
| Party | Candidate | Votes | % | ± | |
|---|---|---|---|---|---|
| Labour | Louise Upton | 367 | 34.7 | +18.0 | |
| Liberal Democrat | Tim Bearder | 330 | 31.2 | -13.4 | |
| Green | Sushila Dhall | 262 | 24.7 | +10.6 | |
| Conservative | John Walsh | 100 | 9.4 | -15.1 | |
| Majority | 37 | 3.5 | |||
| Turnout | 1059 | 23 | |||
| Labour gain from Liberal Democrat | Swing | ||||
| Party | Candidate | Votes | % | ± | |
|---|---|---|---|---|---|
| Labour | Roy Darke | 548 | 38.3 | +2.0 | |
| Conservative | Marc Borja | 443 | 31.0 | -2.6 | |
| Liberal Democrat | Ruth Beer | 378 | 26.4 | +2.4 | |
| Green | Katherine Wedell | 62 | 4.3 | -1.8 | |
| Majority | 105 | 7.3 | |||
| Turnout | 1431 | 32.9 | +1.7 | ||
| Labour hold | Swing | ||||
| Party | Candidate | Votes | % | ± | |
|---|---|---|---|---|---|
| Liberal Democrat | Mark Mills | 188 | 40.4 | -5.0 | |
| Conservative | Paul Sargent | 112 | 24.1 | +1.6 | |
| Labour | Sarah Hutchinson | 93 | 20.0 | +6.4 | |
| Green | Chip Sherwood | 72 | 15.5 | -3.0 | |
| Majority | 76 | 16.3 | |||
| Turnout | 465 | 11.7 | −15.2 | ||
| Liberal Democrat hold | Swing | ||||
| Party | Candidate | Votes | % | ± | |
|---|---|---|---|---|---|
| Labour | Bob Timbs | 784 | 52.8 | +8.4 | |
| Liberal Democrat | Nathan Pyle | 487 | 32.8 | -10.2 | |
| Conservative | Judith Harley | 150 | 10.1 | +10.1 | |
| Green | Larry Sanders | 64 | 4.3 | -8.4 | |
| Majority | 297 | 20.0 | |||
| Turnout | 1,485 | 31.0 | |||
| Labour hold | Swing | ||||
| Party | Candidate | Votes | % | ± | |
|---|---|---|---|---|---|
| Labour | Oscar Van Nooijen | 676 | 45.6 | -3.2 | |
| Green | Lilian Sherwood | 436 | 29.4 | -0.6 | |
| Liberal Democrat | Nathan Pyle | 217 | 14.6 | +5.7 | |
| Conservative | Caroline Ten Holter | 155 | 10.4 | -1.8 | |
| Majority | 240 | 16.2 | |||
| Turnout | 1,484 | 33.5 | |||
| Labour hold | Swing | ||||
| Party | Candidate | Votes | % | ± | |
|---|---|---|---|---|---|
| Labour | Colin Cook | 713 | 44.0 | +10.7 | |
| Liberal Democrat | John Ballance | 437 | 27.0 | -12.1 | |
| Green | Athene Reiss | 355 | 21.9 | +6.6 | |
| Conservative | Patricia Jones | 115 | 7.1 | -5.2 | |
| Majority | 276 | 17.0 | |||
| Turnout | 1,620 | 33.1 | |||
| Labour gain from Liberal Democrat | Swing | ||||
| Party | Candidate | Votes | % | ± | |
|---|---|---|---|---|---|
| Labour | Carole Roberts | 592 | 54.7 | +8.2 | |
| Independent Working Class | Delvise Saunders | 300 | 27.7 | -12.8 | |
| Liberal Democrat | Rosemary Morlin | 141 | 13.0 | +5.0 | |
| Conservative | Patricia Jones | 31 | 2.9 | -2.9 | |
| Green | Susan Tibbles | 19 | 1.7 | -3.3 | |
| Majority | 451 | 27.0 | |||
| Turnout | 1,083 | 26.1 | |||
| Labour hold | Swing | ||||
| Party | Candidate | Votes | % | ± | |
|---|---|---|---|---|---|
| Labour | Rae Humberstone | 969 | 50.0 | ||
| Independent Working Class | Kelly Webster | 566 | 29.2 | ||
| Conservative | Stuart Hand | 176 | 9.1 | ||
| Liberal Democrat | Nathan Pyle | 172 | 8.9 | ||
| Green | Susan Tibbles | 54 | 2.8 | ||
| Majority | 403 | 20.8 | |||
| Turnout | 1,937 | 48.6 | |||
| Labour hold | Swing | ||||
| Party | Candidate | Votes | % | ± | |
|---|---|---|---|---|---|
| Green | Sushila Dhall | 203 | 33.3 | -3.6 | |
| Liberal Democrat | Pamela Bones | 175 | 28.7 | -2.5 | |
| Labour | Bill Turner | 161 | 26.4 | +7.9 | |
| Conservative | Michael Davis | 71 | 11.6 | -1.8 | |
| Majority | 28 | 4.6 | |||
| Turnout | 610 | 14.9 | |||
| Green hold | Swing | ||||
| Party | Candidate | Votes | % | ± | |
|---|---|---|---|---|---|
| Labour | Molly Florey | 634 | 69.4 | +8.0 | |
| Liberal Democrat | Bernard Gowers | 138 | 15.1 | +5.1 | |
| Conservative | David Brown | 103 | 11.3 | -7.2 | |
| Green | Patricia Dickson | 38 | 4.2 | -5.8 | |
| Majority | 496 | 54.3 | |||
| Turnout | 913 | 11.3 | |||
| Labour hold | Swing | ||||
| Party | Candidate | Votes | % | ± | |
|---|---|---|---|---|---|
| Liberal Democrat | Antony Brett | 1,165 | 33.4 | ||
| Green | Paul Williams | 995 | 28.5 | ||
| Conservative | Richard Sage | 692 | 19.8 | ||
| Labour | Joel Brookfield | 635 | 18.2 | ||
| Majority | 170 | 4.9 | |||
| Turnout | 3,487 | ||||
| Liberal Democrat gain from Green | Swing | ||||
| Party | Candidate | Votes | % | ± | |
|---|---|---|---|---|---|
| Liberal Democrat | 719 | 43.7 | -7.1 | ||
| Labour | 506 | 30.7 | +2.8 | ||
| Conservative | 352 | 21.4 | +3.8 | ||
| Green | 69 | 4.2 | +0.5 | ||
| Majority | 213 | 13.0 | |||
| Turnout | 1,646 | 33.0 | |||
| Liberal Democrat hold | Swing | ||||
| Party | Candidate | Votes | % | ± | |
|---|---|---|---|---|---|
| Labour | 512 | 32.7 | -12.8 | ||
| Liberal Democrat | 511 | 32.6 | +14.3 | ||
| Green | 405 | 25.8 | +3.7 | ||
| Conservative | 139 | 8.9 | -5.2 | ||
| Majority | 1 | 0.1 | |||
| Turnout | 1,567 | 26.8 | |||
| Labour hold | Swing | ||||
| Party | Candidate | Votes | % | ± | |
|---|---|---|---|---|---|
| Liberal Democrat | 780 | 50.2 | +21.7 | ||
| Labour | 462 | 29.7 | -8.4 | ||
| Conservative | 259 | 16.7 | -10.0 | ||
| Green | 54 | 3.5 | -3.2 | ||
| Majority | 318 | 20.5 | |||
| Turnout | 1,555 | 25.5 | |||
| Liberal Democrat gain from Labour | Swing | ||||
| Party | Candidate | Votes | % | ± | |
|---|---|---|---|---|---|
| Liberal Democrat | 478 | 41.9 | +30.5 | ||
| Labour | 385 | 33.7 | -24.6 | ||
| Conservative | 222 | 19.5 | -4.8 | ||
| Green | 56 | 5.0 | -1.1 | ||
| Majority | 93 | 8.2 | |||
| Turnout | 1,141 | 23.0 | |||
| Liberal Democrat gain from Labour | Swing | ||||
See also
References
- ↑ The City of Oxford (Electoral Arrangements) Order 1977
- ↑ legislation.gov.uk - The Oxfordshire (District Boundaries) Order 1991. Retrieved on 6 November 2015.
- ↑ legislation.gov.uk - The City of Oxford (Electoral Changes) Order 2001. Retrieved on 4 October 2015.
- ↑ "Oxford". BBC News Online. 19 April 2008. Retrieved 2009-09-15.
- ↑ "Elections results". Oxford City Council. 2014-09-19. Retrieved 2014-09-19.
- 1 2 "Elections results". Oxford City Council. 2014-09-09. Retrieved 2014-09-09.
- ↑ "Labour win in Oxford City Council by-election". Oxford Mail. 2013-09-19. Retrieved 2013-09-21.
- ↑ "Labour holds Headington Hill and Northway seat". Oxford Mail. 2009-03-27. Retrieved 2009-09-15.
- ↑ "Low turnout for by-election". Oxford Mail. 2008-06-13. Retrieved 2009-09-15.
- 1 2 3 4 5 6 7 8 "Election results". Oxford City Council. Archived from the original on June 7, 2009. Retrieved 2009-09-15.
External links
The City of Oxford | ||
|---|---|---|
| Wards, suburbs, neighbourhoods and districts |
|  |
| Civil parishes | ||
| Former district and borough | ||
| Former constituencies | ||
This article is issued from Wikipedia - version of the 9/7/2016. The text is available under the Creative Commons Attribution/Share Alike but additional terms may apply for the media files.