West Oxfordshire District Council election, 2004
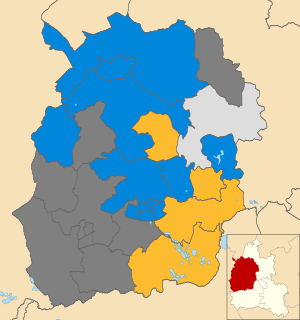
The 2004 West Oxfordshire District Council election took place on 10 June 2004 to elect members of West Oxfordshire District Council in Oxfordshire, England. One third of the council was up for election and the Conservative party stayed in overall control of the council.[1]
After the election, the composition of the council was
- Conservative 29
- Liberal Democrats 13
- Independent 6
- Labour 1[2]
Background
After the last election in 2003 the Conservatives controlled the council with 29 seats, while the Liberal Democrats had 12, there were six independent councillors and the Labour party had two seats.[3] A total of 54 candidates stood for the 17 seats up for election in 2004, comprising 16 each for the Conservatives and Liberal Democrats, 11 Labour candidates, nine Green party and two independents.[4]
Election result
The Conservatives remained in control of the council with 29 councillors, after winning 12 of the 17 seats contested.[5] 13 of the 14 councillors who were standing again were re-elected, with only Conservative councillor James Mills losing his seat in Standlake, Aston and Stanton Harcourt ward to Liberal Democrat Elisabeth Bickley.[4] The Liberal Democrats took four seats and therefore finished with 13 councillors on the council.,[5] while all three members of the Conservative council cabinet were re-elected, including the council leader Barry Norton in North Leigh ward.[6]
Conservative Andrew Creery also gained one seat in Witney Central from Labour, after the Labour councillor for the previous 30 years, Ted Cooper, stood down at the election.[6] This reduced Labour to its worst ever position on the council with just one councillor.[6] Meanwhile, independent councillor Derrick Millard retained his seat in Stonesfield and Tackley, to mean there remained six independent councillors.[4] Overall turnout at the election was 45.19%.[4]
| West Oxfordshire local election result 2004[4][7] | ||||||||||
|---|---|---|---|---|---|---|---|---|---|---|
| Party | Seats | Gains | Losses | Net gain/loss | Seats % | Votes % | Votes | +/− | ||
| Conservative | 12 | 1 | 1 | 0 | 70.6 | 46.5 | 10,996 | +7.9% | ||
| Liberal Democrat | 4 | 1 | 0 | +1 | 23.5 | 30.4 | 7,180 | -0.1% | ||
| Independent | 1 | 0 | 0 | 0 | 5.9 | 5.8 | 1,360 | -8.2% | ||
| Labour | 0 | 0 | 1 | -1 | 0 | 10.2 | 2,419 | -1.0% | ||
| Green | 0 | 0 | 0 | 0 | 0 | 7.1 | 1,686 | +2.3% | ||
Ward results
| Party | Candidate | Votes | % | ± | |
|---|---|---|---|---|---|
| Conservative | Terence Owen | 499 | 66.0 | +0.5 | |
| Liberal Democrat | Elizabeth Leffman | 152 | 20.1 | -14.4 | |
| Labour | Georgina Burrows | 105 | 13.9 | +13.9 | |
| Majority | 347 | 45.9 | +15.0 | ||
| Turnout | 756 | 49.9 | +9.9 | ||
| Conservative hold | Swing | ||||
| Party | Candidate | Votes | % | ± | |
|---|---|---|---|---|---|
| Liberal Democrat | Glena Chadwick | 985 | 66.7 | +4.5 | |
| Conservative | Ian Lyne | 491 | 33.3 | +33.3 | |
| Majority | 494 | 33.5 | +3.9 | ||
| Turnout | 1,476 | 50.9 | +9.7 | ||
| Liberal Democrat hold | Swing | ||||
| Party | Candidate | Votes | % | ± | |
|---|---|---|---|---|---|
| Conservative | Michael Howes | 964 | 49.0 | +9.5 | |
| Labour | Mark Walker | 478 | 24.3 | -22.3 | |
| Liberal Democrat | Elizabeth Allen | 363 | 18.4 | +4.4 | |
| Green | Rachel Griffiths | 163 | 8.3 | +8.3 | |
| Majority | 486 | 24.7 | |||
| Turnout | 1,968 | 44.1 | +8.2 | ||
| Conservative hold | Swing | ||||
| Party | Candidate | Votes | % | ± | |
|---|---|---|---|---|---|
| Liberal Democrat | Margaret Stevens | 1,045 | 54.8 | -3.0 | |
| Conservative | Frances Pike | 662 | 34.7 | +0.4 | |
| Green | Xanthe Bevis | 201 | 10.5 | +2.6 | |
| Majority | 383 | 20.1 | -3.3 | ||
| Turnout | 1,908 | 43.0 | +10.5 | ||
| Liberal Democrat hold | Swing | ||||
| Party | Candidate | Votes | % | ± | |
|---|---|---|---|---|---|
| Liberal Democrat | Stuart Brooks | 935 | 55.9 | ||
| Conservative | Jill Dunsmore | 737 | 44.1 | ||
| Majority | 198 | 11.8 | |||
| Turnout | 1,672 | 52.1 | +6.0 | ||
| Liberal Democrat hold | Swing | ||||
| Party | Candidate | Votes | % | ± | |
|---|---|---|---|---|---|
| Conservative | Simon Hoare | 942 | 68.3 | +3.3 | |
| Liberal Democrat | Malcolm West | 306 | 22.2 | -12.8 | |
| Labour | William Tumbridge | 131 | 9.5 | +9.5 | |
| Majority | 636 | 46.1 | +16.0 | ||
| Turnout | 1,379 | 44.9 | +8.6 | ||
| Conservative hold | Swing | ||||
| Party | Candidate | Votes | % | ± | |
|---|---|---|---|---|---|
| Conservative | Anthony Walker | 899 | 62.1 | +1.2 | |
| Liberal Democrat | Christopher Tatton | 286 | 19.8 | -0.2 | |
| Labour | Melanie Deans | 262 | 18.1 | -0.9 | |
| Majority | 613 | 42.4 | +1.5 | ||
| Turnout | 1,447 | 46.0 | +11.3 | ||
| Conservative hold | Swing | ||||
| Party | Candidate | Votes | % | ± | |
|---|---|---|---|---|---|
| Conservative | Jeffrey Haine | 571 | 74.2 | -2.2 | |
| Liberal Democrat | John Lilly | 199 | 25.8 | +2.2 | |
| Majority | 372 | 48.3 | -4.5 | ||
| Turnout | 770 | 49.2 | +5.4 | ||
| Conservative hold | Swing | ||||
| Party | Candidate | Votes | % | ± | |
|---|---|---|---|---|---|
| Conservative | Barry Norton | 513 | 60.2 | ||
| Liberal Democrat | Philip Workman | 200 | 23.5 | ||
| Labour | Helen Bridge | 139 | 16.3 | ||
| Majority | 313 | 36.7 | |||
| Turnout | 852 | 56.3 | |||
| Conservative hold | Swing | ||||
| Party | Candidate | Votes | % | ± | |
|---|---|---|---|---|---|
| Liberal Democrat | Elisabeth Bickley | 831 | 51.7 | ||
| Conservative | James Mills | 775 | 48.3 | ||
| Majority | 56 | 3.5 | |||
| Turnout | 1,606 | 52.1 | +9.0 | ||
| Liberal Democrat gain from Conservative | Swing | ||||
| Party | Candidate | Votes | % | ± | |
|---|---|---|---|---|---|
| Independent | Derrick Millard | 1,060 | 69.3 | -0.6 | |
| Liberal Democrat | Gillian Workman | 249 | 16.3 | -0.2 | |
| Green | Susan Turnbull | 220 | 14.4 | +0.8 | |
| Majority | 811 | 53.0 | -0.5 | ||
| Turnout | 1,529 | 48.8 | +12.8 | ||
| Independent hold | Swing | ||||
| Party | Candidate | Votes | % | ± | |
|---|---|---|---|---|---|
| Conservative | Andrew Creery | 524 | 42.9 | +14.2 | |
| Labour | Richard Kelsall | 339 | 27.7 | +2.8 | |
| Liberal Democrat | June Taylor | 217 | 17.8 | +4.6 | |
| Green | Sandra Simpson | 142 | 11.6 | +8.4 | |
| Majority | 185 | 15.1 | |||
| Turnout | 1,222 | 41.1 | +1.7 | ||
| Conservative gain from Labour | Swing | ||||
| Party | Candidate | Votes | % | ± | |
|---|---|---|---|---|---|
| Conservative | Frank Smith | 710 | 49.4 | +16.8 | |
| Liberal Democrat | Peter Madden | 341 | 23.7 | -27.2 | |
| Green | Enid Dossett-Davies | 218 | 15.2 | +9.3 | |
| Labour | Raymond Harris | 169 | 11.8 | +1.3 | |
| Majority | 369 | 25.7 | |||
| Turnout | 1,438 | 38.3 | +6.8 | ||
| Conservative hold | Swing | ||||
| Party | Candidate | Votes | % | ± | |
|---|---|---|---|---|---|
| Conservative | Martin Chapman | 569 | 45.2 | +6.7 | |
| Green | Richard Dossett-Davies | 324 | 25.7 | +5.9 | |
| Liberal Democrat | Paul Slamin | 239 | 19.0 | -22.7 | |
| Labour | Diana Kelsall | 128 | 10.2 | +10.2 | |
| Majority | 245 | 19.4 | |||
| Turnout | 1,260 | 41.1 | +6.4 | ||
| Conservative hold | Swing | ||||
| Party | Candidate | Votes | % | ± | |
|---|---|---|---|---|---|
| Conservative | Peter Green | 863 | 52.7 | +21.7 | |
| Labour | Phillip Edney | 317 | 19.3 | +2.3 | |
| Liberal Democrat | Olive Minett | 282 | 17.2 | +6.6 | |
| Green | Jill Jones | 177 | 10.8 | +5.8 | |
| Majority | 546 | 33.3 | +27.7 | ||
| Turnout | 1,639 | 36.3 | +6.8 | ||
| Conservative hold | Swing | ||||
| Party | Candidate | Votes | % | ± | |
|---|---|---|---|---|---|
| Conservative | Louise Chapman | 574 | 51.3 | +9.5 | |
| Independent | Ian Lucas | 300 | 26.8 | +1.9 | |
| Labour | David Wesson | 142 | 12.7 | -1.6 | |
| Green | Christopher Marchant | 102 | 9.1 | +2.8 | |
| Majority | 274 | 24.5 | +7.6 | ||
| Turnout | 1,118 | 37.0 | +13.0 | ||
| Conservative hold | Swing | ||||
| Party | Candidate | Votes | % | ± | |
|---|---|---|---|---|---|
| Conservative | Ian Hudspeth | 703 | 43.9 | ||
| Liberal Democrat | Elizabeth Poskitt | 550 | 34.4 | ||
| Labour | Susan Roberts | 209 | 13.1 | ||
| Green | Tracy Dighton-Brown | 139 | 8.7 | ||
| Majority | 153 | 9.6 | |||
| Turnout | 1,601 | 53.7 | +5.8 | ||
| Conservative hold | Swing | ||||
By-elections between 2004 and 2006
| Party | Candidate | Votes | % | ± | |
|---|---|---|---|---|---|
| Conservative | Roger Curry | 420 | 50.5 | +1.1 | |
| Liberal Democrat | Daniel Coulson | 253 | 30.4 | +6.7 | |
| Green | Enid Dossett-Davies | 109 | 13.1 | -2.1 | |
| Labour | David Wesson | 49 | 5.9 | -5.9 | |
| Majority | 167 | 20.1 | -5.6 | ||
| Turnout | 831 | 19.8 | -18.5 | ||
| Conservative hold | Swing | ||||
References
- ↑ "West Oxfordshire council". BBC News Online. 11 June 2004. Retrieved 10 August 2015.
- ↑ "West Oxfordshire". The Guardian. NewsBank. 12 June 2004.
- ↑ "Local elections". BBC News Online. Retrieved 11 August 2015.
- 1 2 3 4 5 6 7 8 9 10 11 12 13 14 15 16 17 18 19 20 21 22 23 "West Oxfordshire District Council Election Results 1998 - 2010" (PDF). West Oxfordshire District Council. Retrieved 10 August 2015.
- 1 2 "Tories keep a grip in poll". Worcestershire, West Midlands, Herefordshire, and Shropshire Counties Publications. NewsBank. 17 June 2004.
- 1 2 3 "Election 2004: Tories strengthen in West". Oxfordshire County Publications. NewsBank. 11 June 2004.
- ↑ "Ballot box - Elections". The Times. NewsBank. 12 June 2004. p. 26.