Offaly County Council election, 2014
Offaly County Council election, 2014

|
|
|
|
|
|
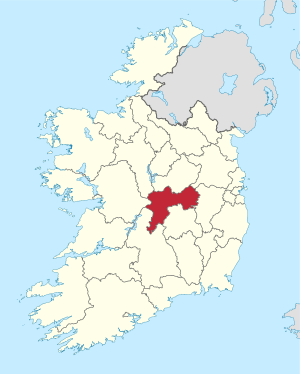
| Map showing the area of Offaly County Council |
|
Council control after election
TBD
|
|
|
An election to Offaly County Council took place on 23 May 2014 as part of that year's Irish local elections. 19 councillors were elected from three electoral divisions by PR-STV voting for a five-year term of office, a reduction of 2 seats from the previous election in 2009. In addition Birr Town Council, Edenderry Town Council and Tullamore Town Council were all abolished.
Fianna Fáil remained the largest party after the elections winning 8 Council seats. Sinn Féin won 3 seats and in terms of vote share also became the second largest party. Fine Gael, by contrast, had a poor set of results and lost half of their Council seats. Independents make up the remainder of the membership of the Council.
Results by party
Results by Electoral Area
Birr
| Birr - 6 seats |
| Party | Candidate | % 1st Pref | Count 1 | Count 2 | Count 3 | Count 4 | Count 5 | Count 6 |
|
Independent |
John Leahy*† |
23.05 |
2,686 |
|
|
|
|
|
|
Fianna Fáil |
Peter Ormond* |
13.71 |
1,598 |
1,678 |
|
|
|
|
|
Fine Gael |
John Clendennen |
10.37 |
1,209 |
1,317 |
1,384 |
1,574 |
1,943 |
|
|
Sinn Féin |
Carol Nolan†† |
10.01 |
1,166 |
1,420 |
1,518 |
1,636 |
1,703 |
|
|
Fianna Fáil |
Eamon Dooley* |
9.92 |
1,156 |
1,287 |
1,315 |
1,516 |
1,539 |
1,552 |
|
Independent |
John Carroll* |
9.06 |
1,056 |
1,147 |
1,325 |
1,353 |
1,529 |
1,618 |
|
Fianna Fáil |
Michael Loughnane |
7.61 |
887 |
950 |
991 |
1,012 |
1,205 |
1,271 |
|
Fine Gael |
Denis Sheils |
6.32 |
736 |
775 |
873 |
991 |
|
|
|
Fine Gael |
Pat Phelan |
5.59 |
651 |
760 |
790 |
|
|
|
|
Independent |
Teresa Ryan-Feehan |
4.37 |
509 |
655 |
|
|
|
|
| Electorate: 20,034 Valid: 11,654 (58.17%) Spoilt: 116 Quota: 1,665 Turnout: 11,770 (58.75%) |
Edenderry
| Edenderry - 6 seats |
| Party | Candidate | % 1st Pref | Count 1 | Count 2 | Count 3 | Count 4 | Count 5 | Count 6 | Count 7 | Count 8 | Count 9 |
|
Sinn Féin |
Martin O'Reilly |
19.08 |
1,669 |
|
|
|
|
|
|
|
|
|
Fianna Fáil |
Eddie Fitzpatrick* |
14.29 |
1,250 |
|
|
|
|
|
|
|
|
|
Independent |
John Foley* |
12.33 |
1,078 |
1,229 |
1,254 |
|
|
|
|
|
|
|
Fianna Fáil |
Noel Bourke* |
10.37 |
907 |
940 |
945 |
968 |
1,031 |
1,069 |
1,106 |
1,239 |
1,378 |
|
Fine Gael |
Liam Quinn* |
7.64 |
668 |
697 |
702 |
761 |
787 |
831 |
1,040 |
1,145 |
1,207 |
|
Fianna Fáil |
Ger Plunkett* |
7.62 |
667 |
705 |
707 |
708 |
710 |
722 |
741 |
799 |
818 |
|
Independent |
Noel Cribbin |
7.24 |
633 |
669 |
676 |
704 |
787 |
848 |
862 |
890 |
1,106 |
|
Independent |
Fergus McDonnell |
5.03 |
440 |
482 |
501 |
518 |
569 |
618 |
645 |
658 |
|
|
Fine Gael |
William Whittle |
3.84 |
336 |
344 |
348 |
367 |
374 |
382 |
|
|
|
|
Fianna Fáil |
Robert Kelleghan |
3.84 |
336 |
352 |
353 |
353 |
361 |
391 |
400 |
|
|
|
Independent |
Stephen Carroll |
2.76 |
241 |
266 |
298 |
300 |
304 |
|
|
|
|
|
Labour Party |
Declan Leddin |
2.76 |
241 |
254 |
256 |
272 |
|
|
|
|
|
|
Independent |
Patricia Brady |
1.99 |
174 |
180 |
183 |
|
|
|
|
|
|
|
Independent |
Emmanuel Sweeney |
1.21 |
106 |
128 |
|
|
|
|
|
|
|
| Electorate: 15,890 Valid: 8,746 (55.04%) Spoilt: 113 Quota: 1,250 Turnout: 8,859 (55.75%) |
Tullamore
| Tullamore - 7 seats |
| Party | Candidate | % 1st Pref | Count 1 | Count 2 | Count 3 | Count 4 | Count 5 | Count 6 | Count 7 | Count 8 | Count 9 | Count 10 | Count 11 | Count 12 |
|
Sinn Féin |
Brendan Killeavy |
22.8 |
2,778 |
|
|
|
|
|
|
|
|
|
|
|
|
Independent |
Dervill Dolan* |
15.33 |
1,868 |
|
|
|
|
|
|
|
|
|
|
|
|
Fianna Fáil |
Sinead Dooley* |
9.53 |
1,161 |
1,340 |
1,379 |
1,384 |
1,403 |
1,432 |
1,493 |
1,541 |
|
|
|
|
|
Fianna Fáil |
Frank Moran |
9.12 |
1,111 |
1,156 |
1,308 |
1,311 |
1,333 |
1,344 |
1,359 |
1,428 |
1,457 |
1,482 |
1,495 |
1,505 |
|
Fianna Fáil |
Declan Harvey |
9.07 |
1,105 |
1,307 |
1,323 |
1,327 |
1,342 |
1,354 |
1,415 |
1,434 |
1,570 |
|
|
|
|
Fine Gael |
Tommy McKeigue* |
7.91 |
964 |
1,066 |
1,088 |
1,091 |
1,107 |
1,227 |
1,300 |
1,332 |
1,756 |
|
|
|
|
Fianna Fáil |
Danny Owens* |
7.70 |
938 |
1,011 |
1,022 |
1,025 |
1,034 |
1,068 |
1,095 |
1,122 |
1,177 |
1,217 |
1,230 |
1,236 |
|
Fine Gael |
Molly Buckley* |
5.06 |
616 |
695 |
713 |
718 |
731 |
808 |
893 |
936 |
|
|
|
|
|
Independent |
Seán O'Brien |
3.92 |
478 |
768 |
784 |
796 |
858 |
864 |
907 |
1,012 |
1,102 |
1,209 |
1,230 |
1,232 |
|
Labour Party |
Paddy Doheny |
2.86 |
349 |
393 |
399 |
409 |
418 |
430 |
|
|
|
|
|
|
|
Independent |
John Bracken |
2.63 |
321 |
425 |
462 |
472 |
509 |
515 |
532 |
|
|
|
|
|
|
Fine Gael |
Theresa Wrafter |
2.42 |
295 |
308 |
316 |
320 |
323 |
|
|
|
|
|
|
|
|
Independent |
Seamus Kirwan |
1.16 |
141 |
239 |
258 |
270 |
|
|
|
|
|
|
|
|
|
Green Party |
Richard Brennan |
0.48 |
58 |
84 |
85 |
|
|
|
|
|
|
|
|
|
| Electorate: 20,607 Valid: 12,183 (59.12%) Spoilt: 119 Quota: 1,523 Turnout: 12,302 (59.70%) |
References
Changes since Election
- † In March 2015 Birr Independent Cllr John Leahy became a founder of the Renua party.
- †† Sinn Féin's Carol Nolan was elected as a TD for Offaly in the 2016 Irish general election. Sean Maher was co-opted to fill the vacancy.
External links