Monaghan County Council election, 2014
Monaghan County Council election, 2014

|
|
|
|
|
|
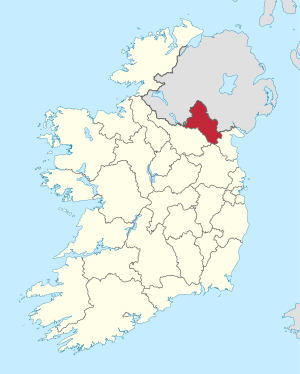
| Map showing the area of Monaghan County Council |
|
Council control after election
TBD
|
|
|
An election to Monaghan County Council took place on 23 May 2014 as part of that year's Irish local elections. 18 councillors were elected from three electoral divisions by PR-STV voting for a five-year term of office, a reduction of 2 seats compared to 2009. Monaghan also saw a further reduction in elected representation as Ballybay Town Council, Carrickmacross Town Council, Castleblayney Town Council, Clones Town Council and Monaghan Town Council were all abolished.
New Electoral Areas were introduced in 2013 and came into effect on 1 January 2014.[1] The election in Ballybay-Clones local electoral area was disrupted when Fine Gael Councillor Owen Bannigan died suddenly while out canvassing on polling day.[2][3] The election for this area was cancelled and all the ballots cast were officially destroyed.[4] He had been expected to top the poll.[5] It will be re-run on 7 June 2014. The election in the other two electoral areas of Carrickmacross-Castleblayney and Monaghan went ahead.
Demonstrating their organisational strength within the county Sinn Féin emerged as the largest party after the elections with 7 seats, winning all the seats that the party contested. Fine Gael lost a seat in the Carrickmacross-Castleblayney LEA while Fianna Fáil lost a seat in Ballybay-Clones. Independents retained their 2 seats on the Council.[6]
Results by party
Results by Electoral Area
Ballybay-Clones
| Ballybay-Clones - 6 seats |
| Party | Candidate | % 1st Pref | Count 1 | Count 2 | Count 3 | Count 4 | Count 5 | Count 6 | Count 7 |
|
Fianna Fáil |
Seamus Coyle* |
16.3% |
1,449 |
|
|
|
|
|
|
|
Fine Gael |
Ciara McPhillips* |
15.2% |
1,348 |
|
|
|
|
|
|
|
Sinn Féin |
Cathy Bennett* |
14.6% |
1,295 |
|
|
|
|
|
|
|
Fine Gael |
Eugene Bannigan†† |
12.9% |
1,153 |
1,207 |
1,228 |
1,229 |
1,358 |
|
|
|
Fine Gael |
Hugh McElvaney* |
12.1% |
1,075 |
1,086 |
1,120 |
1,120 |
1,142 |
1,158 |
1,343 |
|
Sinn Féin |
Pat Treanor* |
11.7% |
1,041 |
1,053 |
1,059 |
1,077 |
1,107 |
1,113 |
1,282 |
|
Independent |
Paul McPhillips |
6.6% |
584 |
608 |
619 |
620 |
691 |
724 |
|
|
Fianna Fáil |
Deirdre Kelly |
5.6% |
499 |
532 |
535 |
536 |
731 |
752 |
882 |
|
Fianna Fáil |
Michael Smyth |
4.5% |
398 |
442 |
444 |
445 |
|
|
|
|
Independent |
Joseph Duffy |
0.3% |
27 |
27 |
27 |
27 |
|
|
|
|
Green Party |
Raimonda Leonaviciene |
0.3% |
22 |
22 |
22 |
22 |
|
|
|
| Electorate: 15,326 Valid: 8,891 Spoilt: 73 Quota: 1,271 Turnout: 8,964 (58.5%) |
Carrickmacross-Castleblayney
| Carrickmacross-Castleblayney - 6 seats |
| Party | Candidate | % 1st Pref | Count 1 | Count 2 | Count 3 | Count 4 | Count 5 | Count 6 | Count 7 | Count 8 |
|
Sinn Féin |
Matt Carthy*† |
19.3% |
1,970 |
|
|
|
|
|
|
|
|
Fine Gael |
Aidan Campbell |
13.3% |
1,355 |
1,365 |
1,366 |
1,416 |
1,554 |
|
|
|
|
Sinn Féin |
Noel Keelan* |
12.8% |
1,304 |
1,545 |
|
|
|
|
|
|
|
Fianna Fáil |
P.J. O'Hanlon* |
10.9% |
1,118 |
1,158 |
1,166 |
1,191 |
1,355 |
1,479 |
|
|
|
Sinn Féin |
Jackie Crowe* |
9.9% |
1,019 |
1,106 |
1,159 |
1,214 |
1,277 |
1,308 |
1,349 |
1,350 |
|
Fianna Fáil |
Pádraig McNally* |
9.3% |
948 |
985 |
997 |
1,014 |
1,263 |
1,399 |
1,443 |
1,455 |
|
Fine Gael |
Aidan Murray* |
9.1% |
928 |
950 |
953 |
971 |
991 |
1,325 |
1,334 |
1,340 |
|
Fianna Fáil |
Margaret Conlon |
6.8% |
691 |
705 |
706 |
717 |
|
|
|
|
|
Fine Gael |
Lorraine Cotter |
6.3% |
638 |
682 |
688 |
729 |
771 |
|
|
|
|
Labour Party |
Ciarán Connolly |
1.4% |
145 |
151 |
152 |
|
|
|
|
|
|
Labour Party |
Peadar Markey |
0.9% |
98 |
107 |
107 |
|
|
|
|
|
| Electorate: 16,958 Valid: 10,214 Spoilt: 165 Quota: 1,460 Turnout: 10,379 (61.2%) |
Monaghan
| Monaghan - 6 seats |
| Party | Candidate | % 1st Pref | Count 1 | Count 2 | Count 3 | Count 4 | Count 5 | Count 6 | Count 7 | Count 8 |
|
Sinn Féin |
Brian McKenna* |
15.2% |
1,336 |
|
|
|
|
|
|
|
|
Independent |
Seamus Treanor* |
15.1% |
1,332 |
|
|
|
|
|
|
|
|
Fianna Fáil |
Robbie Gallagher*††† |
14.1% |
1,244 |
1,249 |
1,259 |
|
|
|
|
|
|
Sinn Féin |
Seán Conlon* |
11.2% |
988 |
1,012 |
1,025 |
1,044 |
1,062 |
1,122 |
1,159 |
1,233 |
|
Fine Gael |
David Maxwell* |
8.8% |
775 |
776 |
780 |
789 |
806 |
828 |
992 |
1,318 |
|
Independent |
Paudge Connolly* |
8.3% |
727 |
738 |
751 |
787 |
853 |
953 |
1,048 |
1,198 |
|
Sinn Féin |
Siobhán Cheung |
7% |
617 |
642 |
649 |
668 |
690 |
725 |
765 |
807 |
|
Fine Gael |
Barra Flynn |
5.9% |
525 |
527 |
531 |
546 |
579 |
611 |
760 |
|
|
Fine Gael |
Garry Keenan |
5.5% |
484 |
487 |
490 |
511 |
525 |
553 |
|
|
|
Independent |
Thomas Hagan |
3.5% |
306 |
307 |
321 |
348 |
369 |
|
|
|
|
Fianna Fáil |
John Finn |
3% |
266 |
270 |
272 |
276 |
|
|
|
|
|
Green Party |
Grazvydas Vaitekunas |
1% |
91 |
92 |
93 |
|
|
|
|
|
|
Independent |
Kevin Hamill |
0.8% |
68 |
69 |
71 |
|
|
|
|
|
|
Independent |
Jimmy Mee |
0.5% |
42 |
42 |
43 |
|
|
|
|
|
| Electorate: 16,211 Valid: 8,801 Spoilt: 138 Quota: 1,258 Turnout: 8,939 (55.14%) |
References
Changes Since 2014
- † Carrickmacross-Castleblayney Sinn Féin Cllr Matt Carty was also elected as an MEP on 23 May 2014. Accordingly he resigned his Council seat in accordance with the Dual Mandate. His brother, Colm, was co-opted to fill the vacancy on 8 July 2014.
- †† Ballybay-Clones Fine Gael Cllr Eugene Bannigan resigned to pursue a job opportunity in the United States. Seán Gilliland was co-opted to fill the vacancy on 7 December 2015.
- ††† Monaghan Fianna Fáil Cllr Robbie Gallagher was elected to Seanad Eireann in April 2016. Raymond Aughey was co-opted to fill the vacancy on 4 July 2016.
External links