Nunavut (electoral district)
Nunavut Nunavut electoral district Nunavut electoral district |
|---|
|
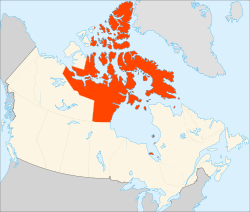
Nunavut riding in relation to Canada |
| Federal electoral district |
|---|
| Legislature |
House of Commons |
|---|
| MP |
Hunter Tootoo
Independent |
|---|
| District created |
1976 |
|---|
| First contested |
1979 |
|---|
| Last contested |
2015 |
|---|
| District webpage |
profile, map |
|---|
| Demographics |
|---|
| Population (2011)[1] |
31,906 |
|---|
| Electors (2015) |
18,124 |
|---|
| Area (km²)[2] |
1,877,787.62 |
|---|
| Pop. density (per km²) |
0.02 |
|---|
| Census divisions |
Kitikmeot Region, Keewatin Region, Baffin Region |
|---|
| Census subdivisions |
Iqaluit, Rankin Inlet, Arviat, Baker Lake, Igloolik, Cambridge Bay, Pangnirtung, Pond Inlet, Kugluktuk, Cape Dorset |
|---|
Nunavut is a federal electoral district in Nunavut, Canada, that has been represented in the House of Commons of Canada since 1997. Nunatsiaq, its predecessor that covered the same area, was a federal electoral district in Northwest Territories, that was represented in the House of Commons from 1979 to 1997.
Nunavut is the only electoral district in the territory. It is the largest federal electoral district in land area in Canada.[3] It is also the largest electoral district represented by a single legislator.[4]
Demographics
- According to the Canada 2011 Census; 2013 representation[5][6]
Ethnic groups: 86.3% Aboriginal, 12.1% White
Languages: 66.8% Inuktitut, 29.1% English, 1.4% French
Religions: 86.0% Christian (50.3% Anglican, 23.9% Catholic, 4.9% Pentecostal, 6.8% Other), 12.9% No religion
Median income (2010): $25,662
Average income (2010): $43,505
The Nunavut riding holds a host of demographic records:
- Lowest median age:[7] 24.1 years
- Highest percentage of Aboriginals:[8] 85.0%
- Highest percentage of Inuit: 84.0%
- Highest percentage of a non-official language as mother tongue:[9] 69.4%
- Highest percentage of an Aboriginal language as mother tongue: 68.0%
- Highest percentage of Inuktitut as mother tongue: 66.8%
- Highest percentage of an Aboriginal language as home language:[10] 53.0%
- Highest percentage of Inuktitut as home language: 51.9%
History
The electoral district was created in 1976 as "Nunatsiaq" riding from parts of Northwest Territories riding. It was replaced by "Nunavut" in 1996.
In 1999, the district's boundaries were redefined in the Nunavut Act, the law governing the creation of Nunavut as a separate jurisdiction from the Northwest Territories.
The boundaries of this riding were not changed in the 2012 electoral redistribution.
Riding Associations
Riding associations are the local branches of political parties:
| Party |
Association Name |
CEO |
HQ Address |
HQ City |
|
Conservative |
Conservative Party of Canada Nunavut Electoral District Association |
Julie-Anne Miller |
Post Office Box 1841 |
Iqaluit |
|
Liberal |
Nunavut Federal Liberal Association |
Michel Potvin |
Post Office Box 714 |
Iqaluit |
|
New Democratic |
Nunavut New Democratic Party Electoral District Association |
Bethany Scott |
Post Office Box 11380 |
Iqaluit |
Members of Parliament
This riding has elected the following Members of Parliament:
Election results
Nunavut
| Canadian federal election, 2006 |
| Party |
Candidate |
Votes | % | ∆% | Expenditures |
|
Liberal | Nancy Karetak-Lindell | 3,673 | 39.98 | −11.32 | $10,669 |
|
Conservative | David Aglukark | 2,670 | 29.06 | +14.62 | $5,486 |
|
New Democratic | Bill Riddell | 1,576 | 17.15 | +1.98 | $11,990 |
|
Marijuana | D. Ed deVries | 724 | 7.88 | – | $1,162 |
|
Green | Feliks Kappi | 544 | 5.92 | +2.59 | $3,950 |
| Total valid votes/Expense limit |
9,187 | 100.0 | | $74,506 |
| Total rejected ballots |
64 | 0.70 |
| Turnout |
9,251 | 54.10 |
|
Liberal hold |
Swing |
−12.97 |
| Canadian federal election, 2004 |
| Party |
Candidate |
Votes | % | ∆% | Expenditures |
|
Liberal | Nancy Karetak-Lindell | 3,818 | 51.30 | −17.71 | $18,035 |
|
Independent | Manitok Thompson | 1,172 | 15.74 | – | $5,945 |
|
New Democratic | Bill Riddell | 1,129 | 15.17 | −3.09 | $12,810 |
|
Conservative | Duncan Cunningham | 1,075 | 14.44 | +6.24 | $16,838 |
|
Green | Nedd Kenney | 248 | 3.33 | −1.19 | $190 |
| Total valid votes |
7,442 | 100.0 |
| Total rejected ballots |
33 | 0.44 |
| Turnout |
7,475 | 43.86 |
|
Liberal hold |
Swing |
−16.72 |
| Change for the Conservatives is based on the results of the Progressive Conservatives. |
Nunatsiaq
See also
References
Notes
- ↑ Statistics Canada: 2011
- ↑ Statistics Canada: 2011
- ↑ Madeline Redfern on Nunavut's electoral riding, largest in Canada, CBC, October 8, 2015
- ↑ Durack: the electorate bigger than many countries still finds it hard to get noticed, The Guardian, 14 May 2016
- ↑ http://www12.statcan.gc.ca/nhs-enm/2011/dp-pd/prof/details/page.cfm?Lang=E&Geo1=FED2013&Code1=62001&Data=Count&SearchText=Nunavut&SearchType=Begins&SearchPR=01&A1=All&B1=All&Custom=&TABID=1
- ↑ http://www12.statcan.gc.ca/nhs-enm/2011/dp-pd/prof/details/page.cfm?Lang=E&Geo1=FED2013&Code1=62001&Data=Count&SearchText=Nunavut&SearchType=Begins&SearchPR=01&A1=All&B1=All&Custom=&TABID=1#tabs2
- ↑ "Age (131) and Sex (3) for the Population of Canada, Provinces, Territories and Federal Electoral Districts (2003 Representation Order), 2011 Census". www2.statcan.gc.ca. Retrieved 2012-11-19.
- ↑ "Aboriginal Identity (8), Sex (3) and Age Groups (12) for the Population of Canada, Provinces, Territories and Federal Electoral Districts (2003 Representation Order), 2006 Census - 20% Sample Data". 2.statcan.gc.ca. Retrieved 2012-11-19.
- ↑ "2011 Census of Canada: Topic-based tabulations | Detailed Mother Tongue (232), Knowledge of Official Languages (5), Age Groups (17A) and Sex (3) for the Population Excluding Institutional Residents of Canada, Provinces, Territories and Federal Electoral Districts (2003 Representation Order), 2011 Census". 2.statcan.gc.ca. Retrieved 2012-11-19.
- ↑ "First Official Language Spoken (7), Detailed Language Spoken Most Often at Home (232), Age Groups (17A) and Sex (3) for the Population Excluding Institutional Residents of Canada, Provinces, Territories and Federal Electoral Districts (2003 Representation Order), 2011 Census". 2.statcan.gc.ca. Retrieved 2012-11-19.
- ↑ Elections Canada – Confirmed candidates for Nunavut, 30 September 2015
- ↑ Elections Canada – Preliminary Election Expenses Limits for Candidates
External links
Coordinates: 73°N 91°W / 73°N 91°W / 73; -91 (Nunavut)