Matamoras, Ohio
| Matamoras, Ohio | |
|---|---|
| Village | |
|
Scene along State Street downtown | |
 Location of Matamoras, Ohio | |
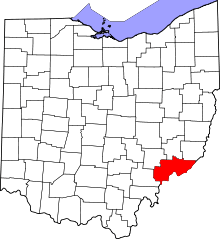
 Location of Matamoras in Washington County | |
| Coordinates: 39°31′21″N 81°3′54″W / 39.52250°N 81.06500°WCoordinates: 39°31′21″N 81°3′54″W / 39.52250°N 81.06500°W | |
| Country | United States |
| State | Ohio |
| County | Washington |
| Government | |
| • Mayor | Dennis A. Agin [1] |
| Area[2] | |
| • Total | 0.39 sq mi (1.01 km2) |
| • Land | 0.35 sq mi (0.91 km2) |
| • Water | 0.04 sq mi (0.10 km2) |
| Population (2010)[3] | |
| • Total | 896 |
| • Estimate (2012[4]) | 889 |
| • Density | 2,560.0/sq mi (988.4/km2) |
| Time zone | Eastern (EST) (UTC-5) |
| • Summer (DST) | EDT (UTC-4) |
| ZIP code | 45767 |
| Area code(s) | 740 |
| FIPS code | 39-48286[5] |

Matamoras is a village in Washington County, Ohio, United States, along the Ohio River. It is also commonly known as New Matamoras. The population was 896 at the 2010 census.
Matamoras first settled in 1797 by James Riggs and his sons-in-law, Martin and Anthony Sheets along with their families. Riggs and his family cleared the land and built three cabins in the area. It was not known as Matamoras at that time. Many of the first settlers were Revolutionary War veterans.[6]
Matamoras, named for the Battle of Matamoros in the Mexican-American War was first platted (mapped) in 1846 by Stinson Burns and Henry Sheets.[6] In 1861, Matamoras was incorporated and received its first post office that year. The U. S. Post Office changed the town's name to New Matamoras to avoid confusion with Metamora in Fulton County.[6][7]
Once a boom town for shipping, Matamoras has been supported economically by farming and oil.[6]
Geography
Matamoras is an Ohio River town, approximately 20 miles east of Marietta; directly across the Ohio River from Friendly, West Virginia.[8] Matamoras is south of Wayne National Forest.[9] The town's longitude and latitude are: 39°31′21″N 81°3′54″W / 39.52250°N 81.06500°W (39.522451, -81.065084).[10]
According to the United States Census Bureau, the village has a total area of 0.39 square miles (1.01 km2), of which 0.35 square miles (0.91 km2) is land and 0.04 square miles (0.10 km2) is water.[2]
Demographics
| Historical population | |||
|---|---|---|---|
| Census | Pop. | %± | |
| 1870 | 406 | — | |
| 1880 | 631 | 55.4% | |
| 1890 | 590 | −6.5% | |
| 1900 | 817 | 38.5% | |
| 1910 | 711 | −13.0% | |
| 1920 | 896 | 26.0% | |
| 1930 | 781 | −12.8% | |
| 1940 | 793 | 1.5% | |
| 1950 | 781 | −1.5% | |
| 1960 | 925 | 18.4% | |
| 1970 | 940 | 1.6% | |
| 1980 | 1,172 | 24.7% | |
| 1990 | 1,002 | −14.5% | |
| 2000 | 957 | −4.5% | |
| 2010 | 896 | −6.4% | |
| Est. 2015 | 884 | [11] | −1.3% |
2010 census
As of the census[3] of 2010, there were 896 people, 402 households, and 243 families residing in the village. The population density was 2,560.0 inhabitants per square mile (988.4/km2). There were 447 housing units at an average density of 1,277.1 per square mile (493.1/km2). The racial makeup of the village was 97.2% White, 0.4% African American, 0.1% Native American, 0.2% Asian, and 2.0% from two or more races. Hispanic or Latino of any race were 1.0% of the population.
There were 402 households of which 28.6% had children under the age of 18 living with them, 38.1% were married couples living together, 14.9% had a female householder with no husband present, 7.5% had a male householder with no wife present, and 39.6% were non-families. 35.6% of all households were made up of individuals and 17.6% had someone living alone who was 65 years of age or older. The average household size was 2.23 and the average family size was 2.84.
The median age in the village was 41.7 years. 23.4% of residents were under the age of 18; 7.6% were between the ages of 18 and 24; 22.6% were from 25 to 44; 26.2% were from 45 to 64; and 20.2% were 65 years of age or older. The gender makeup of the village was 47.0% male and 53.0% female.
2000 census
As of the census[5] of 2000, there were 957 people, 413 households, and 265 families residing in the village. The population density was 2,656.5 people per square mile (1,026.4/km²). There were 464 housing units at an average density of 1,288.0 per square mile (497.6/km²). The racial makeup of the village was 99.16% White, 0.21% African American, 0.21% Native American, 0.10% Asian, and 0.31% from two or more races. Hispanic or Latino of any race were 0.42% of the population.
There were 413 households out of which 28.1% had children under the age of 18 living with them, 47.7% were married couples living together, 14.3% had a female householder with no husband present, and 35.8% were non-families. 32.9% of all households were made up of individuals and 17.7% had someone living alone who was 65 years of age or older. The average household size was 2.32 and the average family size was 2.94.
In the village the population was spread out with 24.3% under the age of 18, 9.5% from 18 to 24, 25.4% from 25 to 44, 23.9% from 45 to 64, and 16.8% who were 65 years of age or older. The median age was 38 years. For every 100 females there were 81.6 males. For every 100 females age 18 and over, there were 80.1 males.
The median income for a household in the village was $25,655, and the median income for a family was $30,903. Males had a median income of $34,205 versus $15,284 for females. The per capita income for the village was $13,413. About 24.1% of families and 29.3% of the population were below the poverty line, including 45.8% of those under age 18 and 24.4% of those age 65 or over.
See also
References
- ↑ "Washington County Election Results". Retrieved 2008-03-22.
- 1 2 "US Gazetteer files 2010". United States Census Bureau. Retrieved 2013-01-06.
- 1 2 "American FactFinder". United States Census Bureau. Retrieved 2013-01-06.
- ↑ "Population Estimates". United States Census Bureau. Retrieved 2013-06-17.
- 1 2 "American FactFinder". United States Census Bureau. Retrieved 2008-01-31.
- 1 2 3 4 "The Matamoras Area Historical Society".
- ↑ "New Matamoras was founded in 1846". Archived from the original on 2006-06-21. Retrieved 2006-07-01.
- ↑ https://maps.google.com/maps?hl=en&tab=wl
- ↑ http://www.fs.usda.gov/Internet/FSE_DOCUMENTS/stelprdb5325276.pdf
- ↑ "US Gazetteer files: 2010, 2000, and 1990". United States Census Bureau. 2011-02-12. Retrieved 2011-04-23.
- ↑ "Annual Estimates of the Resident Population for Incorporated Places: April 1, 2010 to July 1, 2015". Retrieved July 2, 2016.
- ↑ "Census of Population and Housing". Census.gov. Retrieved June 4, 2015.