Fruitland, Maryland
| Fruitland, Maryland | ||
|---|---|---|
| City | ||
| ||
 Location of Fruitland, Maryland | ||
| Coordinates: 38°19′25″N 75°37′10″W / 38.32361°N 75.61944°WCoordinates: 38°19′25″N 75°37′10″W / 38.32361°N 75.61944°W | ||
| Country | United States | |
| State | Maryland | |
| County | Wicomico | |
| Incorporated | 1947 | |
| Government | ||
| • Type | Council–manager government | |
| • City Manager | John Psota | |
| • City Council |
Member List
| |
| Area[1] | ||
| • Total | 3.79 sq mi (9.82 km2) | |
| • Land | 3.78 sq mi (9.79 km2) | |
| • Water | 0.01 sq mi (0.03 km2) | |
| Elevation | 36 ft (11 m) | |
| Population (2010)[2] | ||
| • Total | 4,866 | |
| • Estimate (2012[3]) | 5,089 | |
| • Density | 1,287.3/sq mi (497.0/km2) | |
| Time zone | Eastern (EST) (UTC-5) | |
| • Summer (DST) | EDT (UTC-4) | |
| ZIP code | 21826 | |
| Area code(s) | 410, 443 | |
| FIPS code | 24-30950 | |
| GNIS feature ID | 0584531 | |
| Website | www.cityoffruitland.com | |

Fruitland is a city in Wicomico County, Maryland, United States. The population was 4,866 at the 2010 census. It is included in the Salisbury, Maryland-Delaware Metropolitan Statistical Area.
Geography
Fruitland is located at 38°19′25″N 75°37′10″W / 38.32361°N 75.61944°W (38.323555, -75.619557).[4]
According to the United States Census Bureau, the city has a total area of 3.79 square miles (9.82 km2), of which 3.78 square miles (9.79 km2) is land and 0.01 square miles (0.03 km2) is water.[1]
Demographics
| Historical population | |||
|---|---|---|---|
| Census | Pop. | %± | |
| 1950 | 1,028 | — | |
| 1960 | 1,147 | 11.6% | |
| 1970 | 2,315 | 101.8% | |
| 1980 | 2,694 | 16.4% | |
| 1990 | 3,511 | 30.3% | |
| 2000 | 3,774 | 7.5% | |
| 2010 | 4,866 | 28.9% | |
| Est. 2015 | 5,215 | [5] | 7.2% |
The median income for a household in the city was $34,468, and the median income for a family was $36,181. Males had a median income of $28,495 versus $21,127 for females. The per capita income for the city was $17,774. About 15.2% of families and 18.3% of the population were below the poverty line, including 22.1% of those under age 18 and 16.3% of those age 65 or over.
2010 census
As of the census[2] of 2010, there were 4,866 people, 1,840 households, and 1,223 families residing in the city. The population density was 1,287.3 inhabitants per square mile (497.0/km2). There were 2,045 housing units at an average density of 541.0 per square mile (208.9/km2). The racial makeup of the city was 62.0% White, 30.3% African American, 0.6% Native American, 3.1% Asian, 1.4% from other races, and 2.6% from two or more races. Hispanic or Latino of any race were 3.3% of the population.
There were 1,840 households of which 37.3% had children under the age of 18 living with them, 43.0% were married couples living together, 18.4% had a female householder with no husband present, 5.1% had a male householder with no wife present, and 33.5% were non-families. 23.2% of all households were made up of individuals and 7.9% had someone living alone who was 65 years of age or older. The average household size was 2.64 and the average family size was 3.11.
The median age in the city was 32.5 years. 26.6% of residents were under the age of 18; 12.1% were between the ages of 18 and 24; 27.4% were from 25 to 44; 23.6% were from 45 to 64; and 10.2% were 65 years of age or older. The gender makeup of the city was 46.6% male and 53.4% female.
| | ||
| Race | Population | % of Total |
|---|---|---|
| Total | 4,866 | 100 |
| Caucasian | 3,018 | 62 |
| African American | 1,472 | 30 |
| Hispanic | 160 | 3 |
| Asian | 150 | 3 |
| Two or More Races | 128 | 2 |
| [6] | ||
Schools

Fruitland Primary School (K-2) and Fruitland Intermediate School (3-5) are within Fruitland's city limits and are operated by Wicomico County Public Schools, which serve the city and surrounding area. Students from Fruitland schools feed into Bennett Middle School (6-8) and then into either James M. Bennett High School or Parkside High School, all of which are located in Salisbury.
Climate
Climate is characterized by relatively high temperatures and evenly distributed precipitation throughout the year. The Köppen Climate Classification subtype for this climate is "Cfa" (Humid Subtropical Climate).[7]
| Climate data for Fruitland, Maryland | |||||||||||||
|---|---|---|---|---|---|---|---|---|---|---|---|---|---|
| Month | Jan | Feb | Mar | Apr | May | Jun | Jul | Aug | Sep | Oct | Nov | Dec | Year |
| Average high °C (°F) | 8 (47) |
9 (48) |
14 (57) |
19 (67) |
24 (76) |
29 (84) |
31 (87) |
30 (86) |
27 (80) |
21 (70) |
16 (60) |
9 (49) |
20 (68) |
| Average low °C (°F) | −2 (28) |
−2 (29) |
2 (36) |
7 (44) |
12 (53) |
17 (62) |
19 (67) |
19 (66) |
15 (59) |
9 (48) |
4 (39) |
−1 (31) |
8 (47) |
| Average precipitation mm (inches) | 94 (3.7) |
81 (3.2) |
107 (4.2) |
89 (3.5) |
89 (3.5) |
94 (3.7) |
107 (4.2) |
137 (5.4) |
99 (3.9) |
84 (3.3) |
79 (3.1) |
86 (3.4) |
1,140 (44.9) |
| Source: Weatherbase [8] | |||||||||||||
References
- 1 2 "US Gazetteer files 2010". United States Census Bureau. Retrieved 2013-01-25.
- 1 2 "American FactFinder". United States Census Bureau. Retrieved 2013-01-25.
- ↑ "Population Estimates". United States Census Bureau. Retrieved 2013-06-26.
- ↑ "US Gazetteer files: 2010, 2000, and 1990". United States Census Bureau. 2011-02-12. Retrieved 2011-04-23.
- ↑ "Annual Estimates of the Resident Population for Incorporated Places: April 1, 2010 to July 1, 2015". Retrieved July 2, 2016.
- ↑ "Fruitland Maryland Population Statistics". US Census Bureau. Retrieved June 9, 2014.
- ↑ Climate Summary for Fruitland, Maryland
- ↑ "Weatherbase.com". Weatherbase. 2013. Retrieved on August 7, 2013.
External links
Municipalities and communities of Wicomico County, Maryland, United States | ||
|---|---|---|
| Cities | 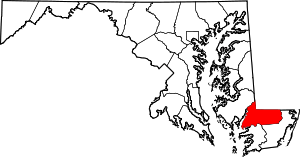 | |
| Towns | ||
| CDPs | ||
| Unincorporated communities | ||
| Footnotes | ‡This populated place also has portions in an adjacent county or counties | |
| Counties |  | |
|---|---|---|
| Principal city | ||
| Places 5k-20k | ||
| Places 1k-5k | ||