East Ujimqin Banner
| East Ujimqin Banner 东乌珠穆沁旗 • ᠵᠡᠭᠦᠨᠤᠵᠤᠮᠤᠴᠢᠨᠬᠣᠰᠢᠭᠤ | |
|---|---|
| Banner | |
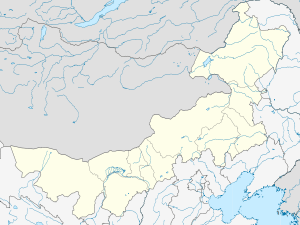 East Ujimqin Location in Inner Mongolia | |
| Coordinates: 45°31′N 116°58′E / 45.517°N 116.967°ECoordinates: 45°31′N 116°58′E / 45.517°N 116.967°E | |
| Country | People's Republic of China |
| Region | Inner Mongolia |
| League | Xilin Gol |
| Area | |
| • Total | 54,545 km2 (21,060 sq mi) |
| Elevation | 839 m (2,753 ft) |
| Population | |
| • Total | 60,000 |
| • Density | 1.1/km2 (2.8/sq mi) |
| Time zone | China Standard (UTC+8) |
| Postal code | 026300 |
| Website | http://www.dwq.gov.cn/ |
East Ujimqin Banner (Mongolian: ᠵᠡᠭᠦᠨ ᠤᠵᠤᠮᠤᠴᠢᠨ ᠬᠣᠰᠢᠭᠤ Жэгүн Ужумчин қосиу Jegün Ujumučin qosiɣu; simplified Chinese: 东乌珠穆沁旗; traditional Chinese: 東烏珠穆沁旗; pinyin: Dōng Wūzhūmùqìn Qí) is a banner in the northeast of the Inner Mongolia Autonomous Region, People's Republic of China. It is under the administration of Xilin Gol League.
Geography and climate
East Ujimqin features a cold semi-arid climate (Köppen BSk), marked by long, cold and very dry winters, hot, somewhat humid summers, and strong winds, especially in spring. The monthly daily mean temperature in January, the coldest month, is −20.8 °C (−5.4 °F), and in July, the warmest month, 21.1 °C (70.0 °F), with the annual mean at 1.38 °C (34.5 °F). The annual precipitation is approximately 260 millimetres (10.2 in), with more than half of it falling in July and August alone. Due to the aridity and elevation, diurnal temperature variation often exceeds 15 °C (27 °F) in spring, averaging 13.7 °C (24.7 °F) annually. With monthly percent possible sunshine ranging from 59% in July to 76% in February, sunshine is abundant year-round, with an annual total of 3,006 hours.
| Climate data for East Ujimqin (1971−2000) | |||||||||||||
|---|---|---|---|---|---|---|---|---|---|---|---|---|---|
| Month | Jan | Feb | Mar | Apr | May | Jun | Jul | Aug | Sep | Oct | Nov | Dec | Year |
| Average high °C (°F) | −14 (7) |
−9.3 (15.3) |
0.0 (32) |
12.0 (53.6) |
20.0 (68) |
25.2 (77.4) |
27.5 (81.5) |
25.7 (78.3) |
19.3 (66.7) |
10.2 (50.4) |
−2 (28) |
−11 (12) |
8.6 (47.5) |
| Average low °C (°F) | −26.3 (−15.3) |
−23.5 (−10.3) |
−14.4 (6.1) |
−3.7 (25.3) |
3.9 (39) |
10.9 (51.6) |
14.9 (58.8) |
12.8 (55) |
5.1 (41.2) |
−3.9 (25) |
−14.4 (6.1) |
−22.5 (−8.5) |
−5.1 (22.8) |
| Average precipitation mm (inches) | 1.5 (0.059) |
1.8 (0.071) |
4.1 (0.161) |
6.5 (0.256) |
17.5 (0.689) |
39.9 (1.571) |
81.6 (3.213) |
59.9 (2.358) |
27.1 (1.067) |
11.6 (0.457) |
4.2 (0.165) |
3.0 (0.118) |
258.7 (10.185) |
| Average precipitation days (≥ 0.1 mm) | 3.6 | 3.4 | 3.8 | 3.8 | 6.1 | 11.6 | 13.8 | 12.6 | 8.1 | 4.7 | 4.5 | 4.4 | 80.4 |
| Average relative humidity (%) | 72 | 70 | 58 | 40 | 39 | 52 | 62 | 64 | 59 | 55 | 64 | 71 | 58.8 |
| Mean monthly sunshine hours | 204.2 | 220.9 | 274.5 | 277.5 | 301.2 | 286.2 | 279.9 | 278.6 | 256.9 | 238.1 | 201.3 | 186.8 | 3,006.1 |
| Percent possible sunshine | 73 | 76 | 75 | 69 | 66 | 62 | 59 | 64 | 69 | 70 | 70 | 69 | 68 |
| Source: China Meteorological Administration | |||||||||||||
References
- www.xzqh.org (Chinese)