Demographics of Houston
This article on the demographics of Houston in the early 21st century (2000-2015) contains information on population characteristics of Houston, Texas, United States of America, including households, family status, age, gender, income, race and ethnicity.
Population and households
| City of Houston Past censuses[1] | ||
| Year | Population | Rank |
|---|---|---|
| 1850 | 2,396 | ? |
| 1860 | 4,845 | ? |
| 1870 | 9,332 | ? |
| 1880 | 16,513 | ? |
| 1890 | 27,557 | ? |
| 1900 | 44,633 | 85 |
| 1910 | 78,800 | 68 |
| 1920 | 138,276 | 45 |
| 1930 | 292,352 | 26 |
| 1940 | 384,514 | 21 |
| 1950 | 596,163 | 14 |
| 1960 | 938,219 | 7 |
| 1970 | 1,232,802 | 6 |
| 1980 | 1,595,138 | 5 |
| 1990 | 1,630,553 | 4 |
| 2000 | 1,953,631 | 4 |
| 2010 | 2,099,451 | 4 |
As of the census[2] of 2000, there were 1,953,631 people, 717,945 households, and 457,330 families residing in the city. The population density was 3,371.7 people per square mile (1,301.8/km²). There were 782,009 housing units at an average density of 1,349.6 per square mile (521.1/km²). If the city of Houston were a U.S. state, it would rank 36th in population—its estimated 2.01 million residents in 2004 placed it behind Nevada and ahead of New Mexico.[3][4] In 2005, the Greater Houston area had a population of more than 5.7 million, as the area was growing at a faster rate than the state or the nation.[5]
In 2000, there were 717,945 households in the city, of which 33.1% had children under the age of 18 living with them, 43.2% were married couples living together, 15.3% had a female householder with no husband present, and 36.3% were non-families. Twenty-nine percent of all households were made up of individuals and 6.2% had someone living alone who was 65 years of age or older. The average household size was 2.67 and the average family size was 3.39. The median house price was $115,961 in 2009.[6]
In the city, the population was spread out with 27.5% under the age of 18, 11.2% from 18 to 24, 33.8% from 25 to 44, 19.1% from 45 to 64, and 8.4% who were 65 years of age or older. The median age was 31 years. For every 100 females there were 99.7 males. For every 100 females age 18 and over, there were 97.8 males.
The median income for a household in the city was $36,616, and the median income for a family was $40,443. Males had a median income of $32,084 versus $27,371 for females. The per capita income for the city was $20,101. Nineteen percent of the population and 16% of families were below the poverty line. Out of the total population, 26.1% of those under the age of 18 and 14.3% of those 65 and older were living below the poverty line.
As of 2002, 38,000 residents of Houston were counted among residents of Fort Bend County, as the city had expanded into this county. Houston ranked as the third-largest city within Fort Bend County by population, after Missouri City and Sugar Land.[7]
Race and ethnic origins
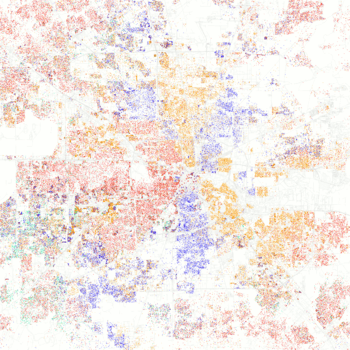
Houston is a diverse and international city, in part because of its many academic institutions and strong biomedical, energy, manufacturing and aerospace industries. According to the U.S. Census 2000, the racial makeup of the city was 49.3% White (including Hispanic or Latino), 25.3% Black or African American, 0.4% Native American, 5.3% Asian, 0.18% Pacific Islander, 16.5% from other races, and 3.2% from two or more races. 37% of the population was Hispanic or Latino of any race. Since the 1990 Census, Houston's population has become majority-minority.
The Daily Mail stated, in regards to the 2000 census data, that the racial and ethnic diversity in Houston and Greater Houston increased in areas outside the center of the city, where living costs were lower and there was more residential development.[8]
Religion

According to a 2014 study by the Pew Research Center, 73% of the population of the city identified as Christian, with 50% saying they attended a variety of churches that could be considered Protestant, and 19% identifying as Roman Catholic.[9][10] Some 20% did not claim any religious affiliation. The PEW study said that adherents of other religions (including Judaism, Buddhism, Islam, and Hinduism) collectively make up about 7% of the population. Houston is also within the Bible Belt.[11]
Language
In the 2000 U.S. Census, 938,123 residents of the City of Houston said that they spoke English only. The largest foreign languages in Houston included Spanish and Spanish creole (679,292 speakers), Vietnamese (26,125 speakers), Chinese (24,234 speakers), African indigenous languages (11,603 speakers), and Urdu of Pakistan (10,669 speakers). Percentages of the non-English groups who said that they spoke English at least "very well" include 42% of the Spanish speakers, 32% of the Vietnamese speakers, 49% of the Chinese speakers, 72% of the speakers of indigenous African languages, and 70% of the speakers of Urdu.[12]
In 2000, 1,961,993 residents of Harris County spoke English only. The five largest foreign languages in the county were Spanish or Spanish Creole (1,106,883 speakers), Vietnamese (53,311 speakers), Chinese (33,003 speakers), French including Cajun and Patois (33,003 speakers), and Urdu of Pakistan (14,595 speakers). Percentages of language groups who said that they spoke English at least "very well" include 46% of Spanish speakers, 37% of Vietnamese speakers, 50% of Chinese speakers, 85% of French speakers, and 72% of Urdu speakers.[12] Southwestern Louisiana Creole language is spoken in Houston.[13]
As of 2015, about 40% of Harris County residents spoke languages other than English.[14]
National origin
Houston's foreign-born population increased by 400,000 in a ten-year span ending in 2010. During that span, of all U.S. cities, Houston had the second-largest increase of foreign-born persons.[14] As of 2011, 21.94% of Greater Houston residents were born in another country. This percentage was the fifth-largest in Texas.[15] In 2015 about 25% of the residents of Harris County, over one million persons, were immigrants. Surrounding counties have percentages similar to that of Harris County. As of that year, immigrants were widely dispersed throughout the Houston area.[14]
Refugee populations
Since the 1970s, when Houston began absorbing Vietnamese refugees after the Fall of Saigon, Houston has become a destination for refugee resettlement. About 1,600 refugees arrive at George Bush Intercontinental Airport per year. Refugees from Afghanistan, Bhutan, El Salvador, Cuba, Iraq, Myanmar, and Somalia have settled in Houston; Burundians from Rwanda have also settled in Houston. Over the three years leading to 2009, Houston took about 2,200 Burmese.[16] In 2014 4,818 refugees from 40 countries settled in Harris County. That year, of all counties in Texas, Harris County had the largest number of refugee settlements.[14]
LGBT community
Montrose historically was the center of the LGBT community in Houston. By 2011 many homosexual people moved to the Houston Heights and to suburbs in Greater Houston.[17]
Health
In 2010 the University of Texas Health Science Center at Houston released a Health of Houston Survey. Based on the survey results, 20% of area residents consider themselves to be in poor or fair health. Half of the Houston area residents do not have dental insurance. The area's percentage of individuals who report having psychiatric distress is twice the U.S. national average. Of the racial groups, after excluding illegal immigrants, Hispanics have the lowest rates of health insurance.[18] Houston is also part of the Stroke Belt along with many other Southern cities.[19]
Politics
In 2013 Allen Turner of the Houston Chronicle reported that residents of Harris County were "consistently conservative in elections," voting for Republican candidates in local, state and federal elections. But, according to a Rice University Kinder Institute for Urban Research 2013 opinion poll, they were surprisingly liberal on a variety of hot-button social topics, "such as immigration, gun control and equal matrimonial rights for same-sex couples".[20]
References
- ↑ Population of the 100 Largest Cities and Other Urban Places in the United States: 1790 to 1990. Campbell Gibson, Population Division, U.S. Census Bureau. Published June 1998. Last accessed January 11, 2007.
- ↑ "American FactFinder". United States Census Bureau. Retrieved 2008-01-31.
- ↑ Demographics. Greater Houston Partnership
- ↑ Annual Estimates of the Population for Incorporated Places over 100,000, Ranked by July 1, 2005 Population: April 1, 2000 to July 1, 2005 (SUB-EST2005-01). United States Census Bureau
- ↑ "Post-Census Population Change: Houston is growing faster than the state and the nation", Greater Houston Partnership
- ↑ "Houston Housing Trends and Values". HouseAlmanac.com. Retrieved 2009-12-14.
- ↑ De Mangin, Charles. "Neighborhood charts its course." Houston Chronicle. Thursday November 14, 2002. Retrieved on October 27, 2011.
- ↑ Gardner, David. "Revealed: The maps that show the racial breakdown of America’s biggest cities", Daily Mail. September 26, 2010. Retrieved on November 12, 2011.
- ↑ Major U.S. metropolitan areas differ in their religious profiles, Pew Research Center
- ↑ "America's Changing Religious Landscape". Pew Research Center: Religion & Public Life. May 12, 2015.
- ↑ Barry Vann, In Search of Ulster Scots Land; Barry Vann, "Natural Liberty in the Bible Belt," Nomocracy in Politics (February, 2014), http://nomocracyinpolitics.com/2014/02/03/natural-liberty-in-the-bible-belt-an-explanation-of-conservative-voting-patterns-in-southern-appalachia-by-barry-a-vann/
- 1 2 Rodriguez, Lori. "TRANSLATING A NEED / Language barriers / Immigrants see English as vital, but work, family limit time to learn" (Archive). Houston Chronicle. Monday September 18, 2006. A1. Retrieved on December 30, 2011.
- ↑ "French Creole Heritage". Laheritage.org. Retrieved April 23, 2014.
- 1 2 3 4 Rhor, Monica. "Immigrants from around the world are transforming Houston." Houston Chronicle. March 5, 2015. Updated March 7, 2015. Retrieved on March 8, 2015.
- ↑ Pulsinelli, Olivia. "Nearly 22% of Houston residents are immigrants, study shows," Houston Business Journal. October 16, 2012. Retrieved on November 9, 2013.
- ↑ Giglio, Mike. "The Burmese Come to Houston," Houston Press. September 1, 2009. 1. Retrieved on December 19, 2009.
- ↑ Oaklander, Mandy. "The Mayor of Montrose." Houston Press. 18 May 2011. 4. Retrieved on May 18, 2011.
- ↑ Ackerman, Todd. "Survey finds Houstonian health worse than national average." Houston Chronicle. Monday November 7, 2011. Retrieved on November 7, 2011. Map. (Image archive)
- ↑ Emily Ramshaw, East Texans’ Bad Health and Bad Habits Promote a ‘Stroke Belt’, The New York Times, January 14, 2011
- ↑ Turner, Allen. ""Survey finds area growing in 'tolerant traditionalists'," Houston Chronicle, 24 April 2013. Retrieved on April 25, 2013.
External links
- Houston demographics - Greater Houston Partnership - Houston.org
- Health of Houston Survey 2010 - University of Texas Health Science Center at Houston
- City of Houston page on demographic information
- Houston demographics at University of Wisconsin–Eau Claire
- Klineberg, Stephen L. "THE CHANGING FACE OF HOUSTON: Tracking the Economic and Demographic Transformations Through 30 Years of Survey." Posted at the City of Houston.
- Tolson, Mike. "Houston represents the changing face of the nation." Houston Chronicle. Thursday May 23, 2013.