University of Wales (UK Parliament constituency)
| University of Wales | |
|---|---|
|
Former University constituency for the House of Commons | |
| 1918–1950 |
University of Wales was a university constituency electing one member to the House of Commons of the Parliament of the United Kingdom, from 1918 to 1950. It returned one Member of Parliament (MP), elected under the first-past-the-post voting system.
Boundaries
This university constituency was created by the Representation of the People Act 1918. It was abolished in 1950 by the Representation of the People Act 1948.
The constituency was not a physical area. Its electorate consisted of the graduates of the University of Wales.
Unlike many other university constituencies, University of Wales never elected a Conservative MP, instead regularly electing Liberal MPs.
The constituency returned one Member of Parliament.
Members of Parliament
| Election | Member [1] | Party | Notes | |
|---|---|---|---|---|
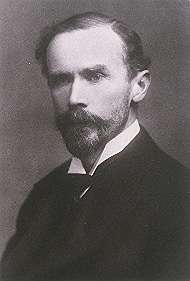
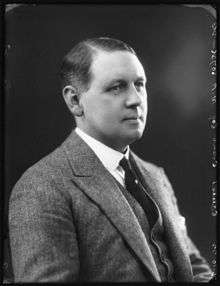
| 1918 | Rt Hon. John Herbert Lewis | Coalition Liberal | ||
| 1922 | Thomas Arthur Lewis | National Liberal | died 18 July 1923 | |
| 1923 | George Maitland Lloyd Davies | Christian Pacifist | Joined the Labour Party in February 1924 | |
| 1924 | Ernest Evans | Liberal | appointed County Court Judge in 1943 | |
| 1943 by-election | William John Gruffydd | Liberal | ||
| 1950 | University constituencies abolished | |||
Elections
The elections in this constituency took place using the first past the post electoral system. In university seats, in this period, the polls were open for five days and voting did not take place on the polling day for the territorial constituencies.
Elections of the 1910s

| Party | Candidate | Votes | % | ± | |
|---|---|---|---|---|---|
| Coalition Liberal | Rt Hon. John Herbert Lewis | 739 | 80.8 | N/A | |
| Labour | Millicent Hughes Mackenzie | 176 | 19.2 | N/A | |
| Majority | 563 | 61.6 | N/A | ||
| Turnout | 915 | 85.8 | N/A | ||
| Coalition Liberal win | |||||
Elections of the 1920s
- After the fall of the coalition government in 1922, the former Coalition Liberals contested elections as the National Liberal Party.

| Party | Candidate | Votes | % | ± | |
|---|---|---|---|---|---|
| National Liberal | Thomas Arthur Lewis | 487 | 39.5 | - 41.3 | |
| Liberal | Rt Hon. Sir Ellis Ellis-Griffith | 451 | 35.9 | N/A | |
| Labour | Olive Annie Wheeler | 309 | 24.8 | +5.6 | |
| Majority | 46 | 3.6 | -58.0 | ||
| Turnout | 1,247 | 87.2 | +1.4 | ||
| National Liberal hold | Swing | N/A | |||
- Seat vacant at the dissolution of Parliament, following the death of Lewis on 18 July 1923
| Party | Candidate | Votes | % | ± | |
|---|---|---|---|---|---|
| Christian Pacifist | George Maitland Lloyd Davies | 570 | 35.7 | n/a | |
| Liberal | Joseph Jones | 560 | 35.1 | -0.8 | |
| Independent Liberal | John Edwards | 467 | 29.2 | n/a | |
| Majority | 10 | 0.6 | |||
| Turnout | 83.1 | -4.1 | |||
| Independent gain from Liberal | Swing | n/a | |||

| Party | Candidate | Votes | % | ± | |
|---|---|---|---|---|---|
| Liberal | Ernest Evans | 1,057 | 59.4 | ||
| Christian Pacifist | George Maitland Lloyd Davies | 721 | 40.6 | ||
| Majority | 18.6 | ||||
| Turnout | 1,778 | ||||
| Liberal gain from Independent | Swing | ||||
| Party | Candidate | Votes | % | ± | |
|---|---|---|---|---|---|
| Liberal | Ernest Evans | 1,712 | 63.5 | +4.1 | |
| Labour | David W. Richards | 671 | 24.9 | n/a | |
| Unionist | Sir Courtenay Cecil Mansel | 314 | 11.6 | n/a | |
| Majority | 1,041 | 38.6 | +20.0 | ||
| Turnout | 74.4 | ||||
| Liberal hold | Swing | n/a | |||
Elections of the 1930s
| Party | Candidate | Votes | % | ± | |
|---|---|---|---|---|---|
| Liberal | Ernest Evans | 2,229 | |||
| Plaid Cymru | John Saunders Lewis | 914 | |||
| Majority | |||||
| Turnout | |||||
| Liberal hold | Swing | ||||
| Party | Candidate | Votes | % | ± | |
|---|---|---|---|---|---|
| Liberal | Ernest Evans | 2,796 | 61.3 | -9.6 | |
| Labour | Ithel Davies | 1,768 | 38.7 | N/A | |
| Majority | 1,028 | 22.6 | -19.2 | ||
| Turnout | 4,564 | 62.3 | +0.9 | ||
| Liberal hold | Swing | N/A | |||
Elections of the 1940s
General Election 1939/40: Another General Election was required to take place before the end of 1940. The political parties had been making preparations for an election to take place from 1939 and by the end of this year, the following candidates had been selected;
- Liberal: Ernest Evans
| Party | Candidate | Votes | % | ± | |
|---|---|---|---|---|---|
| Liberal | William John Gruffydd | 3,098 | 52.3 | -9.0 | |
| Plaid Cymru | John Saunders Lewis | 1,330 | 22.5 | N/A | |
| Independent | Alun Talfan Davies | 755 | 12.8 | N/A | |
| Independent Labour | Evan Davies | 634 | 10.7 | N/A | |
| Independent Labour | Neville Lawrence Evans | 101 | 1.7 | N/A | |
| Majority | 1,768 | 29.8 | +7.2 | ||
| Turnout | 5,918 | 53.4 | -9.0 | ||
| Liberal hold | Swing | N/A | |||
| Party | Candidate | Votes | % | ± | |
|---|---|---|---|---|---|
| Liberal | William John Gruffydd | 5,239 | 75.5 | +23.2 | |
| Plaid Cymru | Gwenan Jones | 1,696 | 24.5 | +2.0 | |
| Majority | 3,543 | 51.0 | +21.2 | ||
| Turnout | 6,935 | 58.5 | +5.1 | ||
| Liberal hold | Swing | ||||
See also
References
Sources
- British Parliamentary Election Results 1918-1949, by F.W.S. Craig (Macmillan 1977)
- Who's Who of British Members of Parliament, Vol. III 1918-1945, edited by M. Stenton and S. Lees (The Harvester Press 1979)