Timeline of the 1990 Atlantic hurricane season

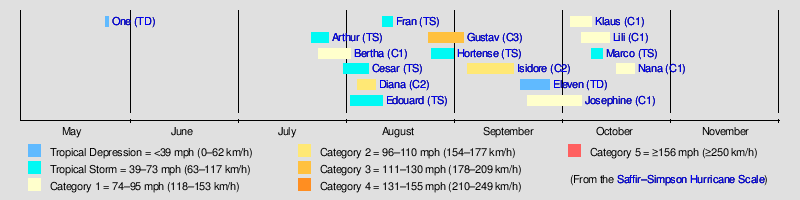
The 1990 Atlantic hurricane season featured the most named storms of any hurricane season at the time.[1] During the season, 14 tropical cyclones in the Atlantic Ocean became named storms. Although Tropical Depression One formed on May 24,[2] the season officially began on June 1; it ended on November 30, dates that conventionally delimit the period of each year when most tropical cyclones develop in the Atlantic basin.[3] The season's final storm, Hurricane Nana, dissipated on October 21.[2]
The season produced 16 tropical depressions, of which 14 intensified into tropical storms, 8 became hurricanes, and 1 became a major hurricane.[nb 1] Although the season had the highest number of named storms at the time, it featured only two notable storms, primarily because many of the tropical cyclones remained either weak or at sea. The two most significant storms of the season, in terms of damage and loss of life, were Hurricane Diana and Tropical Storm Marco. However, the strongest tropical cyclone of the season was Hurricane Gustav.[2]
This timeline includes information that was not operationally released, meaning that data from post-storm reviews by the National Hurricane Center, such as a storm that was not operationally warned upon, has been included. This timeline documents tropical cyclone formations, strengthening, weakening, landfalls, extratropical transitions, and dissipations during the season.
Timeline of storms
May

- May 24
- 1800 UTC (2:00 p.m. EDT) – Tropical Depression One develops roughly halfway between Limón, Honduras and Cape San Antonio, Cuba.[5]
- May 25
- 0000 UTC (8:00 p.m. EDT May 24) – Tropical Depression One attains its peak intensity with winds of 30 mph (45 km/h)[nb 2] and a minimum barometric pressure of 1007 mbar (hPa; 29.74 inHg).[5]
- Between 1200 and 1800 UTC (8:00 a.m. and 2:00 p.m. EDT) – Tropical Depression One makes landfall near Guasimal, Matanzas, Cuba with winds of 30 mph (45 km/h).[5]
- May 26
- 1200 UTC (8:00 a.m. EDT) – Tropical Depression One is absorbed by an approaching cold front while located about 45 miles (70 km) west of Key West, Florida.[5]
June
- No tropical cyclones form in the Atlantic Ocean.
- June 1
- 0000 UTC (8:00 p.m. EDT May 31) – The 1990 Atlantic hurricane season officially begins.[7]
July
- July 22
- 0600 UTC (2:00 a.m. EDT) – Tropical Depression Two develops about 1,345 miles (2,165 km) east of Port-of-Spain, Trinidad.[8]
- July 24
- 1200 UTC (8:00 a.m. EDT) – Tropical Depression Two intensifies into Tropical Storm Arthur.[8]
- 1200 UTC (8:00 a.m. EDT) – A subtropical depression develops just offshore of North Carolina.[9]
- July 25
- 1800 UTC (2:00 p.m. EDT) – Tropical Storm Arthur attains its peak intensity with winds of 70 mph (110 km/h) and a minimum barometric pressure of 995 mbar (hPa; 29.38 inHg).[8]
- July 27
- 0600 UTC (2:00 a.m. EDT) – Tropical Storm Arthur weakens to a tropical depression.[8]
- 0600 UTC (2:00 a.m. EDT) – The subtropical depression acquires tropical characteristics and is reclassified as Tropical Depression Three.[9]
- 1800 UTC (2:00 p.m. EDT) – Tropical Depression Arthur dissipates south of Jamaica.[8]
- July 28
- 0000 UTC (8:00 p.m. EDT July 27) – Tropical Depression Three intensifies into Tropical Storm Bertha.[9]
- July 29
- 0000 UTC (8:00 p.m. EDT July 28) – Tropical Storm Bertha intensifies into a Category 1 hurricane.[9]
- 1800 UTC (2:00 p.m. EDT) – Hurricane Bertha weakens to a tropical storm.[9]
.JPG)
- July 30
- 1200 UTC (8:00 a.m. EDT) – Tropical Storm Bertha re-intensifies into a Category 1 hurricane.[9]
- July 31
- 0000 UTC (8:00 p.m. EDT July 31) – Tropical Depression Four develops south of Cape Verde.[10]
August
- August 2
- 0000 UTC (8:00 p.m. EDT August 2) – Hurricane Bertha attains its peak intensity with winds of 80 mph (130 km/h) and a minimum barometric pressure of 973 mbar (hPa; 28.73 inHg).[9]
- 0000 UTC (8:00 p.m. EDT August 2) – Tropical Depression Four intensifies into Tropical Storm Cesar.[10]
- 0600 UTC (2:00 a.m. EDT) – Hurricane Bertha weakens to a tropical storm while making landfall near Sydney, Nova Scotia, with winds of 70 mph (115 km/h). Simultaneously, Tropical Storm Bertha transitions into an extratropical storm.[9]
- 1200 UTC (8:00 a.m. EDT) – Tropical Storm Cesar attains its peak intensity with winds of 50 mph (85 km/h) and a minimum barometric pressure of 1000 mbar (hPa; 29.53 inHg).[10]
- 1800 UTC (2:00 p.m. EDT) – A second subtropical depression develops in the vicinity of the Azores.[11]
- August 3
- 1200 UTC (8:00 a.m. EDT) – The second subtropical depression intensifies into a subtropical storm.[11]
- August 4
- 0000 UTC (8:00 p.m. EDT August 3) – Tropical Depression Five develops in the southwestern Caribbean Sea.[12]
- 1800 UTC (2:00 p.m. EDT) – The subtropical storm weakens to a subtropical depression.[11]
- August 5
- 0000 UTC (8:00 p.m. EDT August 4) – Tropical Depression Five intensifies into Tropical Storm Diana.[12]
- 2000 UTC (3:00 p.m. CDT) – Tropical Storm Diana makes landfall near Felipe Carrillo Puerto, Quintana Roo, on the Yucatan Peninsula with winds of 65 mph (100 km/h).[12]
- August 6
- 1200 UTC (8:00 a.m. EDT) – Tropical Storm Cesar weakens to a tropical depression.[10]
- 1800 UTC (2:00 p.m. EDT) – The subtropical depression acquires tropical characteristics and is reclassified as Tropical Depression Six.[11]
- August 7
- 0600 UTC (2:00 a.m. EDT) – Tropical Storm Diana intensifies into a Category 1 hurricane after emerging into the Bay of Campeche.[12]
- 1800 UTC (2:00 p.m. EDT) – Tropical Depression Cesar dissipates roughly 1,150 miles (1,850 km) east of Bermuda.[10]
- 1800 UTC (1:00 p.m. CDT) – Hurricane Diana intensifies into a Category 2 hurricane. Simultaneously, the storm attains its peak intensity with winds of 100 mph (165 km/h) and a minimum barometric pressure of 980 mbar (hPa; 28.94 inHg).[12]
- 1900 UTC (2:00 p.m. CDT) – Hurricane Diana makes landfall near Tuxpan, Veracruz, Mexico, with winds of 100 mph (165 km/h).[12]
- August 8
- 0000 UTC (7:00 p.m. CDT August 7) – Hurricane Diana rapidly weakens to a tropical storm.[12]
- 1200 UTC (7:00 a.m. CDT) – Tropical Storm Diana weakens to a tropical depression.[12]
- 1800 UTC (2:00 p.m. EDT) – Tropical Depression Six intensifies into Tropical Storm Edouard.[11]

- August 9
- 0600 UTC (2:00 a.m. EDT) – Tropical Storm Edouard attains its peak intensity with winds of 45 mph (75 km/h) and a minimum barometric pressure of 1003 mbar (hPa; 29.62 inHg).[11]
- 1800 UTC (12:00 p.m. MDT) – Tropical Depression Diana dissipates after emerging into the Gulf of California.[12]
- August 10
- 1200 UTC (8:00 a.m. EDT) – Tropical Storm Edouard weakens to a tropical depression.[11]
- August 11
- 1200 UTC (8:00 a.m. EDT) – Tropical Depression Edouard transitions into an extratropical storm while located east-northeast of the Azores.[11]
- 1200 UTC (8:00 a.m. EDT) – Tropical Depression Seven develops southwest of Cape Verde.[13]
- August 13
- 0000 UTC (8:00 p.m. EDT August 12) – Tropical Depression Seven degenerates into a tropical wave.[13]
- 1200 UTC (8:00 a.m. EDT) – The tropical wave re-generates into Tropical Depression Seven.[13]
- 1800 UTC (2:00 p.m. EDT) – Tropical Depression Seven intensifies into Tropical Storm Fran.[13]
- August 14
- 1200 UTC (8:00 a.m. EDT) – Tropical Storm Fran attains its peak intensity with winds of 40 mph (65 km/h) and a minimum pressure of 1007 mbar (hPa; 29.74 inHg).[13]
- 1800 UTC (2:00 p.m. EDT) – Due to heavy land interaction with Venezuela, Tropical Storm Fran dissipates in the extreme southeast Caribbean.[13]
- August 24
- 0600 UTC (2:00 a.m. EDT) – Tropical Depression Eight develops 965 miles (1,555 km) east of Barbados.[14]
- August 25
- 0000 UTC (8:00 p.m. EDT August 24) – Tropical Depression Eight intensifies into Tropical Storm Gustav.[14]
- 0000 UTC (8:00 p.m. EDT August 24) – Tropical Depression Nine develops 700 miles (1,100 km) west-southwest of Cape Verde.[15]
- August 26
- 0600 UTC (2:00 a.m. EDT) – Tropical Depression Nine intensifies into Tropical Storm Hortense.[15]
- 1200 UTC (8:00 a.m. EDT) – Tropical Storm Gustav intensifies into a Category 1 hurricane.[14]
- August 27
- 0600 UTC (2:00 a.m. EDT) – Hurricane Gustav intensifies into a Category 2 hurricane while passing 205 miles (330 km) to the east of the Lesser Antilles.[14]
- August 28
- 1200 UTC (8:00 a.m. EDT) – Tropical Storm Hortense attains its peak intensity with winds of 65 mph (100 km/h) and a minimum pressure of 993 mbar (hPa; 29.32 inHg).[15]
- 1800 UTC (2:00 p.m. EDT) – Hurricane Gustav weakens to a Category 1 hurricane.[14]
- August 30
- 0600 UTC (2:00 a.m. EDT) – Hurricane Gustav re-intensifies into a Category 2 hurricane.[14]
- August 31
- 0000 UTC (8:00 p.m. EDT August 30) – Hurricane Gustav intensifies into a Category 3 hurricane.[14]
- 0000 UTC (8:00 p.m. EDT August 30) – Tropical Storm Hortense weakens to a tropical depression.[15]
- 0600 UTC (2:00 a.m. EDT) – Hurricane Gustav attains its peak intensity with winds of 120 mph (195 km/h) and a minimum barometric pressure of 956 mbar (hPa; 28.23 inHg).[14]
- 1200 UTC (8:00 a.m. EDT) – Tropical Depression Hortense dissipates about 805 miles (1,295 km) east-southeast of Bermuda.[15]
September
- September 1
- 0000 UTC (8:00 p.m. EDT August 31) – Hurricane Gustav weakens to a Category 2 hurricane.[14]
- 1800 UTC (2:00 p.m. EDT) – Hurricane Gustav weakens to a Category 1 hurricane.[14]
- September 2
- 1800 UTC (2:00 p.m. EDT) – Hurricane Gustav weakens to a tropical storm.[14]
- September 3
- 0600 UTC (2:00 a.m. EDT) – Tropical Storm Gustav transitions into an extratropical storm while located east of Newfoundland.[14]
- September 4
- 0000 UTC (8:00 p.m. EDT September 3) – Tropical Depression Ten develops southwest of Cape Verde.[16]
- September 5
- 1200 UTC (8:00 a.m. EDT) – Tropical Depression Ten intensifies into Tropical Storm Isidore.[16]
.JPG)
- September 7
- 0000 UTC (8:00 p.m. EDT September 6) – Tropical Storm Isidore intensifies into a Category 1 hurricane.[16]
- 1200 UTC (8:00 a.m. EDT) – Hurricane Isidore intensifies into a Category 2 hurricane. Simultaneously, the storm attains its peak intensity with winds of 100 mph (165 km/h) and a minimum barometric pressure of 978 mbar (hPa; 28.88 inHg).[16]
- 1800 UTC (2:00 p.m. EDT) – Hurricane Isidore weakens to a Category 1 hurricane.[16]
- September 8
- 1800 UTC (2:00 p.m. EDT) – Hurricane Isidore weakens to a tropical storm.[17]
- September 9
- 1800 UTC (2:00 p.m. EDT) – Tropical Storm Isidore re-intensifies into a Category 1 hurricane.[17]
- September 16
- 0600 UTC (2:00 a.m. EDT) – Hurricane Isidore weakens to a tropical storm.[17]
- September 17
- 1200 UTC (8:00 a.m. EDT) – Tropical Storm Isidore transitions into an extratropical cyclone while located a few hundred miles east of Cape Race.[17]
- September 18
- 0600 UTC (2:00 a.m. EDT) – Tropical Depression Eleven develops about midway between the Lesser Antilles and Africa.[5]

- September 20
- 1800 UTC (2:00 p.m. EDT) – Tropical Depression Eleven attains its peak intensity with winds of 35 mph (55 km/h) and a minimum barometric pressure of 1003 mbar (hPa; 29.62 inHg).[5]
- September 21
- 0600 UTC (2:00 a.m. EDT) – Tropical Depression Twelve develops west of Cape Verde.[18]
- September 24
- 1200 UTC (8:00 a.m. EDT) – Tropical Depression Twelve intensifies into Tropical Storm Josephine.[18]
- September 26
- 0600 UTC (2:00 a.m. EDT) – Tropical Storm Josephine weakens to a tropical depression.[18]
- September 27
- 1200 UTC (8:00 a.m. EDT) – Tropical Depression Eleven dissipates well north-northeast of the Lesser Antilles.[5]
October
- October 1
- 1200 UTC (8:00 a.m. EDT) – Tropical Depression Josephine re-intensifies into a tropical storm.[19]
- October 3
- 1200 UTC (8:00 a.m. EDT) – Tropical Depression Thirteen develops just east of the Lesser Antilles.[20]
- 1800 UTC (2:00 p.m. EDT) – Tropical Depression Thirteen intensifies into Tropical Storm Klaus.[20]

- October 5
- 0000 UTC (8:00 p.m. EDT October 4) – Tropical Storm Josephine intensifies into a Category 1 hurricane.[19]
- 1200 UTC (8:00 a.m. EDT) – Tropical Storm Klaus intensifies into a Category 1 hurricane, while about 12 miles (20 km) east of Barbuda.[20] Simultaneously, the storm attains its peak intensity with winds of 80 mph (130 km/h) and a minimum pressure of 985 mbar (hPa; 29.09 inHg).[20]
- 1800 UTC (2:00 p.m. EDT) – Hurricane Josephine attains its peak intensity with winds of 85 mph (140 km/h) and a minimum barometric pressure of 980 mbar (hPa; 28.94 inHg).[19]
- October 6
- 0600 UTC (2:00 a.m. EDT) – Hurricane Klaus weakens to a tropical storm.[20]
- 0600 UTC (2:00 a.m. EDT) – A subtropical depression develops 875 miles (1410 km) southeast of Cape Race.[21]
- 1200 UTC (8:00 a.m. EDT) – Hurricane Josephine weakens to a tropical storm.[19]
- 1800 UTC (2:00 p.m. EDT) – Tropical Storm Josephine transitions into an extratropical cyclone while west-northwest of the Azores.[19]
- October 8
- 0000 UTC (8:00 p.m. EDT October 7) – Tropical Storm Klaus weakens to a tropical depression.[20]
- 1200 UTC (8:00 a.m. EDT) – Tropical Depression Klaus re-intensifies into a tropical storm.[20]
- October 9
- 1200 UTC (8:00 a.m. EDT) – Tropical Depression Fourteen develops near Caibarién, Cuba.[22]
- 1800 UTC (2:00 p.m. EDT) – Tropical Storm Klaus is absorbed by a low pressure system.[20]
- October 10
- 1800 UTC (2:00 p.m. EDT) – Tropical Depression Fourteen intensifies into Tropical Storm Marco.[22]
- October 11
- 0000 UTC (8:00 p.m. EDT October 10) – The subtropical depression acquires tropical characteristics and strengthens into Hurricane Lili. Simultaneously, the storm attains its peak intensity with winds of 75 mph (120 km/h) and a minimum barometric pressure of 987 mbar (hPa; 29.15 inHg).[21]
- 0600 UTC (2:00 a.m. EDT) – Tropical Storm Marco attains its peak intensity with winds of 65 mph (100 km/h) and a minimum barometric pressure of 989 mbar (hPa; 29.21 inHg).[22]
- October 12
- 0000 UTC (8:00 p.m. EDT October 11) – Tropical Storm Marco weakens to a tropical depression while making landfall near Cedar Key, Florida.[22]
- 1200 UTC (2:00 p.m. EDT) – Tropical Depression Marco transitions into an extratropical cyclone near the Florida/Georgia border.[22]
- October 13
- 1200 UTC (8:00 a.m. EDT) – Hurricane Lili weakens to a tropical storm.[21]
- October 15
- 0000 UTC (8:00 p.m. EDT October 14) – Tropical Storm Lili transitions into an extratropical cyclone while just offshore of Nova Scotia.[21]
- October 16
- 0000 UTC (8:00 p.m. EDT October 15) – Tropical Depression Fifteen develops northeast of the Lesser Antilles.[23]
- 1800 UTC (2:00 p.m. EDT) – Tropical Depression Fifteen intensifies into Tropical Storm Nana.[23]
- October 17
- 1800 UTC (2:00 p.m. EDT) – Tropical Storm Nana intensifies into a Category 1 hurricane.[23]
- October 19
- 1200 UTC (8:00 a.m. EDT) – Hurricane Nana attains its peak intensity with winds of 85 mph (140 km/h) and a minimum barometric pressure of 989 mbar (hPa; 29.21 inHg).[23]
- October 20
- 0000 UTC (8:00 p.m. EDT October 19) – Hurricane Nana weakens to a tropical storm.[23]
- October 21
- 0000 UTC (8:00 p.m. EDT October 20) – Tropical Storm Nana weakens to a tropical depression.[23]
- 1800 UTC (2:00 p.m. EDT) – Tropical Depression Nana dissipates south of Bermuda.[23]
November
- No tropical cyclones form in the Atlantic Ocean during the month of November.
- November 30
- 2359 UTC (7:59 p.m. EDT) – The 1990 Atlantic hurricane season officially ends.[7]
See also
Notes
- ↑ A major hurricane is a storm that ranks as Category 3 or higher on the Saffir–Simpson Hurricane Scale.[4]
- ↑ The figures for maximum sustained winds and position estimates are rounded to the nearest 5 units (knots, miles, or kilometers), following the convention used in the National Hurricane Center's operational products for each storm.[6] All other units are rounded to the nearest digit.
References
- ↑ Musgrave, Jane (23 November 1990). "Hurricane season fizzles". Star-Banner. South Florida Sun-Sentinel. Retrieved 31 March 2012.
- 1 2 3 Mayfield, Max & Lawrence, Miles (1991). "Atlantic Hurricane Season of 1990". Monthly Weather Review. National Hurricane Center. 119 (8): 2014. Bibcode:1991MWRv..119.2014M. doi:10.1175/1520-0493(1991)119<2014:AHSO>2.0.CO;2. Retrieved 31 March 2012.
- ↑ "Hurricane season begins among dire predictions". The Hour. Associated Press. 1 June 1980. Retrieved 31 March 2012.
- ↑ Goldberg, Stan. "What is a super-typhoon? What is a major hurricane ? What is an intense hurricane?". Atlantic Oceanographic and Meteorological Laboratory. Retrieved 17 February 2012.
- 1 2 3 4 5 6 7 Roth, David (2011). "CLIQR database". Hydrometeorological Prediction Center. Retrieved 31 January 2012.
- ↑ "How To Read The Public Advisory". National Hurricane Center. 11 August 2011. Retrieved 17 February 2012.
- 1 2 Dorst, Neal (21 January 2010). "FAQ: When is hurricane season?". Atlantic Oceanographic and Meteorological Laboratory. Retrieved 1 February 2012.
- 1 2 3 4 5 Lawrence, Miles (1990). "Tropical Storm Arthur Preliminary Report". National Hurricane Center. p. 3. Retrieved 1 February 2012.
- 1 2 3 4 5 6 7 8 Gerrish, Hal (1990). "Hurricane Bertha Preliminary Report". National Hurricane Center. p. 8. Retrieved 1 February 2012.
- 1 2 3 4 5 Mayfield, Max (1990). "Tropical Storm Cesar Preliminary Report". National Hurricane Center. p. 3. Retrieved 1 February 2012.
- 1 2 3 4 5 6 7 8 Case, Robert (1990). "Tropical Storm Edouard Preliminary Report". National Hurricane Center. p. 3. Retrieved 1 February 2012.
- 1 2 3 4 5 6 7 8 9 Avila, Lixion (1990). "Hurricane Diana Preliminary Report". National Hurricane Center. p. 4. Retrieved 1 February 2012.
- 1 2 3 4 5 6 Lawrence, Miles (1990). "Tropical Storm Fran Preliminary Report". National Hurricane Center. p. 3. Retrieved 1 February 2012.
- 1 2 3 4 5 6 7 8 9 10 11 12 Gerrish, Hal (1990). "Hurricane Gustav Preliminary Report". National Hurricane Center. p. 7. Retrieved 1 February 2012.
- 1 2 3 4 5 Mayfield, Max (1990). "Tropical Storm Hortense Preliminary Report". National Hurricane Center. p. 3. Retrieved 1 February 2012.
- 1 2 3 4 5 Avila, Lixion (1990). "Hurricane Isidore Preliminary Report". National Hurricane Center. p. 3. Retrieved 2 February 2012.
- 1 2 3 4 Avila, Lixion (1990). "Hurricane Isidore Preliminary Report". National Hurricane Center. p. 4. Retrieved 2 February 2012.
- 1 2 3 Case, Robert (1990). "Hurricane Josephine Preliminary Report". National Hurricane Center. p. 4. Retrieved 2 February 2012.
- 1 2 3 4 5 Case, Robert (1990). "Hurricane Josephine Preliminary Report". National Hurricane Center. p. 5. Retrieved 2 February 2012.
- 1 2 3 4 5 6 7 8 Lawrence, Miles (1990). "Hurricane Klaus Preliminary Report". National Hurricane Center. p. 4. Retrieved 4 February 2012.
- 1 2 3 4 Gerrish, Hal (1990). "Hurricane Lili Preliminary Report". National Hurricane Center. p. 4. Retrieved 4 February 2012.
- 1 2 3 4 5 Mayfield, Max (1990). "Tropical Storm Marco Preliminary Report". National Hurricane Center. p. 6. Retrieved 4 February 2012.
- 1 2 3 4 5 6 7 Avila, Lixion (1990). "Hurricane Nana Preliminary Report". National Hurricane Center. p. 5. Retrieved 4 February 2012.
Tropical cyclones of the 1990 Atlantic hurricane season | ||
|---|---|---|
| ||
| ||
| Preceded by 1989 |
Atlantic hurricane seasons timelines 1990 |
Succeeded by 1992 |