Sault Ste. Marie (provincial electoral district)
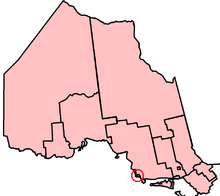 Sault Ste. Marie in relation to other Northern Ontario electoral districts | |||
| Provincial electoral district | |||
| Legislature | Legislative Assembly of Ontario | ||
| MPP |
| ||
| District created | 1890 | ||
| First contested | 1890 | ||
| Last contested | 2014 | ||
| Demographics | |||
| Population (2011) | 75,141 | ||
| Electors (2007) | 57,907 | ||
| Area (km²) | 247 | ||
| Pop. density (per km²) | 304.2 | ||
| Census divisions | Algoma | ||
| Census subdivisions | Sault Ste. Marie | ||
Sault Ste. Marie is a provincial electoral district in the Legislative Assembly of Ontario since 1890 when it was created. The electoral district consists of the City of Sault Ste. Marie, bounded by Prince Township, and the Rankin Indian Reserve 15D.
In 1996, Ontario was divided into the same electoral districts as those used for federal electoral purposes. They were redistributed whenever a readjustment took place at the federal level.
In 2005, legislation was passed by the Legislature to divide Ontario into 107 electoral districts, beginning with the next provincial election in 2007. The eleven northern electoral districts, including Sault Ste. Marie, are those defined for federal purposes in 1996, based on the 1991 census (except for a minor boundary adjustment). The 96 southern electoral districts are those defined for federal electoral purposes in 2003, based on the 2001 census. Without this legislation, the number of electoral districts in northern Ontario would have been reduced from eleven to ten.[1]
Members of Provincial Parliament
This riding has elected the following members of the Legislative Assembly of Ontario:
Election results
| Ontario general election, 2014 | ||||||||
|---|---|---|---|---|---|---|---|---|
| Party | Candidate | Votes | % | ∆% | ||||
| Liberal | David Orazietti | 17,490 | 58.53 | +3.59 | ||||
| New Democratic | Celia Ross | 7,611 | 25.47 | -5.40 | ||||
| Progressive Conservative | Rod Fremlin | 3,703 | 12.39 | +0.56 | ||||
| Green | Kara Flannigan | 965 | 3.23 | +1.46 | ||||
| Libertarian | Austin Williams | 115 | 0.38 | |||||
| Total valid votes | 29,884 | 100.00 | ||||||
| Liberal hold | Swing | +4.50 | ||||||
| Source: Elections Ontario[2] | ||||||||
| Ontario general election, 2011 | ||||||||
|---|---|---|---|---|---|---|---|---|
| Party | Candidate | Votes | % | ∆% | ||||
| Liberal | David Orazietti | 16,109 | 54.95 | -5.20 | ||||
| New Democratic | Celia Ross | 9,037 | 30.83 | +4.44 | ||||
| Progressive Conservative | Jib Turner | 3,477 | 11.86 | +4.61 | ||||
| Green | Luke Macmichael | 519 | 1.77 | -2.55 | ||||
| Family Coalition | Matthew Hunt | 172 | 0.59 | -1.29 | ||||
| Total valid votes | 29,314 | 100.00 | ||||||
| Total rejected, unmarked and declined ballots | 147 | 0.50 | ||||||
| Turnout | 29,461 | 49.35 | ||||||
| Eligible voters | 59,698 | |||||||
| Liberal hold | Swing | -4.82 | ||||||
| Source: Elections Ontario[3] | ||||||||
| Ontario general election, 2007 | ||||||||
|---|---|---|---|---|---|---|---|---|
| Party | Candidate | Votes | % | ∆% | ||||
| Liberal | David Orazietti | 19,313 | 60.15 | +3.11 | ||||
| New Democratic | Jeff Arbus | 8,474 | 26.39 | -5.98 | ||||
| Progressive Conservative | Josh Pringle | 2,329 | 7.25 | -0.36 | ||||
| Green | André Riopel | 1,386 | 4.32 | +3.07 | ||||
| Family Coalition | Bill Murphy | 605 | 1.88 | +0.16 | ||||
| Total valid votes | 32,107 | 100.00 | ||||||
| Ontario general election, 2003 | ||||||||
|---|---|---|---|---|---|---|---|---|
| Party | Candidate | Votes | % | ∆% | ||||
| Liberal | David Orazietti | 20,050 | 57.04 | +29.45 | ||||
| New Democratic | Tony Martin | 11,379 | 32.37 | -10.86 | ||||
| Progressive Conservative | Bruce Willson | 2,674 | 7.61 | -20.79 | ||||
| Family Coalition | Al Walker | 606 | 1.72 | |||||
| Green | Dan Brosemer | 441 | 1.25 | |||||
| Total valid votes | 35,150 | 100.00 | ||||||
| Ontario general election, 1999 | ||||||||
|---|---|---|---|---|---|---|---|---|
| Party | Candidate | Votes | % | |||||
| New Democratic | Tony Martin | 15,949 | 43.23 | |||||
| Progressive Conservative | James Caicco | 10,477 | 28.4 | |||||
| Liberal | Terry Sheehan | 10,180 | 27.59 | |||||
| Natural Law | Colleen Hibbs | 288 | 0.78 | |||||
| Total valid votes | 36,894 | 100.00 | ||||||
2007 electoral reform referendum
| Ontario electoral reform referendum, 2007 | |||
|---|---|---|---|
| Side | Votes | % | |
| First Past the Post | 22,830 | 73.8 | |
| Mixed member proportional | 8,105 | 26.2 | |
| Total valid votes | 30,935 | 100.0 | |
References
- ↑ Elections Ontario web site, “New Electoral Boundaries”
- ↑ Elections Ontario (2014). "General Election Results by District, 079 Sault Ste. Marie". Retrieved 13 June 2014.
- ↑ Elections Ontario (2011). "Official return from the records / Rapport des registres officiels - Sault Ste. Marie" (PDF). Retrieved 1 June 2014.
Sources
- Elections Ontario
Coordinates: 46°32′31″N 84°20′41″W / 46.5419°N 84.3448°W