Algoma—Manitoulin (provincial electoral district)
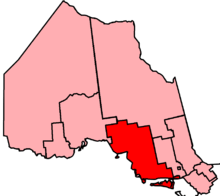 Algoma—Manitoulin in relation to other northern Ontario electoral districts | |||
| Provincial electoral district | |||
| Legislature | Legislative Assembly of Ontario | ||
| MPP |
| ||
| First contested | 1934 | ||
| Last contested | 2014 | ||
| Demographics | |||
| Population (2001) | 73,398 | ||
| Electors (2007) | 48,800 | ||
| Area (km²) | 85,363 | ||
| Pop. density (per km²) | 0.86 | ||
| Census divisions | Algoma, Manitoulin, Sudbury, Thunder Bay | ||
| Census subdivisions | Blind River, Elliot Lake, Espanola, Wawa | ||
Algoma—Manitoulin is a provincial electoral district in Ontario, Canada, that has been represented in the Legislative Assembly of Ontario since 1934.
Between 1986 and 1999, the district consisted of all of Algoma District minus two townships south of Hearst, an area of the southeast, which included Elliot Lake and everything east of it, and the city of Sault Ste. Marie.
In 1996, Ontario was divided into the same electoral districts as those used for federal electoral purposes. They were redistributed whenever a readjustment took place at the federal level.
In 2005, legislation was passed by the Legislature to divide Ontario into 107 electoral districts, beginning with the next provincial election in 2007. The eleven northern electoral districts, including Algoma—Manitoulin, are those defined for federal purposes in 1996, based on the 1991 census (except for a minor boundary adjustment). The 96 southern electoral districts are those defined for federal electoral purposes in 2003, based on the 2001 census. Without this legislation, the number of electoral districts in northern Ontario would have been reduced from eleven to ten.[1]
Members of Provincial Parliament
This riding has elected the following members of the Legislative Assembly of Ontario:
| Algoma—Manitoulin | ||||
|---|---|---|---|---|
| Assembly | Years | Member | Party | |
| Riding created | ||||
| 19th | 1934–1937 | Wilfred Miller | Liberal | |
| 20th | 1937–1943 | |||
| 21st | 1943–1945 | |||
| 22nd | 1945–1948 | John Fullerton | Progressive Conservative | |
| 23rd | 1948–1951 | |||
| 24th | 1951–1955 | |||
| 25th | 1955–1959 | |||
| 26th | 1959–1963 | |||
| 27th | 1963–1967 | Stanley Farquhar | Liberal | |
| 28th | 1967–1971 | |||
| 29th | 1971–1975 | John Lane | Progressive Conservative | |
| 30th | 1975–1977 | |||
| 31st | 1977–1981 | |||
| 32nd | 1981–1985 | |||
| 33rd | 1985–1987 | |||
| 34th | 1987–1990 | Michael A. Brown | Liberal | |
| 35th | 1990–1995 | |||
| 36th | 1995–1999 | |||
| 37th | 1999–2003 | |||
| 38th | 2003–2007 | |||
| 39th | 2007–2011 | |||
| 40th | 2011–2014 | Michael Mantha | New Democratic | |
| 41st | 2014–Present | |||
Election results (since 1967)
| Ontario general election, 2014 | ||||||||
|---|---|---|---|---|---|---|---|---|
| Party | Candidate | Votes | % | ∆% | ||||
| New Democratic | Michael Mantha | 14,171 | 53.41 | +8.89 | ||||
| Liberal | Craig Hughson | 6,504 | 24.51 | −3.91 | ||||
| Progressive Conservative | Jib Turner | 4,589 | 17.30 | −6.30 | ||||
| Green | Alexandra Zalucky | 828 | 3.12 | +0.49 | ||||
| Libertarian | Richard Hadidian | 441 | 1.66 | |||||
| Total valid votes | 26,533 | 100.00 | +1.93 | |||||
| Total rejected, unmarked and declined ballots | 327 | 1.22 | +0.71 | |||||
| Turnout | 26,860 | 49.38 | −0.05 | |||||
| Eligible voters | 54,395 | +2.75 | ||||||
| New Democratic hold | Swing | +6.40 | ||||||
Source(s)
Elections Ontario. "Official Return from the Records, 002 Algoma-Manitoulin" (PDF). Retrieved 22 March 2015. | ||||||||
| Ontario general election, 2011 | ||||||||
|---|---|---|---|---|---|---|---|---|
| Party | Candidate | Votes | % | ∆% | ||||
| New Democratic | Michael Mantha | 11,585 | 44.52 | +7.57 | ||||
| Liberal | Michael A. Brown | 7,397 | 28.42 | -14.14 | ||||
| Progressive Conservative | Joe Chapman | 6,141 | 23.60 | +9.58 | ||||
| Green | Jason Tilson | 684 | 2.63 | -2.52 | ||||
| Family Coalition | David Hoffman | 217 | 0.83 | -0.50 | ||||
| Total valid votes | 26,024 | 100.0 | ||||||
| Total rejected, unmarked and declined ballots | 134 | 0.51 | ||||||
| Turnout | 26,158 | 49.43 | ||||||
| Eligible voters | 52,919 | |||||||
| New Democratic gain from Liberal | Swing | +10.86 | ||||||
| Source: Elections Ontario[2] | ||||||||
| Ontario general election, 2007 | ||||||||
|---|---|---|---|---|---|---|---|---|
| Party | Candidate | Votes | % | ∆% | ||||
| Liberal | Mike Brown | 11,361 | 42.56 | -6.12 | ||||
| New Democratic | Peter Denley | 9,863 | 36.95 | +5.24 | ||||
| Progressive Conservative | Ron Swain | 3,744 | 14.02 | -3.31 | ||||
| Green | Ron Yurick | 1,374 | 5.15 | +2.87 | ||||
| Family Coalition | Ray Scott | 354 | 1.33 | |||||
| Total valid votes | 26,696 | 100.01 | ||||||
| Ontario general election, 2003 | ||||||||
|---|---|---|---|---|---|---|---|---|
| Party | Candidate | Votes | % | ∆% | ||||
| Liberal | Michael A. Brown | 14,520 | 48.68 | +4.16 | ||||
| New Democratic | Peter Denley | 9,459 | 31.71 | +4.38 | ||||
| Progressive Conservative | Terry McCutcheon | 5,168 | 17.33 | -9.50 | ||||
| Green | Ron Yurick | 680 | 2.28 | |||||
| Total valid votes | 29,827 | 100.0 | ||||||
| Ontario general election, 1999 | ||||||||
|---|---|---|---|---|---|---|---|---|
| Party | Candidate | Votes | % | ∆% | ||||
| Liberal | Michael A. Brown | 14,299 | 44.52 | +1.43 | ||||
| New Democratic | Lynn Watson | 8,780 | 27.33 | +6.51 | ||||
| Progressive Conservative | Keith Currie | 8,617 | 26.83 | -9.26 | ||||
| Libertarian | Graham Hearn | 425 | 1.32 | |||||
| Total valid votes | 32,121 | 100.0 | ||||||
| Ontario general election, 1995 | ||||||||
|---|---|---|---|---|---|---|---|---|
| Party | Candidate | Votes | % | ∆% | ||||
| Liberal | Michael A. Brown | 6,190 | 43.09 | +4.23 | ||||
| Progressive Conservative | Joyce Foster | 5,184 | 36.08 | +21.98 | ||||
| New Democratic | Lois Miller | 2,991 | 20.82 | -16.69 | ||||
| Total valid votes | 14,365 | 100.0 | ||||||
| Ontario general election, 1990 | ||||||||
|---|---|---|---|---|---|---|---|---|
| Party | Candidate | Votes | % | ∆% | ||||
| Liberal | Michael A. Brown | 5,961 | 38.86 | -7.19 | ||||
| New Democratic | Lois Miller | 5,754 | 37.51 | +9.29 | ||||
| Progressive Conservative | Ken Ferguson | 2,163 | 14.10 | -11.63 | ||||
| Confederation of Regions | Richard Hammond | 1,114 | 7.26 | |||||
| Independent | Gene Solomon | 347 | 2.26 | |||||
| Total valid votes | 15,339 | 100.0 | ||||||
| Ontario general election, 1987 | ||||||||
|---|---|---|---|---|---|---|---|---|
| Party | Candidate | Votes | % | ∆% | ||||
| Liberal | Michael A. Brown | 7,157 | 46.05 | +15.08 | ||||
| New Democratic | Ron Boucher | 4,385 | 28.22 | +6.43 | ||||
| Progressive Conservative | Ben Wilson | 3,999 | 25.73 | -21.51 | ||||
| Total valid votes | 15,541 | 100.0 | ||||||
| Ontario general election, 1985 | ||||||||
|---|---|---|---|---|---|---|---|---|
| Party | Candidate | Votes | % | ∆% | ||||
| Progressive Conservative | John Gordon Lane | 7,174 | 47.24 | -10.12 | ||||
| Liberal | Tom Farquhar | 4,704 | 30.97 | +7.05 | ||||
| New Democratic | Len Hembruf | 3,309 | 21.79 | +3.08 | ||||
| Total valid votes | 15,187 | 100.0 | ||||||
| Ontario general election, 1981 | ||||||||
|---|---|---|---|---|---|---|---|---|
| Party | Candidate | Votes | % | ∆% | ||||
| Progressive Conservative | John Gordon Lane | 7,160 | 57.36 | +0.72 | ||||
| Liberal | Ernest Massicotte | 2,986 | 23.92 | -2.83 | ||||
| New Democratic | Peter Boychuk | 2,336 | 18.71 | +2.1 | ||||
| Total valid votes | 12,482 | 100.0 | ||||||
| Ontario general election, 1977 | ||||||||
|---|---|---|---|---|---|---|---|---|
| Party | Candidate | Votes | % | ∆% | ||||
| Progressive Conservative | John Gordon Lane | 7,381 | 56.64 | +15.93 | ||||
| Liberal | Don Prescott | 3,486 | 26.75 | -0.05 | ||||
| New Democratic | Tasso Christie | 2,165 | 16.61 | -15.88 | ||||
| Total valid votes | 13,032 | 100.0 | ||||||
| Ontario general election, 1975 | ||||||||
|---|---|---|---|---|---|---|---|---|
| Party | Candidate | Votes | % | ∆% | ||||
| Progressive Conservative | John Gordon Lane | 5,452 | 40.71 | +0.39 | ||||
| New Democratic | Winston Baker | 4,352 | 32.49 | +2.33 | ||||
| Liberal | Leo A. Foucault | 3,589 | 26.80 | -2.72 | ||||
| Total valid votes | 13,393 | 100.0 | ||||||
| Ontario general election, 1971 | ||||||||
|---|---|---|---|---|---|---|---|---|
| Party | Candidate | Votes | % | ∆% | ||||
| Progressive Conservative | John Gordon Lane | 5,147 | 40.32 | +9.5 | ||||
| New Democratic | Roger Taylor | 3,849 | 30.16 | +6.11 | ||||
| Liberal | Austin H. Hunt | 3,768 | 29.52 | -15.6 | ||||
| Total valid votes | 12,764 | 100.0 | ||||||
| Ontario general election, 1967 | ||||||||
|---|---|---|---|---|---|---|---|---|
| Party | Candidate | Votes | % | |||||
| Liberal | Stan Farquhar | 4,424 | 45.12 | |||||
| Progressive Conservative | Charles Stewart | 3,022 | 30.82 | |||||
| New Democratic | Len Lefebvre | 2,358 | 24.05 | |||||
| Total valid votes | 9,804 | 100.0 | ||||||
2007 electoral reform referendum
| Ontario electoral reform referendum, 2007 | |||
|---|---|---|---|
| Side | Votes | % | |
| First Past the Post | 18,097 | 69.9 | |
| Mixed member proportional | 7,794 | 30.1 | |
| Total valid votes | 25,891 | 100.0 | |
Notes
- ↑ Elections Ontario web site, “New Electoral Boundaries”
- ↑ Elections Ontario (2011). "Official return from the records / Rapport des registres officiels - Algoma—Manitoulin" (PDF). Retrieved 1 June 2014.
Sources
- Elections Ontario Results
- Elections Ontario Past Election Results
Coordinates: 48°02′17″N 83°48′25″W / 48.038°N 83.807°W