Saint-Patrice-de-Sherrington, Quebec
| Saint-Patrice-de-Sherrington | |
|---|---|
| Municipality | |
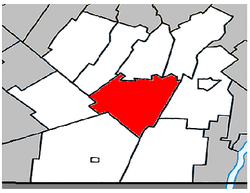 Location within Les Jardins-de-Napierville RCM. | |
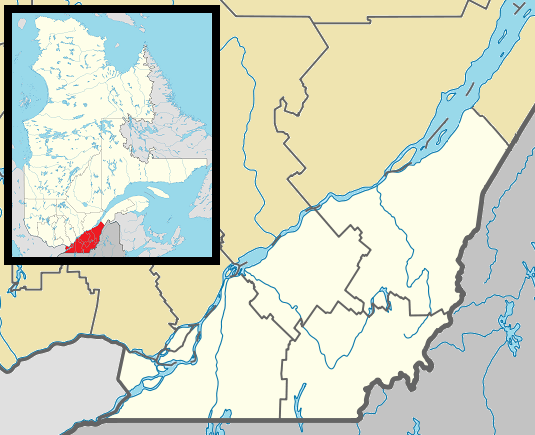 Saint-Patrice-de-Sherrington Location in southern Quebec. | |
| Coordinates: 45°10′N 73°31′W / 45.167°N 73.517°WCoordinates: 45°10′N 73°31′W / 45.167°N 73.517°W[1] | |
| Country |
|
| Province |
|
| Region | Montérégie |
| RCM | Les Jardins-de-Napierville |
| Constituted | July 1, 1855 |
| Government[2][3] | |
| • Mayor | Daniel Lussier |
| • Federal riding | Beauharnois—Salaberry |
| • Prov. riding | Huntingdon |
| Area[2][4] | |
| • Total | 92.90 km2 (35.87 sq mi) |
| • Land | 92.65 km2 (35.77 sq mi) |
| Population (2011)[4] | |
| • Total | 1,971 |
| • Density | 21.3/km2 (55/sq mi) |
| • Pop 2006-2011 |
|
| • Dwellings | 769 |
| Time zone | EST (UTC−5) |
| • Summer (DST) | EDT (UTC−4) |
| Postal code(s) | J0L 2N0 |
| Area code(s) | 450 and 579 |
| Highways |
|
| Geocode | 68025 |
| Website |
www sherrington |
Saint-Patrice-de-Sherrington is a municipality in Les Jardins-de-Napierville Regional County Municipality in Quebec, Canada, situated in the Montérégie administrative region. The population as of the Canada 2011 Census was 1,971.
Demographics
Population
| Canada census – Saint-Patrice-de-Sherrington, Quebec community profile | |||
|---|---|---|---|
| 2011 | 2006 | 2001 | |
| Population: | 1,971 (+3.1% from 2006) | 1,911 (-0.2% from 2001) | 1,915 (-2.3% from 1996) |
| Land area: | 92.65 km2 (35.77 sq mi) | 92.65 km2 (35.77 sq mi) | 92.65 km2 (35.77 sq mi) |
| Population density: | 21.3/km2 (55/sq mi) | 20.6/km2 (53/sq mi) | 20.7/km2 (54/sq mi) |
| Median age: | 41.0 (M: 40.6, F: 41.3) | 38.8 (M: 38.6, F: 39.0) | 37.1 (M: 37.2, F: 37.0) |
| Total private dwellings: | 769 | 730 | 708 |
| Median household income: | $53,631 | $47,986 | $44,880 |
| References: 2011[4] 2006[5] 2001[6] | |||
| Historical Census Data - Saint-Patrice-de-Sherrington, Quebec[7] | ||||||||||||||||||||||||||
|---|---|---|---|---|---|---|---|---|---|---|---|---|---|---|---|---|---|---|---|---|---|---|---|---|---|---|
|
|
| ||||||||||||||||||||||||
Language
| Canada Census Mother Tongue - Saint-Patrice-de-Sherrington, Quebec[7] | ||||||||||||||||||
|---|---|---|---|---|---|---|---|---|---|---|---|---|---|---|---|---|---|---|
| Census | Total | French |
English |
French & English |
Other | |||||||||||||
| Year | Responses | Count | Trend | Pop % | Count | Trend | Pop % | Count | Trend | Pop % | Count | Trend | Pop % | |||||
| 2011 |
1,965 |
1,830 | |
93.13% | 45 | |
2.29% | 15 | |
0.76% | 75 | |
3.82% | |||||
| 2006 |
1,905 |
1,690 | |
88.71% | 35 | |
2.07% | 10 | |
0.52% | 170 | |
8.92% | |||||
| 2001 |
1,910 |
1,755 | |
91.88% | 50 | |
2.62% | 15 | |
0.79% | 90 | |
4.71% | |||||
| 1996 |
1,955 |
1,770 | n/a | 90.54% | 75 | n/a | 3.84% | 0 | n/a | 0.00% | 110 | n/a | 5.63% | |||||
Education
The South Shore Protestant Regional School Board previously served the municipality.[8]
See also
References
- ↑ Reference number 57382 of the Commission de toponymie du Québec (French)
- 1 2 Ministère des Affaires municipales, des Régions et de l'Occupation du territoire: Saint-Patrice-de-Sherrington
- ↑ Riding history for Beauharnois—Salaberry, Quebec from the Library of Parliament
- 1 2 3 2011 Statistics Canada Census Profile: Saint-Patrice-de-Sherrington, Quebec
- ↑ "2006 Community Profiles". Canada 2006 Census. Statistics Canada. March 30, 2011. Retrieved 2014-04-10.
- ↑ "2001 Community Profiles". Canada 2001 Census. Statistics Canada. February 17, 2012. Retrieved 2014-04-10.
- 1 2 Statistics Canada: 1996, 2001, 2006, 2011 census
- ↑ King, M.J. (Chairperson of the board). "South Shore Protestant Regional School Board" (St. Johns, PQ). The News and Eastern Townships Advocate. Volume 119, No. 5. Thursday December 16, 1965. p. 2. Retrieved from Google News on November 23, 2014.
 |
Saint-Michel | Saint-Édouard | Saint-Jacques-le-Mineur | |
| Sainte-Clotilde | |
Saint-Cyprien-de-Napierville | ||
| ||||
| | ||||
| Hemmingford (township) | Saint-Bernard-de-Lacolle |
| Cities | |
|---|---|
| Municipalities | |
| Parishes | |
| Townships | |
| Villages | |
| |
This article is issued from Wikipedia - version of the 10/8/2016. The text is available under the Creative Commons Attribution/Share Alike but additional terms may apply for the media files.