Spanish general election, 1977
.svg.png)
|
|
|
|
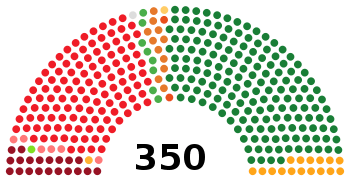
All 350 seats in the Congress of Deputies and 207 (of 248) seats in the Senate
176 seats needed for a majority in the Congress of Deputies |
| Registered |
23,583,762 |
| Turnout |
18,590,130 (78.8%) |
| |
First party |
Second party |
Third party |
| |
.jpg) |
.jpg) |
.jpg) |
| Leader |
Adolfo Suárez |
Felipe González |
Santiago Carrillo |
| Party |
UCD |
PSOE |
PCE |
| Leader since |
3 May 1977 |
13 October 1974 |
3 July 1960 |
| Leader's seat |
Madrid |
Madrid |
Madrid |
| Seats won |
165 |
118 |
20 |
| Popular vote |
6,310,391 |
5,371,866 |
1,709,890 |
| Percentage |
34.4% |
29.3% |
9.3% |
|
| |
Fourth party |
Fifth party |
Sixth party |
| |
.jpg) |
.jpg) |
.jpg) |
| Leader |
Manuel Fraga |
Enrique Tierno Galván |
Jordi Pujol |
| Party |
AP |
PSP |
PDC |
| Leader since |
9 October 1976 |
1974 |
17 November 1974 |
| Leader's seat |
Madrid |
Madrid |
Barcelona |
| Seats won |
16 |
6 |
11 |
| Popular vote |
1,526,671 |
816,582 |
514,647 |
| Percentage |
8.3% |
4.5% |
2.8% |
|

|
| Most voted party by autonomous community and province.
|
|
|
The Spanish general election of 1977 took place on 15 June 1977. It was the first election since the death of Francisco Franco. The previous general election was held in 1936, prior to the outbreak of the Spanish Civil War.
Voting was on the basis of universal suffrage in a secret ballot. The elections were held using closed list proportional representation in 52 electoral districts corresponding to the 50 provinces of Spain and the African enclaves of Ceuta and Melilla. The largest districts Barcelona, Madrid and Valencia elected 32, 31 and 15 members respectively. Other districts elected from 3 to 12 members. The exceptions were Ceuta and Melilla, which were single member districts. Seats were allocated using the D'Hondt method and only lists that polled 3% of the total vote (which included votes "en blanco" i.e., for none of the above) were eligible for seats. With the exception of the Communist Party of Spain, none of the parties that had supported the Second Republic or those descended from them were legalised until after the elections, and were therefore rendered ineligible to take part.[1]
The elections took place against the backdrop of a poor economic situation in Spain.[2] They were marred by demonstrations against alleged irregularities and bombings in many areas. In Barcelona, 2,000 demonstrators gathered outside the building housing the local election board. They claimed they had not been included in the census, which would have given them the right to vote. Two policemen were also hurt when a Molotov cocktail was thrown at their vehicle. In Seville, three people, including two policemen, suffered minor injuries when a bomb exploded at the magistrates' court. Additionally four explosions occurred in Pamplona and two in Cordoba.[3]
The election results were a disappointment for the Communist Party, which fell short of its goal of 30 to 40 deputies.[4]
Post election the Union of the Democratic Centre governed in a minority, working with other opposition parties from both sides of the political spectrum including the rightist People’s Alliance and the parties of the left, the Spanish Socialist Workers' Party (PSOE) and Communists (PCE).
Overview
Electoral system
- Congress of Deputies
The 350 members of the Congress of Deputies were elected in 50 multi-member districts using the D'Hondt method and a closed-list proportional representation. Ceuta and Melilla elected 1 member each using plurality voting. Each district was entitled to an initial minimum of 2 seats, with the remaining 248 seats being allocated among the 50 provinces in proportion to their populations. Only lists polling above 3% of the total vote in each district (which includes blank ballots—for none of the above) were entitled to enter the seat distribution.
- Senate
For the Senate, each of the 47 peninsular provinces was assigned 4 seats. For insular provinces, such as Baleares and Canaries, districts are the islands themselves, with the larger — Mallorca, Gran Canaria, and Tenerife — being assigned 3 seats each, and the smaller — Menorca, Ibiza-Formentera, Fuerteventura, Gomera, Hierro, Lanzarote and La Palma — 1 each. Ceuta and Melilla were assigned 2 seats each, for a total of 208 directly elected seats. In districts electing 4 seats, electors could vote for up to 3 candidates; in those with 2 or 3 seats, for up to 2 candidates; and for 1 candidate in single member constituencies. Electors would vote for individual candidates: those attaining the largest number of votes in each district would be elected for a 4-year term of office.
In addition, only for this election, 41 senators were named by royal designation.[5]
Eligibility
Dual membership of both chambers of the Cortes or of the Cortes and regional assemblies was prohibited. Active judges, magistrates, public defenders, serving military personnel, active police officers and members of constitutional and electoral tribunals were also ineligible.[6][7]
Parties and coalitions of different parties which had registered with the Electoral Commission could present lists of candidates.[7]
Opinion polls
Poll results are listed in the tables below in reverse chronological order, showing the most recent first, and using the date the survey's fieldwork was done, as opposed to the date of publication. If such date is unknown, the date of publication is given instead. The highest percentage figure in each polling survey is displayed in bold, and the background shaded in the leading party's colour. In the instance that there is a tie, then no figure is shaded. The lead column on the right shows the percentage-point difference between the two parties with the highest figures. When a specific poll does not show a data figure for a party, the party's cell corresponding to that poll is shown empty.
| Polling firm/Link |
Last date
of polling |
 |
.svg.png) |
 |
 |
 |
 |
 |
 |
Margin
of error |
Sample
size |
Lead |
|
|
|
|
|
|
|
|
|
| General Election |
June 15, 1977 |
34.4 |
29.3 |
9.3 |
8.2 |
4.5 |
2.8 |
1.6 |
1.2 |
|
|
5.1 |
|
| Gallup |
June 14, 1977 |
32.0 |
36.1 |
7.3 |
7.1 |
6.0 |
3.0 |
2.3 |
4.9 |
±2.8 pp |
1,200 |
4.1 |
| Análisis y Alternativas |
June 14, 1977 |
31.4 |
26.0 |
8.1 |
9.5 |
6.6 |
1.7 |
2.4 |
5.1 |
±2.5 pp |
1,285 |
5.4 |
| Facta Vector |
June 12, 1977 |
30.0 |
20.7 |
7.1 |
11.3 |
6.2 |
2.3 |
1.3 |
5.0 |
±1.4 pp |
5,100 |
9.3 |
| Alef |
June 11, 1977 |
33.7 |
20.0 |
10.8 |
11.3 |
8.0 |
|
|
11.4 |
|
|
13.7 |
| Metra Seis |
June 10, 1977 |
34.4 |
24.2 |
9.7 |
4.9 |
6.8 |
|
|
3.1 |
±2.4 pp |
1,700 |
10.2 |
| Sofemasa |
June 8, 1977 |
34.0 |
27.0 |
8.1 |
9.2 |
5.4 |
1.5 |
1.0 |
2.6 |
±0.8 pp |
15,875 |
7.0 |
| Metra Seis |
June 1, 1977 |
40.5 |
20.7 |
7.8 |
8.3 |
6.1 |
3.1 |
1.4 |
5.6 |
±2.4 pp |
1,700 |
19.8 |
| Sofemasa |
May 19, 1977 |
33.8 |
22.5 |
9.7 |
9.6 |
6.6 |
|
2.7 |
5.0 |
±2.4 pp |
1,638 |
11.3 |
| Sofemasa |
May 5, 1977 |
33.5 |
21.9 |
8.8 |
7.9 |
9.0 |
|
2.5 |
1.8 |
±2.5 pp |
1,595 |
11.6 |
Results
Congress of Deputies
Overall
|
Workers' Electoral Group (AET) |
77,575 | 0.42 | — |
0 | — |
|
Spanish Social Reform (RSE) |
64,241 | 0.35 | — |
0 | — |
|
Basque Country Left (EE) |
61,417 | 0.34 | — |
1 | — |
|
Authentic Spanish Falange of the JONS (FE–JONS(A)) |
46,548 | 0.25 | — |
0 | — |
|
Workers' Unity Front (FUT) |
41,208 | 0.22 | — |
0 | — |
|
Centre Independent Aragonese Candidature (CAIC) |
37,183 | 0.20 | — |
1 | — |
|
Basque Socialist Party (ESB/PSV) |
36,002 | 0.20 | — |
0 | — |
|
Socialist Party of the Valencian Country (PSPV) |
31,138 | 0.17 | — |
0 | — |
|
Centre Independent Candidature (INDEP) |
29,834 | 0.16 | — |
1 | — |
|
Galician Socialist Party (PSG) |
27,197 | 0.15 | — |
0 | — |
|
Navarrese Left Union (UNAI) |
24,489 | 0.13 | — |
0 | — |
|
Galician National-Popular Bloc (BNPG) |
22,771 | 0.12 | — |
0 | — |
|
Andalusian Regional Unity (URA) |
21,350 | 0.12 | — |
0 | — |
|
League of Catalonia–Catalan Liberal Party (LC–PLC) |
20,109 | 0.11 | — |
0 | — |
|
National Association for the Study of Actual Problems (ANEPA–CP) |
18,113 | 0.10 | — |
0 | — |
|
Navarrese Autonomist Union (UAN) |
18,079 | 0.10 | — |
0 | — |
|
United Canarian People (PCU) |
17,717 | 0.10 | — |
0 | — |
| Parties with less than 0.1% of the vote |
222,558 |
1.21 |
— |
0 |
— |
|
Basque Independent Democrats (DIV) |
15,505 | 0.08 | — |
0 | — |
|
People's Unity Candidates for Socialism (CUPS) |
12,040 | 0.07 | — |
0 | — |
|
Balearic Autonomist Union (UAB) |
11,914 | 0.07 | — |
0 | — |
|
Centre-left of Albacete (CIA) |
11,879 | 0.06 | — |
0 | — |
|
Regionalist Unity (UR) |
10,821 | 0.06 | — |
0 | — |
|
Independent Navarrese Front (FNI) |
10,606 | 0.06 | — |
0 | — |
|
Canarian People's Party (PPCAN) |
9,650 | 0.05 | — |
0 | — |
|
Social Christian Democracy of Catalonia (DSCC) |
9,157 | 0.05 | — |
0 | — |
|
Socialist Movement (MS) |
8,741 | 0.05 | — |
0 | — |
|
Montejurra–Federalism–Self-Management (MFA) |
8,461 | 0.05 | — |
0 | — |
|
Agrarian Social Action (ASA) |
8,439 | 0.05 | — |
0 | — |
|
Independent Candidature (INDEP) |
6,472 | 0.04 | — |
0 | — |
|
Basque Nationalist Action (EAE/ANV) |
6,435 | 0.04 | — |
0 | — |
|
Congress Independent Candidature for Girona (INDEP) |
6,411 | 0.03 | — |
0 | — |
|
Independent Candidature (INDEP) |
6,158 | 0.03 | — |
0 | — |
|
Aragonese Christian Democracy (DCAR) |
6,014 | 0.03 | — |
0 | — |
|
Independent Riojan Candidature (INDEP) |
5,682 | 0.03 | — |
0 | — |
|
People's Unity Candidates (CUP) |
5,206 | 0.03 | — |
0 | — |
|
Socialist Party of Canaries (PSCAN) |
5,110 | 0.03 | — |
0 | — |
|
Independent Party of Madrid (PIM) |
4,814 | 0.03 | — |
0 | — |
|
Aragonese Autonomist Front (FAA) |
4,791 | 0.03 | — |
0 | — |
|
Proverist Party (PPR) |
4,590 | 0.03 | — |
0 | — |
|
Independent (INDEP) |
4,530 | 0.02 | — |
0 | — |
|
United Canarian Left (ICU) |
4,118 | 0.02 | — |
0 | — |
|
Galician Democratic Party (PDG) |
3,196 | 0.02 | — |
0 | — |
|
Democrat Union of the Balearic Islands (UDIB) |
2,946 | 0.02 | — |
0 | — |
|
Independent Candidature (INDEP) |
2,737 | 0.01 | — |
0 | — |
|
Labourist Federation (FL) |
2,631 | 0.01 | — |
0 | — |
|
Independent (INDEP) |
2,622 | 0.01 | — |
0 | — |
|
Independent Riojan Group (INDEP) |
2,399 | 0.01 | — |
0 | — |
|
Independent (INDEP) |
2,347 | 0.01 | — |
0 | — |
|
Valencia Socialist Radical Party (PRSV) |
2,345 | 0.01 | — |
0 | — |
|
Carlist Electors of the Valencian Country (INDEP) |
2,252 | 0.01 | — |
0 | — |
|
Independent Candidature (INDEP) |
1,684 | 0.01 | — |
0 | — |
|
City and Country Independent Electoral Group (AEICYU) |
1,623 | 0.01 | — |
0 | — |
|
Regionalist Left Unitary Candidature (CUIR) |
1,504 | 0.01 | — |
0 | — |
|
Small Business Independent Candidates (CIPYE) |
1,480 | 0.01 | — |
0 | — |
|
Ceuta Electors' Association (ADEC) |
1,099 | 0.01 | — |
0 | — |
|
Carlist Electors' Group (ADC) |
938 | 0.01 | — |
0 | — |
|
Independent Spanish Falange (FEI) |
855 | 0.00 | — |
0 | — |
|
Spanish Agrarian Party (PAE) |
833 | 0.00 | — |
0 | — |
|
Independent Liberal Party (PLI) |
805 | 0.00 | — |
0 | — |
|
Independent (INDEP) |
492 | 0.00 | — |
0 | — |
|
Left Andalusian Bloc (BAI) |
226 | 0.00 | — |
0 | — |
|
Left Andalusian Candidature (CAI) |
0 | 0.00 | — |
0 | — |
|
Blank ballots |
46,248 | 0.25 | — |
|
|
| Total |
18,324,333 | 100.00 | |
350 | — |
|
| Valid votes |
18,324,333 | 98.57 | — |
|
| Invalid votes |
265,797 | 1.43 | — |
| Votes cast / turnout |
18,590,130 | 78.83 | — |
| Abstentions |
4,993,632 | 21.17 | — |
| Registered voters |
23,583,762 | |
|
| Source: Ministry of the Interior |
District summary
References
|
|---|
|
| General elections | |
|---|
|
| European elections | |
|---|
|
| Local elections | |
|---|
|
| Regional elections | |
|---|
|
| Referendums | |
|---|
|
- See also: Elections and referendums in Andalusia
- Aragon
- Asturias
- Balearic Islands
- Basque Country
- Canary Islands
- Cantabria
- Castile and León
- Castile-La Mancha
- Catalonia
- Extremadura
- Galicia
- Madrid
- Murcia
- Navarre
- La Rioja
- Valencian Community
|