New South Wales state election, 1935
New South Wales state election, 1935
|
|
|
|
|
|
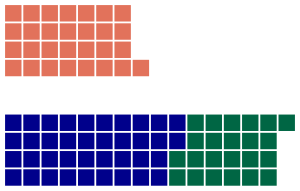
| Legislative Assembly after the election |
|
|
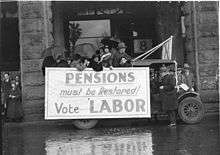
Campaigning in 1934
The 1935 New South Wales state election was held on 11 May 1935. This election was for all of the 90 seats in the 31st New South Wales Legislative Assembly and was conducted in single member constituencies with compulsory preferential voting.
The result of the election was:
The UAP/Country Party coalition of Bertram Stevens/Michael Bruxner had a majority of 32 (down 10) and continued in government throughout the term.
The ALP (NSW) and the Federal Executive of the Australian Labor Party were still divided at the 1935 election and the ALP (Federal) ran candidates in 22 seats without success. The parties were re-united in 1936. Jack Lang remained party leader and Leader of the Opposition throughout the term of the parliament.
Key dates
| Date |
Event |
| 12 April 1935 |
The Legislative Assembly was dissolved, and writs were issued by the Governor to proceed with an election. |
| 18 April 1935 |
Nominations for candidates for the election closed at noon. |
| 11 May 1935 |
Polling day. |
| 10 June 1935 |
The writs were returned and the results formally declared. |
| 12 June 1935 |
Opening of 31st Parliament. |
Results
|
New South Wales state election, 11 May 1935
Legislative Assembly
<< 1932 — 1938 >> |
| Enrolled voters |
1,347,884[1] |
|
|
| Votes cast |
1,255,419 |
|
Turnout |
96.06 |
−0.34 |
| Informal votes |
39,333 |
|
Informal |
3.04 |
0.83 |
| Summary of votes by party |
| Party |
Primary votes |
% |
Swing |
Seats |
Change |
| |
Labor (NSW) |
532,486 |
42.42 |
+2.26 |
29 |
+ 5 |
| |
United Australia |
415,485 |
33.10 |
–3.64 |
38 |
– 3 |
| |
Country |
162,178 |
12.92 |
–0.24 |
23 |
± 0 |
| |
Labor |
59,694 |
4.75 |
+0.51 |
0 |
± 0 |
| |
Communist |
19,105 |
1.52 |
+0.60 |
0 |
± 0 |
| |
Independent UAP |
11,114 |
0.89 |
+0.21 |
0 |
± 0 |
| |
Centre |
7,489 |
0.60 |
+0.60 |
0 |
± 0 |
| |
Independent Labor |
3,774 |
0.30 |
+0.16 |
0 |
± 0 |
| |
Social Credit |
1,996 |
0.16 |
+0.16 |
0 |
± 0 |
| |
Independents |
42,098 |
3.35 |
+1.17 |
0 |
± 0 |
| Total |
1,255,419 |
|
|
90 |
|
- 1 There were 1,528,713 enrolled voters but 180,829 were enrolled in 11 electorates (five UAP, four Country and two Labor) which were uncontested at the election.
References
Melbourne University Press Melbourne ISBN 0-522-84700-5 OCLC 34416531
See also