New South Wales state election, 1988
| | ||||||||||||||||||||||||||||||||||||||||||||
| ||||||||||||||||||||||||||||||||||||||||||||
| ||||||||||||||||||||||||||||||||||||||||||||
|
| ||||||||||||||||||||||||||||||||||||||||||||
| Legislative Assembly after the election | ||||||||||||||||||||||||||||||||||||||||||||
| ||||||||||||||||||||||||||||||||||||||||||||
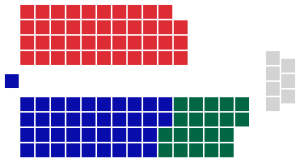
Elections to the 49th Parliament of New South Wales were held on Saturday 19 March 1988. All seats in the Legislative Assembly and a third of the seats in the Legislative Council were up for election. The Labor government of Premier Barrie Unsworth was defeated by the Liberal-National Coalition, led by Opposition Leader Nick Greiner.
The election took place following a redistribution of seats, which resulted in the Assembly growing from 99 to 109 seats.
Issues
The Australian Labor Party, under Neville Wran and, since 1986, Barrie Unsworth, had been in office for 12 years. A number of corruption scandals had tarnished Labor's image. Among these was the jailing of Labor's Minister for Corrective Services Rex Jackson in 1987 for accepting bribes for the early release of prisoners. Signs that voters had turned against Labor were evident in two by-elections in 1986. When Unsworth, then a member of the New South Wales Legislative Council, ran for the previously safe Labor Assembly seat of Rockdale in 1986, he only won it by 54 votes after losing more than 17 percent of Labor's primary vote from 1981. Additionally, Labor suffered a 22-percent primary vote swing in Wran's old seat of Bass Hill, allowing the Liberals to take it on a 103-vote margin.[1] However, by-elections in Heathcote and Bankstown in 1987 saw only small swings against the government.
The Liberals' campaign slogan was "A change for the better". Greiner campaigned on a promise to clean up state government, foreshadowing the establishment of the Independent Commission Against Corruption, as well as promising to freeze government expenditure, create 16,000 new employment and training positions, and pay more attention to law enforcement.
In rural electorates, Labor's positions on gun laws and conservation alienated many voters. Health care was also a campaign issue.
Key dates
| Date | Event |
|---|---|
| 22 February 1988 | The Legislative Assembly was dissolved, and writs were issued by the Governor to proceed with an election.[2] |
| 26 February 1988 | Nominations for candidates for the election closed at noon. |
| 19 March 1988 | Polling day, between the hours of 8am and 6pm. |
| 25 March 1988 | The Unsworth Ministry resigned and the Greiner-Murray Ministry was sworn in. |
| 22 April 1988 | The writ was returned and the results formally declared. |
| 27 April 1988 | Parliament resumed for business. |
Results
Legislative Assembly
The result was a landslide for the Coalition parties. Election analyst Antony Green later noted that "the 1988 result was startling, the worst Labor performance, and best Coalition result, since the Lang era of the 1930s." Labor lost heartland seats including Balmain, Newcastle and Swansea for the first time since the turn of the century.
Seven non-aligned Independents were elected to the Legislative Assembly.
|
New South Wales state election, 19 March 1988[3] | ||||||
|---|---|---|---|---|---|---|
| Enrolled voters | 3,541,447 | |||||
| Votes cast | 3,314,229 | Turnout | 93.58% | +1.07% | ||
| Informal votes | 63,870 | Informal | 3.07% | +0.84% | ||
| Summary of votes by party | ||||||
| Party | Primary votes | % | Swing | Seats | Change | |
| Liberal | 1,447,613 | 35.80 | +3.62 | 39 | +17 | |
| Labor | 1,233,612 | 38.48 | –10.27 | 43 | –15 | |
| National | 440,482 | 13.74 | +2.90 | 20 | + 5 | |
| Democrats | 58,163 | 1.81 | –1.03 | 0 | ± 0 | |
| Independent EFF | 39,194 | 1.22 | +1.22 | 0 | ± 0 | |
| Call to Australia | 14,205 | 0.44 | +0.37 | 0 | ± 0 | |
| Illawarra Workers Party | 6,755 | 0.21 | +0.21 | 0 | ± 0 | |
| Socialist | 2,717 | 0.08 | –0.05 | 0 | ± 0 | |
| Nuclear Disarmament | 1,064 | 0.03 | +0.03 | 0 | ± 0 | |
| Independent | 261,719 | 8.16 | +3.08 | 7 | + 3 | |
| Total | 3,205,524 | 109 | ||||
| Two-party-preferred | ||||||
| Liberal/National | 1,725,936 | 55.96 | +8.4 | |||
| Labor | 1,358,049 | 44.04 | –8.4 | |||
Legislative Council
|
New South Wales state election, 19 March 1988 | ||||||
|---|---|---|---|---|---|---|
| Enrolled voters | 3,541,447 | |||||
| Votes cast | 3,307,855 | Turnout | 91.92 | –0.60 | ||
| Informal votes | 267,113 | Informal | 8.01 | +1.42 | ||
| Summary of votes by party | ||||||
| Party | Primary votes | % | Swing | Seats won |
Seats held | |
| Liberal/National Coalition | 1,403,300 | 46.15 | +3.54 | 7 | 19 | |
| Labor | 1,140,634 | 37.51 | –9.37 | 6 | 21 | |
| Call to Australia | 174,553 | 5.74 | –0.35 | 1 | 3 | |
| Democrats | 90,634 | 2.73 | –0.42 | 1 | 2 | |
| Independent EFF | 72,965 | 2.40 | +2.40 | 0 | 0 | |
| Community Independents | 52,992 | 1.74 | +1.74 | 0 | 0 | |
| Environment Group | 48,536 | 1.60 | +1.60 | 0 | 0 | |
| Nuclear Disarmament | 28,161 | 0.93 | +0.93 | 0 | 0 | |
| Aboriginal Team | 13,363 | 0.44 | +0.44 | 0 | 0 | |
| Humanist Party | 11.895 | 0.39 | +0.39 | 0 | 0 | |
| Defence Ex-Service Team | 6,970 | 0.23 | +0.23 | 0 | 0 | |
| Marijuana | 2,713 | 0.09 | +0.09 | 0 | 0 | |
| Independent | 3,396 | 0.11 | –0.31 | 0 | 0 | |
| Total | 3,040,742 | 15 | ||||
Post-election pendulum
See also
Notes
- ↑ "By-election bloodbaths". Crikey. 27 November 2005. Retrieved 13 June 2010.
- ↑ Parliament of New South Wales. "1988 Election". Retrieved 18 February 2010.
- ↑ Antony Green (October 1998). "Changing Boundaries, Changing Fortunes: an analysis of the NSW Elections of 1988 and 1991" (PDF). Retrieved 13 August 2013.
References
| General elections |
| ||||||
|---|---|---|---|---|---|---|---|
| Referendums | |||||||
| Other | |||||||