Manitoba municipal amalgamations, 2015
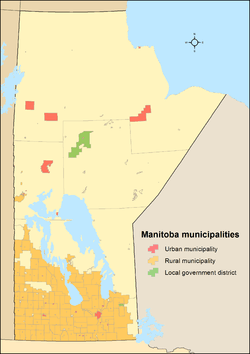
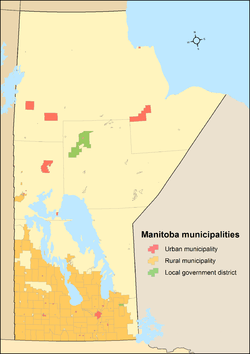
In 1997, the Government of Manitoba established a minimum population threshold of 1,000 to incorporate a municipality.[1] As of the 2011 census, 93 of Manitoba's 197 municipalities had populations less than 1,000.[2] The Government of Manitoba announced in 2012 that municipalities would be required to amalgamate in order for them to meet the minimum population threshold and make them more sustainable communities moving forward.[1] The Municipal Amalgamations Act was subsequently enacted in 2013, requiring that municipalities with a population less than 1,000 amalgamate with one or more neighbouring municipalities by 2015.[3] Two municipalities with populations less than 1,000, the Rural Municipality of Victoria Beach and the Village of Dunnattor, were subsequently exempted from the requirement to amalgamate due to their uniqueness as resort municipalities.[4] In 2013 and 2014, the Government of Manitoba passed legislation to amalgamate 107 municipalities (65 rural municipalities, 25 towns and 17 villages) into 47 effective January 1, 2015.[5] These amalgamations therefore reduced the total number of municipalities in the province from 197 to 137.
List of amalgamations
| New rural municipality[5] |
Incorporation date[5] |
Amalgamating rural municipality(ies)[5] |
Amalgamating town(s)[5] |
Amalgamating village(s)[5] |
Population (2011)[6] |
Population (2006)[2] |
Change (%)[2] |
Land area (km²)[2] |
Population density (per km2)[2] |
|---|---|---|---|---|---|---|---|---|---|
| Bifrost – Riverton | January 1, 2015 | Bifrost | Riverton | 3,514 | 3,509 | 0.1 | 1,643.69 | 2.1 | |
| Boissevain – Morton | January 1, 2015 | Morton | Boissevain | 2,270 | 2,215 | 2.5 | 1,092.65 | 2.1 | |
| Brenda – Waskada | January 1, 2015 | Brenda | Waskada | 652 | 748 | −12.8 | 766.77 | 0.9 | |
| Cartwright – Roblin | January 1, 2015 | Roblin | Cartwright | 1,240 | 1,246 | −0.5 | 718.01 | 1.7 | |
| Clanwilliam – Erickson | January 1, 2015 | Clanwilliam | Erickson | 901 | 940 | −4.1 | 352.08 | 2.6 | |
| Deloraine – Winchester | January 1, 2015 | Winchester | Deloraine | 1,485 | 1,571 | −5.5 | 727.83 | 2.0 | |
| Ellice – Archie | January 1, 2015 | Archie Ellice | St. Lazare | 971 | 1,018 | −4.6 | 1,153.33 | 0.8 | |
| Emerson – Franklin | January 1, 2015 | Franklin | Emerson | 2,439 | 2,457 | −0.7 | 975.62 | 2.5 | |
| Ethelbert | January 1, 2015 | Ethelbert | Ethelbert | 629 | 695 | −9.5 | 1,136.97 | 0.6 | |
| Gilbert Plains | January 1, 2015 | Gilbert Plains | Gilbert Plains | 1,623 | 1,594 | 1.8 | 1,051.80 | 1.5 | |
| Glenboro – South Cypress | January 1, 2015 | South Cypress | Glenboro | 1,483 | 1,467 | 1.1 | 1,097.76 | 1.4 | |
| Glenella – Lansdowne | January 1, 2015 | Glenella Lansdowne | 1,245 | 1,267 | −1.7 | 1,263.43 | 1.0 | ||
| Grandview | January 1, 2015 | Grandview | Grandview | 1,508 | 1,575 | −4.3 | 1,156.29 | 1.3 | |
| Grassland | January 1, 2015 | Cameron Whitewater | Hartney | 1,480 | 1,481 | −0.1 | 1,345.85 | 1.1 | |
| Grey | January 1, 2015 | Grey | St. Claude | 2,615 | 2,592 | 0.9 | 960.29 | 2.7 | |
| Hamiota | January 1, 2015 | Hamiota | Hamiota | 1,288 | 1,260 | 2.2 | 575.76 | 2.2 | |
| Harrison Park | January 1, 2015 | Harrison Park | 1,799 | 1,815 | −0.9 | 977.58 | 1.8 | ||
| Hillsburg – Roblin – Shell River | January 1, 2015 | Hillsburg Shell River | Roblin | 3,284 | 3,375 | −2.7 | 1,688.2 | 1.9 | |
| Lakeshore | January 1, 2015 | Ochre River Lawrence | 1,401 | 1,430 | −2.0 | 1,297.23 | 1.1 | ||
| Lorne | January 1, 2015 | Lorne | Notre Dame de Lourdes Somerset | 3,006 | 3,024 | −0.6 | 911.85 | 3.3 | |
| Louise | January 1, 2015 | Louise | Pilot Mound | Crystal City | 1,932 | 1,849 | 4.5 | 938.21 | 2.1 |
| McCreary | January 1, 2015 | McCreary | McCreary | 948 | 963 | −1.6 | 524.39 | 1.8 | |
| Minitonas – Bowsman | January 1, 2015 | Minitonas | Minitonas | Bowsman | 1,816 | 1,917 | −5.3 | 1,202.31 | 1.5 |
| Minto – Odanah | January 1, 2015 | Minto Odanah | 1,177 | 1,207 | −2.5 | 743.9 | 1.6 | ||
| Mossey River | January 1, 2015 | Mossey River | Winnipegosis | 1,186 | 1,242 | −4.5 | 1,125.56 | 1.1 | |
| Norfolk Treherne | January 1, 2015 | South Norfolk | Treherne | 1,741 | 1,816 | −4.1 | 733.99 | 2.4 | |
| North Cypress – Langford | January 1, 2015 | Langford North Cypress | 2,627 | 2,689 | −2.3 | 1,761.87 | 1.5 | ||
| North Norfolk | January 1, 2015 | North Norfolk | MacGregor | 3,762 | 3,663 | 2.7 | 1,160.89 | 3.2 | |
| Oakland – Wawanesa | January 1, 2015 | Oakland | Wawanesa | 1,618 | 1,568 | 3.2 | 577.47 | 2.8 | |
| Oakview | January 1, 2015 | Blanshard Saskatchewan | Rapid City | 1,513 | 1,595 | −5.1 | 1,148.09 | 1.3 | |
| Pembina | January 1, 2015 | Pembina | Manitou | 2,369 | 2,430 | −2.5 | 1,117.7 | 2.1 | |
| Prairie Lakes | January 1, 2015 | Strathcona Riverside | 1,423 | 1,536 | −7.4 | 1,062.9 | 1.3 | ||
| Prairie View | January 1, 2015 | Birtle Miniota | Birtle | 2,167 | 2,232 | −2.9 | 1,696.13 | 1.3 | |
| Rhineland | January 1, 2015 | Rhineland | Gretna Plum Coulee | 5,772 | 5,469 | 5.5 | 958.69 | 6.0 | |
| Riding Mountain West | January 1, 2015 | Shellmouth-Boulton Silver Creek | 1,390 | 1,404 | −1.0 | 1,622.55 | 0.9 | ||
| Riverdale | January 1, 2015 | Daly | Rivers | 2,019 | 2,061 | −2.0 | 570.42 | 3.5 | |
| Rossburn | January 1, 2015 | Rossburn | Rossburn | 1,046 | 1,060 | −1.3 | 682.78 | 1.5 | |
| Russell – Binscarth | January 1, 2015 | Russell | Russell | Binscarth | 2,553 | 2,469 | 3.4 | 572.5 | 4.5 |
| Sifton | January 1, 2015 | Sifton | Oak Lake | 1,172 | 1,159 | 1.1 | 770.84 | 1.5 | |
| Souris – Glenwood | January 1, 2015 | Glenwood | Souris | 2,439 | 2,412 | 1.1 | 581.22 | 4.2 | |
| Ste. Rose | January 1, 2015 | Ste. Rose | Ste. Rose du Lac | 1,794 | 1,786 | 0.4 | 628.56 | 2.9 | |
| Swan Valley West | January 1, 2015 | Swan River | Benito | 2,923 | 3,144 | −7.0 | 1,720.39 | 1.7 | |
| Two Borders | January 1, 2015 | Albert Arthur Edward | 1,310 | 1,400 | −6.4 | 2,304.46 | 0.6 | ||
| Wallace – Woodworth | January 1, 2015 | Wallace Woodworth | Elkhorn | 2,857 | 2,852 | 0.2 | 1,969.32 | 1.5 | |
| West Interlake | January 1, 2015 | Eriksdale Siglunes | 2,206 | 2,391 | −7.7 | 1,622.18 | 1.4 | ||
| WestLake – Gladstone | January 1, 2015 | Lakeview Westbourne | Gladstone | 3,068 | 3,050 | 0.6 | 1,832.09 | 1.7 | |
| Yellowhead | January 1, 2015 | Shoal Lake Strathclair | 1,973 | 2,075 | −4.9 | 1,110.72 | 1.8 | ||
See also
- 2000–06 municipal reorganization in Quebec
- 2002–2006 municipal reorganization of Montreal
- Amalgamation of the Halifax Regional Municipality
- Amalgamation of Toronto
- Amalgamation of Winnipeg
- Edmonton annexations
- List of municipalities in Manitoba
References
- 1 2 "Speech from the Throne: At the Opening of the Second Session of the 40th Legislature of the Province of Manitoba". Government of Manitoba. November 19, 2012. Retrieved October 5, 2014.
- 1 2 3 4 5 "Population and dwelling counts, for Canada, provinces and territories, and census subdivisions (municipalities), 2011 and 2006 censuses (Manitoba)". Statistics Canada. May 28, 2012. Retrieved December 23, 2012.
- ↑ "The Municipal Amalgamations Act (C.C.S.M. c. M235)". Government of Manitoba. October 2, 2014. Retrieved October 5, 2014.
- ↑ "Government listens to presenters, amendments proposed to Municipal Modernization Act: Lemieux". Government of Manitoba. September 11, 2013. Retrieved October 5, 2014.
- 1 2 3 4 5 6 "Consolidated Regulations of Manitoba: List of titles with "amalgamation"". Government of Manitoba. Retrieved October 2, 2014.
- ↑ "Interim List of Changes to Municipal Boundaries, Status, and Names, From January 2, 2014 to January 1, 2015 – Table 1 Changes to census subdivisions in alphabetical order by province and territory (with 8C and 9C)" (XLSX). Statistics Canada. May 27, 2015. Retrieved May 30, 2015.