Le Val-Saint-François Regional County Municipality
| Le Val-Saint-François | |
|---|---|
| Regional county municipality | |
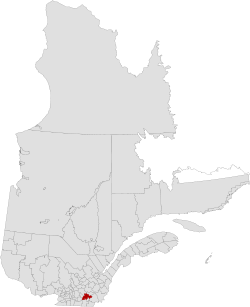 Location in province of Quebec. | |
| Coordinates: 45°34′N 72°01′W / 45.567°N 72.017°WCoordinates: 45°34′N 72°01′W / 45.567°N 72.017°W[1] | |
| Country |
|
| Province |
|
| Region | Estrie |
| Effective | May 26, 1982 |
| County seat | Richmond |
| Government[2] | |
| • Type | Prefecture |
| • Prefect | Claude Boucher |
| Area[2][3] | |
| • Total | 1,416.60 km2 (546.95 sq mi) |
| • Land | 1,403.96 km2 (542.07 sq mi) |
| Population (2011)[3] | |
| • Total | 29,654 |
| • Density | 21.1/km2 (55/sq mi) |
| • Pop 2006-2011 |
|
| • Dwellings | 13,640 |
| Time zone | EST (UTC−5) |
| • Summer (DST) | EDT (UTC−4) |
| Area code(s) | 819 |
| Website |
www |
Le Val-Saint-François (French pronunciation: [lə val sɛ̃ fʁɑ̃swa]) is a regional county municipality in the Estrie region of Quebec, Canada. The seat is Richmond.
Subdivisions
There are 18 subdivisions within the RCM:[2]
|
|
|
|
Demographics
Population
| Canada census – Le Val-Saint-François Regional County Municipality community profile | |||
|---|---|---|---|
| 2011 | 2006 | 2001 | |
| Population: | 29,654 (+2.2% from 2006) | 29,023 (+2.3% from 2001) | 28,176 (+0.1% from 1996) |
| Land area: | 1,403.96 km2 (542.07 sq mi) | 1,403.10 km2 (541.74 sq mi) | 1,388.14 km2 (535.96 sq mi) |
| Population density: | 21.1/km2 (55/sq mi) | 20.7/km2 (54/sq mi) | 20.3/km2 (53/sq mi) |
| Median age: | 44.1 (M: 43.3, F: 45.0) | 41.9 (M: 41.1, F: 42.6) | 39.3 (M: 38.8, F: 39.7) |
| Total private dwellings: | 13,640 | 13,012 | 12,398 |
| Median household income: | $51,834 | $47,724 | $40,871 |
| References: 2011[3] 2006[4] 2001[5] | |||
| Historical Census Data - Le Val-Saint-François Regional County Municipality, Quebec[6] | ||||||||||||||||||||||||||||||||
|---|---|---|---|---|---|---|---|---|---|---|---|---|---|---|---|---|---|---|---|---|---|---|---|---|---|---|---|---|---|---|---|---|
|
|
| ||||||||||||||||||||||||||||||
(A) adjusted figure due to boundary changes. | ||||||||||||||||||||||||||||||||
Language
| Canada Census Mother Tongue - Le Val-Saint-François Regional County Municipality, Quebec[6] | ||||||||||||||||||
|---|---|---|---|---|---|---|---|---|---|---|---|---|---|---|---|---|---|---|
| Census | Total | French |
English |
French & English |
Other | |||||||||||||
| Year | Responses | Count | Trend | Pop % | Count | Trend | Pop % | Count | Trend | Pop % | Count | Trend | Pop % | |||||
| 2011 |
29,405 |
26,800 | |
91.14% | 2,155 | |
7.33% | 260 | |
0.88% | 190 | |
0.65% | |||||
| 2006 |
28,760 |
25,845 | |
89.86% | 2,400 | |
8.34% | 255 | |
0.89% | 260 | |
0.90% | |||||
| 2001 |
27,695 |
25,055 | |
90.47% | 2,310 | |
8.34% | 175 | |
0.63% | 155 | |
0.56% | |||||
| 1996 |
32,875 |
29,900 | n/a | 90.95% | 2,590 | n/a | 7.88% | 260 | n/a | 0.79% | 125 | n/a | 0.38% | |||||
Transportation
Access Routes
Highways and numbered routes that run through the municipality, including external routes that start or finish at the county border:[7]
|
|
See also
References
- ↑ Reference number 141065 of the Commission de toponymie du Québec (French)
- 1 2 3 Ministère des Affaires municipales, des Régions et de l'Occupation du territoire: Le Val-Saint-François Regional County Municipality.
- 1 2 3 2011 Statistics Canada Census Profile: Le Val-Saint-François Regional County Municipality, Quebec.
- ↑ "2006 Community Profiles". Canada 2006 Census. Statistics Canada. March 30, 2011. Retrieved 2014-03-01.
- ↑ "2001 Community Profiles". Canada 2001 Census. Statistics Canada. February 17, 2012. Retrieved 2014-03-01.
- 1 2 Statistics Canada: 1996, 2001, 2006, 2011 census
- ↑ Official Transport Quebec Road Map.
 |
Drummond RCM | Les Sources RCM | | |
| Acton RCM | |
Le Haut-Saint-François RCM | ||
| ||||
| | ||||
| La Haute-Yamaska RCM | Memphrémagog RCM | Sherbrooke TE |
| Regional county municipalities and equivalent territories | |
|---|---|
| Municipalities | |
This article is issued from Wikipedia - version of the 12/3/2015. The text is available under the Creative Commons Attribution/Share Alike but additional terms may apply for the media files.