Immigration to Brazil


Immigration to Brazil is the movement to Brazil of foreign persons to reside permanently. It should not be confused with the colonisation of the country by the Portuguese, or with the forcible bringing of people from Africa as slaves.
Throughout its history, Brazil has always been a recipient of immigrants, but this began to gain importance in the late 19th century and throughout the 20th century when the country received massive immigration from Europe, the Middle East and East Asia, which left lasting marks on demography, culture, language and the economy of Brazil.
In general, it is considered that people who entered Brazil up to 1822, the year of independence, were colonizers. Since then, those who entered the independent nation were immigrants.
Before 1871, the number of immigrants rarely exceeded two or three thousand people a year. Immigration increased pressure from the first end of the international slave trade to Brazil, after the expansion of the economy, especially in the period of large coffee plantations in the state of São Paulo.
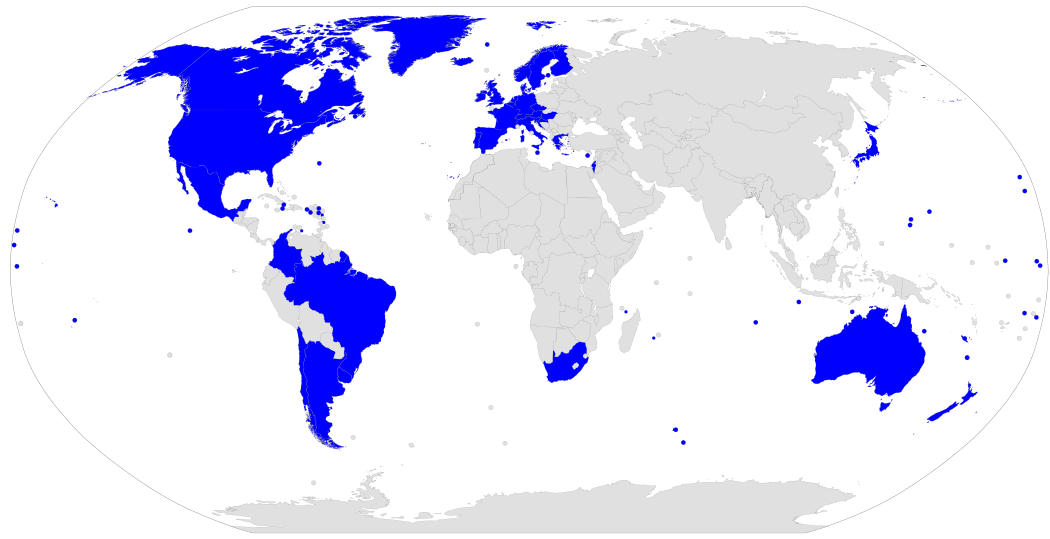
Immigration has been a very important demographic factor in the composition, structure and history of human population in Brazil, with all its attending factors and consequences in culture, economy, education, racial issues, etc. Brazil has received one of the largest numbers of immigrants in the Western Hemisphere, along with the United States, Argentina and Canada.[1]
Counting from 1872 (year of the first census) by the year 2000, Brazil received about 6 million immigrants.
Brief history


Maria Stella Ferreira Levy[2] suggests the following periodisation of the process of immigration to Brazil:
- 1. 1820-1876: small number of immigrants (about 6,000 per year), predominance of Portuguese (45.73%), with significant numbers of Germans (12.97%);
- 2. 1877-1903: large number of immigrants (about 71,000 per year), predominance of Italians (58.49%);
- 3. 1904-1930: large number of immigrants (about 79,000 per year), predominance of the Portuguese (36.97%);
- 4. 1931-1963: declining number of immigrants (about 33,500 per year), predominance of the Portuguese (38.45%).
The Brazilian population before immigration
.jpg)
When Brazil was discovered as a new land in the New World by the Portuguese in 1500, its native population was composed of about 2.4 million Amerindians[3] whose ancestors had been living there for the last 15,000 to 20,000 years.[4] During the three decades afterwards, the country remained sparsely inhabited by Europeans. Among those few, mainly Portuguese, most were renegades, criminals banished from Portugal, shipwreck survivors, or mutinous sailors. They integrated into the local tribes, using their superior technology to attain privileged positions among them.[5]
After 1530, the Portuguese started to settle in Brazil in significant numbers. However, Portugal had a small population to develop the exploitation of Brazil. By 1550, the colonists started to bring African slaves. From 1500, when the Portuguese reached Brazil, until its independence in 1822, from 500,000 to 700,000 Portuguese settled in Brazil, 600,000 of whom arrived in the 18th century alone.[6][7] The Portuguese settled in the whole territory, initially remaining near the coast, except in the region of São Paulo, from where the bandeirantes would spread into the hinterland. In the 18th century, large waves of Portuguese settled the country, in the wake of the discovery of gold in the region of Minas Gerais, but the number of Portuguese who settled in Brazil in its colonial era was far lower than of African slaves: from 1550 to 1850, some 4 million slaves were brought to Brazil.[7] This should not be taken as meaning that the population of Brazil before independence was mainly Black: the average survival of an African slave in Brazil was of merely seven years after arrival,[8] implying extremely high mortality rates. Although children born to slave women inherited the slave condition, the Portuguese always relied on slaves purchased from slave traders to replace and increase the work force; the natural growth of the slave population was always very small.[9]
In the early 19th century, Brazil was mainly composed of people of three different origins: the indigenous inhabitants, the Portuguese and their descendants, the Africans and descendants, and, naturally, people of varying degrees of "racial" mixture. In 1872, after the arrival of about 350,000 mostly European immigrants and about 1,150,000 Africans forcibly brought to Brazil as slaves, the first Brazilian Census counted 9,930,478 people in Brazil, of which 3,787,289 (38.14%) Whites, 3,380,172 (34.04%) "pardos", 1.954.452 (19.68%) Blacks, and 386,955 (3.90%) "caboclos".[10]
First period: 1820-1876
Immigration properly started with the opening of the Brazilian ports, in 1808. The government began to stimulate the arrival of Europeans to occupy plots of land and become small farmers. In 1812, settlers from the Azores were brought to Espírito Santo and in 1819, Swiss to Nova Friburgo, Rio de Janeiro. After independence from Portugal, the Brazilian Empire focused on the occupation of the provinces of Southern Brazil. It was mainly because Southern Brazil had a small population, vulnerable to attacks by Argentina and the Kaingang Indians.[11]
From 1824, immigrants from Central Europe started to populate what is nowadays the region of São Leopoldo, in the province of Rio Grande do Sul. According to Leo Waibel, these German immigrants were mainly "oppressed peasants and former soldiers of the army of Napoleon." In 1830 a bill was passed forbidding the Imperial government from spending money with the settlement of immigrants, which stalled immigration until 1834, when the provincial governments were charged with promoting immigration.[12]
In 1859, Prussia prohibited emigration to Brazil. This was mainly because of complaints that Germans were being exploited in the coffee plantations of São Paulo. Still, between 1820 and 1876, 350,117 immigrants entered Brazil. Of these, 45.73% were Portuguese, 35.74% of "other nationalities," 12.97% Germans, while Italians and Spanish together did not reach 6%. The total number of immigrants per year averaged 6,000.[13] Many immigrants, particularly the Germans, were brought to settle in rural communities as small landowners. They received land, seed, livestock and other items to develop.


Second Period: 1877-1903
In the last quarter of the 19th century, the entry of immigrants in Brazil grew strongly. On one hand, Europe underwent a serious demographic crisis, which resulted in increased emigration; on the other hand, the final crisis of Brazilian slavery prompted Brazilian authorities to find solutions for the problem of work force. Consequently, while immigration until 1876 was focused on establishing communities of landowners, during this period, while this older process continued, immigrants were more and more attracted to the coffee plantations of São Paulo, where they became employees or were allowed to cultivate small tracts of land in exchange for their work in the coffee crop.[11] This also coincided with the decreasing availability of better land in southern Brazil—while the German immigrants arriving in the previous period occupied the valleys of the rivers, the Italians arriving in the last quarter of the century settled the mountainous regions of the state.[14]
During this period, immigration was much more intense: large numbers of Europeans, especially Italians, started to be brought to the country to work in the harvest of coffee.[15] From 1877 to 1903, almost two million immigrants arrived, at a rate of 71,000 per year[16] Brazil's receiving structure, legislation and settlement policies for immigrants were much less organized than in Canada and the United States at the time. Nevertheless, an Immigrant's Hostel (Hospedaria dos Imigrantes) was built in 1886 in São Paulo, and quick admittance and recording routines for the throngs of immigrants arriving by ship at the seaports of Vitória, Rio de Janeiro, Santos, Paranaguá, Florianópolis and Porto Alegre were established. The São Paulo site alone processed more than 2.5 million immigrants in its almost 100 years of continuous operation. People of more than 70 different nationalities were recorded.

In 1850, Brazil declared the end of the slave trade. This had different impacts on the different regions of Brazil. At the time, the region of São Paulo was undergoing a process of economic boom, linked to the expansion of the cultivation of coffee, and consequently needed increased amounts of labour. Other regions, notedly the Northeast, on the contrary, faced economic retraction, and were, consequently, able to dispense workforce. This entailed the replacement of the international slave trade by an internal or interprovincial slave trade, in which Northeastern slaves were sold in large numbers to the Southeast.[17] This temporarily solved the workforce problem in São Paulo and other coffee plantation areas. However, by 1870 the paulista elite came to realise that the Northeastern slaveholders were in fact being able to obtain financial compensation for their slaves, or, in practice, an abolition with compensation.[17] Fears of a situation comparable to the United States, with the division of the country into free provinces and slave provinces arose. Consequently, paulista politicians began to seek measures against the interprovincial traffic, at a time when, anyway, the price of Northeastern slaves was getting higher and higher, due to their increasing scarcity.[17] By the beginning of the 1870s, the alternative of the interprovincial trade was exhausted, while the demand for workforce in the coffee plantations continued to expand. Thus the paulista oligarchy sought to attract new workers from abroad, by passing provincial legislation and pressing the Imperial government to organise immigration.[17][18]
Third period: 1904-1930

From 1904 to 1930, 2,142,781 immigrants came to Brazil—making an annual average of 79,000 people. In consequence of the Prinetti Decree of 1902, that forbade subsidised emigration to Brazil, Italian immigration had, at this stage, a drastic reduction: their average annual entries from 1887 to 1903 was 58,000. In this period they were only 19,000 annually. The Portuguese constituted 38% of entries, followed by Spaniards with 22%. From 1914 to 1918, due to World War I, the entry of immigrants of all nationalities decreased.[13] After the War, the immigration of people of "other nationalities" redressed faster than that of Portuguese, Spaniards, and Italians. Part of this category was composed of immigrants from Poland, Russia and Romania, who immigrated probably by political issues, and part by Syrian and Lebanese peoples. Both subgroups included a number of Jewish immigrants, who arrived in the 1920s.
From 1931 to 1963, 1,106,404 immigrants entered Brazil. The participation of the Japanese increased. From 1932 to 1935 immigrants from Japan constituted 30% of total admissions.[13] Prior to this yearly Japanese immigrants were numerically limited to no more than 5% of the current Japanese population.[19]
Fourth Period: 1931-1964
With the radicalisation of the political situation in Europe, the end of the demographic crisis, the decadence of coffee culture, the Revolution of 1930 and the consequent rise of a nationalist government, immigration to Brazil was significantly reduced. The focus shifted to culturally assimilating immigrants and "whitening" the population.[20] From 1931 to 1963, 1,106,404 immigrants entered Brazil. The annual arrival of immigrants fell to 33,500. The Portuguese remained the most significant group, with 39.35%, The participation of the Japanese increased, becoming the second most important group, with 12.79%. Particularly from 1932 to 1935 immigrants from Japan constituted 30% of total admissions.[13]
Immigration also became a more urban phenomenon; most immigrants came for the cities, and even the descendants of the immigrants of the previous periods were moving intensely from the countryside. In the 1950s, Brazil started a program of immigration to provide workers for Brazilian industries. In São Paulo, for example, between 1957 and 1961, more than 30% of the Spanish, over 50% of the Italian and 70% of the Greek immigrants were brought to work in factories.
Current trends


During the 1970s Brazil received about 32,000 Lebanese immigrants escaping the civil war, as well as smaller numbers of Palestinians and Syrians.[21]
During the 1990s Brazil received small numbers of immigrants from the former republics of Yugoslavia, from Afghanistan and West Africa (mostly Angolans).[22] Recent immigration is mainly constituted by Chinese and Koreans and, in a smaller degree, by Argentines and other Latin American immigrants.[23]
The increase in Bolivian immigrants in Brazil is one of the social consequences of the political crisis affecting that country.[24] The majority of the Bolivians come from cities such as La Paz, Sucre, Santa Cruz de la Sierra, and Cochabamba. Usually they enter Brazil through Cuiabá, in Mato Grosso, or San Mathias, in Bolivia, which borders Caceres, Mato Grosso and Corumbá, in Mato Grosso do Sul.
Between 1,200 and 1,500 Bolivian immigrants come to Brazil every month looking for a job. Most of them work in the illegal textile industry in the Greater São Paulo.[25] There are an estimated 200,000 Bolivians living in the Greater São Paulo, majority is of undocumented immigrants.[26]
In 2009, the country was home to 3,982,000 foreign born people, that represents 2.36% of the Brazilian population. The major work visas concessions were granted for citizens of the United States and the United Kingdom.[27]
In 2010, Brazil is home to 4,251 refugees from 76 different nationalities. The largest refugee ancestries were Angolan (1,688), Colombian (583), Congolese (402), Liberian (259), and Iraqi (197).[28]
| Immigrants (2012) | |||||
|---|---|---|---|---|---|
| Country | Population | ||||
| Portugal | 277,727 | ||||
| Japan | 91,042 | ||||
| Italy | 73,126 | ||||
| Spain | 59,985 | ||||
| Argentina | 42,202 | ||||
| Germany | 29,224 | ||||
Visa policy
Permanent visas may be granted to individuals intending to establish residence in Brazil. Permanent Visas apply to:[29]
- Technicians or professionals with a work contract pre-approved by the Brazilian Ministry of Labor, National Department of Employment. This visa must be applied for in Brazil.
- Professors, technicians and high-level researchers who wish to immigrate to Brazil to undertake research work in an institution of higher learning or of research in science and technology. This visa must be applied for in Brazil.
- Foreign investors with initial transfer of foreign capital equivalent to no less than US$50,000 and an investment plan pre-approved by the Brazilian National Council on Immigration (CNIG). This visa must be applied for in Brazil.
- Administrators, managers or directors hired by a commercial enterprise or civil organization resulting from foreign investment described in item 3 above, with a work contract pre-approved by the Brazilian Ministry of Labor, National Department of Employment. This visa must be applied for in Brazil.
- A retired person, 60 years of age or older, accompanied by up to two dependents, and able to transfer monthly, in accordance with the laws of the country of origin, the amount equivalent to US$2,000. In the case of more than two dependents, the applicant must transfer the amount equivalent to US$1,000 for each additional dependent.
- Spouse, partners in a common law union regardless of gender, or minor dependent of Brazilian citizen or of a permanent resident of Brazil;
- Ancestors of a Brazilian national or of a permanent resident of Brazil;
- Siblings of a Brazilian citizen or of a permanent resident of Brazil, if orphan, single and under 18 years of age;
- Minor children, grandchildren or great-grandchildren of a Brazilian citizen or of a permanent resident of Brazil.
Binational unions
- Formed by a Brazilian and other people from other country:
| Ethnic origin | Percentage |
|---|---|
| Portuguese | 32% |
| Italians | 9% |
| Japanese | 8% |
| Ethnic origin | Percentage |
|---|---|
| U.S. citizens | 40% |
| Portuguese | 17% |
| Argentinians | 14% |
Immigration law
Federal Constitution

Article 12. The following are Brazilians:
II - naturalized:
a) those who, as set forth by law, acquire Brazilian nationality, it being the only requirement for persons originating from Portuguese-speaking countries the residence for 1 (one) uninterrupted year and good moral repute;
b) foreigners of any nationality, resident in the Federative Republic of Brazil for over 15 (fifteen) uninterrupted years and without criminal conviction, provided that they apply for the Brazilian nationality.
Paragraph 1. The rights inherent to Brazilians shall be attributed to Portuguese citizens with permanent residence in Brazil, if there is reciprocity in favour of Brazilians, except in the cases stated in this Constitution.
Paragraph 2. The law may not establish any distinction between born and naturalized Brazilians, except in the cases stated in this Constitution.[30]
Statute of Foreigner
Article 112. Are conditions for the granting of naturalization:
I - civilian capacity, according to Brazilian law;
II - to be registered as permanent resident in Brazil;
III - continuous residence in the territory for a minimum period of 4 (four) years immediately preceding the application for naturalization;
IV - read and write the Portuguese language, considering the conditions of naturalizing;
V - exercise of occupation or possession of sufficient assets to maintain itself and the family;
VI - proper procedure;
VII - no complaint, indictment in Brazil or abroad for a felony that is threatened in minimum sentence of imprisonment, abstractly considered, more than 1 (one) year.
VIII - good health.
Article 113.The period of residence prescribed in Article 112, item III, may be reduced if the naturalizing fill any of the following conditions:
I - have a child or spouse of Brazil;
(Including same-sex spouse, see also: Same-sex immigration policy in Brazil)
II - be son of a Brazilian;
III - have provided or can provide relevant services to Brazil, in the opinion of the Minister of Justice of Brazil;
IV - commend themselves by their professional, scientific or artistic; or
V - to be owner in Brazil, real estate, whose value is equal to at least a thousand times the greatest value of reference, or be provided with industrial funds of equal value, or hold quota shares or amount of paid-in least identical in commercial or civil society, aimed principally and permanently, the operation of industrial or agricultural activities.
Sole Paragraph. The residence will be at least 1 (one) year, in cases of items I, II, and III; 2 (two) years in Item IV; and 3 (three) years in Item V.[31]
Amnesty

Since the 1980s, the Brazilian government has offered amnesty to foreigners in irregular situation[32] in four different campaigns, benefiting tens of thousands of foreigners living in Brazil. The latest campaign began in July 2009 by presidential decree, and though it officially ended at the close of 2009, some cases are still pending. Until now, 41,816 foreigners received amnesty through the 2009 amnesty program, though there are another 2,000 cases expected to be finished in early 2010. Though the large majority of immigrants live in São Paulo, other cases were based largely in Rio de Janeiro and Paraná. The breakdown by country/continent is the following: 16,881 Bolivians, 5,492 Chinese, 4,642 Peruvians, 4,135 Paraguayans, 2,700 Africans (including North Africa), 2,390 Europeans, 1,129 Koreans, 469 Argentines, 274 U.S. citizens, 186 Cubans.
While foreigners who received amnesty obtained the right to work and access health and education services, they are unable to vote or run for public office. They may opt to apply for citizenship after a probation period of residency in order to obtain these rights. Officially, amnesty intends to cut down on illegal activity and human rights violations, particularly with Bolivians in São Paulo. But it seems to fit in with the Lula administration's international policies, including ramped up diplomacy and establishing ties with other nations, but also establishing itself as a competitor with developed countries. By showing that it is a center for immigrants in the Western Hemisphere, particularly in South America, and more importantly, that it is supposedly a benevolent and welcoming country for immigrants, it helps Brazil's international public image.[33]
Those who would benefit from the amnesty, following publication of the law in the Brazilian Official Gazette in July 2009, have up to 180 days after the time of their temporary residence permit (valid for 2 years) to apply. They must also aver their clean criminal record or submit a recent, official document of good conduct from the originating country. During these two years, they must not exceed 90 consecutive days spent abroad. Ninety days prior to the expiration of the temporary residence permit, they must aver their self-sufficiency in Brazil. If they can prove they are eligible for a permanent residence permit. Only ten years after receiving a permanent residence permit may be eligible for naturalization to be Brazilian.[34]
The result of immigration to Brazil
Immigration
| Immigration to Brazil, by national origin, periods from 1830 to 1959 Source: Brazilian Institute for Geography and Statistics (IBGE) | ||||||||||
|
| ||||||||||
| origin | 1830–1855 | 1856–1883 | 1884–1893 | 1894–1903 | 1904–1913 | 1914–1923 | 1924–1933 | 1945-1949 | 1950-1954 | 1955-1959 |
| Portuguese | 16,737 | 116,000 | 170,621 | 155,542 | 384,672 | 201,252 | 233,650 | 26,268 | 123,082 | 96,811 |
| Italians | — | 100,000 | 510,533 | 537,784 | 196,521 | 86,320 | 70,177 | 15,312 | 59,785 | 31,263 |
| Spaniards | — | — | 113,116 | 102,142 | 224,672 | 94,779 | 52,400 | 4,092 | 53,357 | 38,819 |
| Germans | 2,008 | 30,000 | 22,778 | 6,698 | 33,859 | 29,339 | 61,723 | 5,188 | 12,204 | 4,633 |
| Japanese | — | — | — | — | 11,868 | 20,398 | 110,191 | 12 | 5,447 | 28,819 |
| Syrians and Lebanese | — | — | 96 | 7,124 | 45,803 | 20,400 | 20,400 | N/D | N/D | N/D |
| Others | — | — | 66,524 | 42,820 | 109,222 | 51,493 | 164,586 | 29,552 | 84,851 | 47,599 |
Immigration has been a very important demographic factor in the formation,structure and history of the population in Brazil,influencing culture,economy,education,racial issues,etc. Brazil has received the third largest number of immigrants in the Western Hemisphere,after the United States and Argentina.
European diaspora


In the 100 years from 1872–1972 at least 5.35 million immigrants came to Brazil, of whom 31% were Portuguese, 30% Italian, 13% Spanish, 5% Japanese, 4% German and 16% of other unspecified nationalities.[6]
In 1897, São Paulo had twice as many Italians as Brazilians in the city. In 1893, 55% of the city´s population was composed by immigrants and in 1901 more than 80% of the children were born to a foreign-born parents. According to the 1920 census, 35% of São Paulo city's inhabitants were foreign born, compared to 36% in New York City. São Paulo's multicultural population could be compared to any major US city. About 75% of the immigrants were Latin Europeans, particularly from three major sources: Italy, Portugal and Spain. The rest came from different parts of Europe, the Middle East and Japan.[35] Some areas of the city remained almost exclusively settled by Italians until the arrival of waves of migrants from other parts of Brazil, particularly from the Northeast, starting in the late 1920s.
According to historian Samuel H. Lowrie, in the early 20th century the society of São Paulo was divided in three classes:[35]
- The high group: composed of graduated people, mainly by Brazilians born to Brazilian parents, who were related to the high-class farmers or other people with privileges.
- The working class: composed of immigrants and their second and third generations descendants. They were the most numerous group, mainly factory workers or traders.
- The semi-dependent group: composed of former slaves and low-class workers of the Empire.
According to Lowrie, the fact that Brazil already had a long history of racial mixture and that most of the immigrants in São Paulo came from Latin European countries, reduced the cases of racism and mutual intolerance. However, the Brazilian high class was more intolerant, with most of them marrying other members of the elite. In some cases, to marry an immigrant was accepted if the person had achieved fortune or had some prestige. Lowrie reports that as much as 40% of the São Paulo high-class society mixed with an immigrant within the next three generations.
While in São Paulo the Italians predominated, in the city of Rio de Janeiro the Portuguese remained as the main group. In 1929, as many as 272,338 Portuguese immigrants were recorded in the Federal District of Brazil (nowadays the city of Rio de Janeiro), more Portuguese born people than any other city in the world, except for Lisbon (which had 591,939 inhabitants in 1930).[36]
| Immigrants | Percentage of immigrants in foreign born population |
|---|---|
| Italians | 48% |
| Portuguese | 29% |
| Germans | 10% |
| Spanish | 3% |
| Year | Immigrants | Percentage of the City |
|---|---|---|
| Italians | 45,457 | 35% |
| Portuguese | 14,437 | 11% |
| Spanish | 4,818 | 3.7% |
| Year | Immigrants | Percentage of the City[2] |
|---|---|---|
| 1872 | 84,283 | 30.65% |
| 1890 | 124,352 / 155,202 | 23.79% / 29.69% |
| 1900 | 195,894 | 24.14% |
| 1906 | 210,515 | 25.94% |
| 1920 | 239,129 | 20.65% |
| 1940 | 228,633 | 12.96% |
| 1950 | 210,454 | 8.85% |
| Immigrants | Population [2] |
|---|---|
| Portuguese | 154,662 |
| Italians | 17,457 |
| Spanish | 12,212 |
| Germans | 10,185 |
| Japanese | 538 |
| Others | 33,579 |
| State | Immigrants | Percentage within the state population |
|---|---|---|
| São Paulo | 839,135 | 18.2% |
| Federal District (Rio de Janeiro city) | 252,958 | 22.0% |
| Espírito Santo | 20,532 | 4.5% |
| Santa Catarina | 39,212 | 5.8% |
| Rio Grande do Sul | 165,974 | 7.5% |
| Mato Grosso | 25,556 | 10.3% |
| Goiás | 1,814 | 0.3% |
| Minas Gerais | 91,349 | 1.5% |
| Rio de Janeiro | 53,261 | 3.4% |
| Paraná | 66,387 | 9.6% |
| Pernambuco | 12,010 | 0.5% |
| Piauí | 344 | 0.0% |
| Paraíba | 661 | 0.0% |
| Pará | 22,824 | 2.3% |
| Maranhão | 1,681 | 0.2% |
| Ceará | 980 | 0.0% |
| Bahia | 10,999 | 0.3% |
| Amazonas | 17,525 | 4.8% |
| Alagoas | 747 | 0.0% |
| Sergipe | 422 | 0.0% |
| Acre | 3,564 | 3.8% |
In the South of Brazil, there were three main groups of immigrants: Germans, Italians and Slavs (mainly Poles and Ukrainians). The Germans had been settling Rio Grande do Sul since 1824. The first settlers came from Holstein, Hamburg, Mecklenburg-Vorpommern and Hannover. Later, people from Hunsrück and Rhineland-Palatinate predominated. There were also people from Pomerania, Westphalia and Württemberg. These immigrants were attracted to work as small farmers in the region of São Leopoldo. As a result of the great internal migration of people in Rio Grande do Sul, Germans and second generation descendants started to move to other areas of the Province.
A similar process has occurred in Santa Catarina, with initially two main destinations for German immigrants (Blumenau, created in 1850, and Joinville in 1851) and then the immigrants or their descendants moved to other areas. Arriving in larger numbers than Germans, in the 1870s, groups of Italians started settling northeast Rio Grande do Sul. Similar to Germans, they were also attracted to develop small familiar farming production. In Paraná, on the other hand, the main group of immigrants was composed of Eastern Europeans, particularly Poles.[38][39]
In southern Brazil, the immigrants settled in colônias (colonies), which were rural areas, composed of many small farms, settled by the families. Some of these colonies had a great development and gave birth to major Brazilian cities, such as the former German community of Joinville (500,000 inhabitants—the largest city of the state of Santa Catarina) or the former Italian community of Caxias do Sul (405,858 inhabitants). Other colonies did not have a great development and remained small and agrarian. In these places, it is possible to feel more intensely the impact of the immigration, as many of these towns are still predominantly settled by a single ethnic group.
| Some southern Brazilian towns with a notable main ancestry | |||
|---|---|---|---|
| Town name | State | Main ancestry | Percentage |
| Nova Veneza | Santa Catarina | Italian | 95% [40] |
| Pomerode | Santa Catarina | German | 90% [41] |
| Prudentópolis | Paraná | Ukrainian | 70% [42] |
| Treze Tílias | Santa Catarina | Austrian | 60% [43] |
| Dom Feliciano | Rio Grande do Sul | Polish | 90% [44] |
Statistics
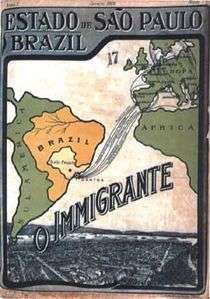 Cover of the magazine "O Immigrante", published by Italian immigrants in Brazil.
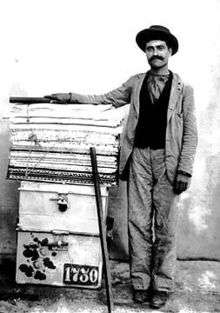
Consequences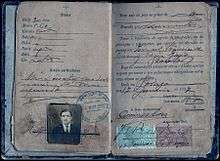 Passport of a Portuguese immigrant, 1927. 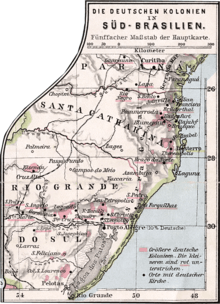 German colonies in Southern Brazil.  A couple of Portuguese immigrants in São José do Rio Preto, Brazil (1887).  Ukrainian church in Curitiba.  German Brazilians in 1874  Italian disembarkment in Santos, 1907.  Ryu Mizuno (at center), who organized the first travel of Japanese immigrants to Brazil.  Ukrainians in Brazil.  German kids in Blumenau, 1866.  Brazilian demographers have long discussed the demographical impact of the wave of emigration in the late 19th and early 20th centuries. According to Judicael Clevelário,[48] most studies about the impact of immigration have followed Giorgio Mortara's conclusions in the 1940s and 1950s. Mortara concluded that only about 15% of the demographic growth of Brazil, from 1840 and 1940 was due to immigration, and that the population of immigrant origin was of 16% of the total population of Brazil.[49] However, according to Clevelário, Mortara failed to properly take into account the full endogenous growth of the population of immigrant origin,[50] due to the predominantly rural settlement of the immigrants (rural regions tend to have higher natal rates than cities). Clevelário, then, besides extending the calculations up to 1980, remade them, reaching somewhat different conclusions. One of the problems of calculating the impact of immigration in Brazilian demography is that the return rates of immigrants are unknown. Clevelário, thence, supposed four different hypothesis concerning the return rates. The first, that he deems unrealistic high, is that 50% of the immigrants to Brazil returned to their countries of origin. The second is based on the work of Arthur Neiva, who supposes the return rate for Brazil was higher than that of the United States (30%) but lower than that of Argentina (47%). The third hypothesis is taken from Mortara, who postulates a rate of 20% for the 19th century, 35% for the first two decades of the 20th century, and 25% for 1920 on. Although Mortara himself considered this hypothesis underestimated, Clevelário thinks it is closest to reality. The last hypothesis, also admittedly unrealistic is that of a 0% rate of return, which is known to be false.[51] Clevelário's conclusions are as following: considering hypothesis 1 (unrealistically low), the Population of Immigrant Origin in 1980 would be of 14,730,710 people, or 12.38% of the total population. Considering hypothesis 2 (based on Neiva), it would be of 17,609,052 people, or 14.60% of the total population. Considering hypothesis 3 (based on Mortara, and considered most realistic), it would be of 22,088,829 people, or 18.56% of the total population. Considering hypothesis 4 (no return at all), the Population of Immigrant origin would be of 29,348,423 people, or 24.66% of the total population.[52] Clevelário believes the most probable number to be close to 18%, higher than Mortara's previous estimate of 1947.[53] According to the Census of 1872, there were 9,930,478 people in Brazil, of which 3,787,289 (38.14%) Whites, 3,380,172 (34.04%) Pardos, 1.954.452 (19.68%) Blacks, and 386,955 (3.90%) Caboclos. The White population grew faster than the non-White population due to the subsidized immigration of Europeans in the late 19th and early 20th centuries. By 1890, the non-White population was reduced to 47% and the Amerindian to 9%.[54] During this period, most immigrants came from Italy (58.49%) followed by Portugal with 20%.[13] The disproportionally fast growth of the White population, due to mass immigration, lasted up to 1940, when its proportion in the Brazilian population peaked at 63.5%.[54] During the 1900-1940 period, Italian immigration was greatly reduced, due to the Prinetti decree, forbidding subsidized emigration to Brazil in 1902, then to the Italian war effort of 1915-1918. Thence, for the period of 1904-1940, Portuguese immigration became the main drive of immigration to Brazil, with 36.52% of the arrivals, compared to 14.99% of Italians.[13] The Brazilian Censuses do not ask questions about "ethnic origin," so there are no systematically comparable data about the impact of immigration. Varied entities, mainly embassies of foreign countries in Brazil and commercial associations that promote bilateral commerce between Brazil and other countries, make claims about the figures of "descendants of immigrants" in Brazil, but none links to any actual survey. Also, if they are extrapolations of actual data on the number of immigrants, the calculations are not explained anywhere. On the other hand, in 1998, the IBGE, within its preparation for the 2000 Census, experimentally introduced a question about "origem" (origin/ancestry) in its "Pesquisa Mensal de Emprego" (Monthly Employment Research), in order to test the viability of introducing that variable in the Census[55] (the IBGE ended by deciding against the inclusion of questions about it in the Census). This research interviewed about 90,000 people in six metropolitan regions (São Paulo, Rio de Janeiro, Porto Alegre, Belo Horizonte, Salvador, and Recife) .[56] To this day, it remains the only actual published survey about the immigrant origin of Brazilians. Here are its results:[57]
Notice that the total is higher than 100% because of multiple answers. It is easy to see that the results of this research are widely incompatible with the claims made by embassies and commercial associations:
The embassy figures are also hardly compatible with the known data for immigration. Here is how they compare:
The embassy figures for "Arab Brazilians" imply an impossible rate of childbirth. The process of inflation of the "Arab Brazilian" population is described by John Tofik Karam:[60] Maintaining a privileged presence in business and political circles, Middle Easterners have overestimated themselves as a way to strengthen their place in the Brazilian nation. Among the groups listed in the table, German immigrants arrived quite early in Brazil, starting in the 1820s. By 1883, 23.86% of them had already arrived. Italian immigrants only started to arrive in the 1870s, coming in enormous numbers until 1902, when Italian immigration declined sharply. By 1903, 70.33% of them had already arrived. Spaniards started arriving about the same time as the Italians, but came in more steady pace, which means that, in average, they represent a more recent immigration. Arabs only started to arrive in considerable numbers about 1890, making them the second most recent immigration, after the Japanese, who started to arrive in 1908. Evidently, the older the immigration, higher should be the descendant/immigrant relation—but, as the table shows, the embassy figures would place the Arab descendant/immigrant relation first—and, in fact, more than three times higher than that of the Germans. When the number of immigrants is compared to the findings of the July 1998 PME, the results are different:
Here the correct order is reestablished, except for the Arabs appearing with a lower descendant/immigrant rate than the Japanese. This, however, is probably due to the concentration of Nikkeis in São Paulo, as opposed to a less concentrated distribution of "Arab Brazilians", who are present in considerable numbers in regions not counted by the PMEs—notably the Northern Region, the West of Paraná State, and Southern Rio Grande do Sul.[62] As happened with several other countries in the Americas, such as the United States, which received immigration from many countries, Brazil quickly became a melting pot of races and nationalities, but being peculiar in the sense of having the highest degree of intermarriage in the world.[63] Nowadays, it's possible to find millions of descendants of Italians, from the southeastern state of Minas Gerais to the southernmost state of Rio Grande do Sul, with the majority living in the state of São Paulo (15.9 million)[64] and the highest percentage in the southeastern state of Espírito Santo (60-75%).[64][65][66][67] Small southern Brazilian towns, such as Nova Veneza, have as much as 95% of their population of Italian descent.[40] Thousands of White Americans from the Southern United States (including relatives of former president Jimmy Carter), known as Confederados, fled to Brazil after the American Civil War, where they founded two cities,[68] Americana and Santa Bárbara d'Oeste.[69] Co-official languages in BrazilMain article: Languages of Brazil
In this century has grown a recent trend of co-official languages in cities populated by immigrants (such as Italian and German) or indigenous in the north, both with support from the Ministry of Tourism, as was recently established in Santa Maria de Jetibá, Pomerode and Vila Pavão,[70] where German also has co-official status.[71] The first municipality to adopt a co-official language in Brazil was São Gabriel da Cachoeira, in 2002.[72][73] Since then, other municipalities attempt to co-officialese other languages. The states of Santa Catarina[74][75][76] and Rio Grande do Sul have Talian officially approved as a heritage language in these states,[77] and Espírito Santo has the Pomeranian language, along with the German language, such as cultural heritage state.[78][79][80][81] Also in production is the documentary video Brasil Talian,[82] with directed and written by André Costantin and executive producer of the historian Fernando Roveda.[83] The pre-launch occurred on November 18, 2011, the date that marked the start of production of the documentary.[84] Brazilian states with linguistic heritages officially approved statewide
Municipalities that have co-official indigenous languagesAmazonas
Mato Grosso do SulTocantins
Municipalities that have co-official allochthonous languagesMunicipalities that have co-official Talian language (or Venetian dialect)Rio Grande do Sul Municipalities that the Pomeranian language is co-official in Espírito Santo. Municipalities that have co-official Pomeranian (or Pommersch) languageEspírito Santo
Minas Gerais
Santa CatarinaRio Grande do SulRondônia
Municipalities that have co-official language Riograndenser Hunsrückisch languageSanta Catarina
Rio Grande do SulMunicipalities in which the teaching of the German language is mandatoryRio Grande do SulMunicipalities in which the teaching of the Italian language is mandatoryEspírito SantoParanáRio Grande do SulSanta CatarinaSee also
References
External links
| ||||||||||||||||||||||||||||||||||||||||||||||||||||||||||||||||||||||||||||||||||||||||||||||||||||||||||||||||||||||||||||||||||||||||||||||||||||||||||||||||||||||||||||||||||||||||||||||||||||||||||||||||||||||||||||||||||||||||||||||||||||||||||||||||||||||||||||||||||||||||||||||||||||||||||||||||||||||||||||||||||||||||||||||||||||||||||||||||||||||||||||||||||||||||||||||||||||||||||||||||||||||||||||||||||||||||||||||||||||||||||||||||||||||||||||||||||||||||||||||||||||||||||||||||||||||||||||||||||||||||||||||||||||||||||||||||||||||||||||||||||||
