Dutch general election, 1981
Dutch general election, 1981

|
|
|
|
All 150 seats to the House of Representatives
76 seats were needed for a majority |
| Turnout |
87.0% |
| |
First party |
Second party |
Third party |
| |
 |
 |
 |
| Leader |
Dries van Agt |
Joop den Uyl |
Hans Wiegel |
| Party |
CDA |
PvdA |
VVD |
| Leader since |
1976 |
1966 |
1971 |
| Last election |
49 seats, 31.9% |
53 seats, 33.8% |
28 seats, 17.9% |
| Seats won |
48 |
44 |
26 |
| Seat change |
 1 1 |
9 |
2 |
| Popular vote |
2,677,259 |
2,458,452 |
1,505,311 |
| Percentage |
30.8% |
28.3% |
17.3% |
|
| |
Fourth party |
Fifth party |
Sixth party |
| |
 |
 |
 |
| Leader |
Jan Terlouw |
Fred van der Spek |
Marcus Bakker |
| Party |
D66 |
PSP |
CPN |
| Leader since |
1973 |
1978 |
1963 |
| Last election |
8 seats, 5.4% |
1 seats, 0.9% |
2 seats, 1.7% |
| Seats won |
17 |
3 |
3 |
| Seat change |
 9 9 |
2 |
1 |
| Popular vote |
961,121 |
184,422 |
178,292 |
| Percentage |
11.1% |
2.1% |
2.1% |
|
| |
Seventh party |
Eighth party |
Ninth party |
| |
 |
 |
 |
| Leader |
Henk van Rossum |
Ria Beckers |
Meindert Leerling |
| Party |
SGP |
PPR |
RPF |
| Leader since |
1981 |
1977 |
1980 |
| Last election |
3 seats, 2.1% |
3 seats, 1.7% |
0 seats, 0.6% |
| Seats won |
3 |
3 |
2 |
| Seat change |
 0 0 |
0 |
2 |
| Popular vote |
171,324 |
171,042 |
108,364 |
| Percentage |
2.0% |
2.0% |
1.2% |
|
|
|
|
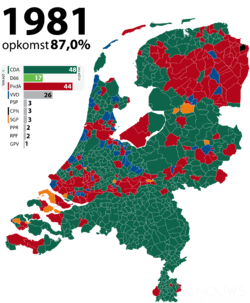
General elections were held in the Netherlands on 26 May 1981.[1] The Christian Democratic Appeal emerged as the largest party, winning 48 of the 150 seats in the House of Representatives.[2]
Results
| Party |
Votes |
% |
Seats |
+/– |
|---|
| Christian Democratic Appeal | 2,677,259 | 30.8 | 48 | –1 |
| Labour Party | 2,458,452 | 28.3 | 44 | –9 |
| People's Party for Freedom and Democracy | 1,505,311 | 17.3 | 26 | –2 |
| Democrats 66 | 961,121 | 11.1 | 17 | +9 |
| Pacifist Socialist Party | 184,422 | 2.1 | 3 | +2 |
| Communist Party of the Netherlands | 178,292 | 2.1 | 3 | +1 |
| Reformed Political Party | 171,324 | 2.0 | 3 | 0 |
| Political Party of Radicals | 171,042 | 2.0 | 3 | 0 |
| Reformatory Political Federation | 108,364 | 1.2 | 2 | +2 |
| Reformed Political League | 70,878 | 0.8 | 1 | 0 |
| Centre Party | 204,372 | 2.4 | 0 | New |
| Democratic Socialists '70 | 0 | –1 |
| The Peace Party | 0 | New |
| Evangelical People's Party | 0 | New |
| God with Us | 0 | New |
| International Communist League | 0 | New |
| Small Party | 0 | New |
| Livable Netherlands | 0 | New |
| Nederlandse Evoluie Partij | 0 | New |
| Dutch Peoples-Union | 0 | 0 |
| Party for the Liquidation of the Netherlands | 0 | New |
| Partij Van Rijksgenoten | 0 | New |
| Realists '81 | 0 | New |
| Roman Catholic Party of the Netherlands | 0 | 0 |
| Right-wing People's Party | 0 | –1 |
| Survive Together or Die | 0 | New |
| Socialist Party | 0 | 0 |
| Verbond tegen Ambtelijke Willekeur | 0 | New |
| Invalid/blank votes | 47,401 | – | – | – |
| Total | 8,738,238 | 100 | 150 | 0 |
| Registered voters/turnout | 10,040,121 | 87.0 | – | – |
| Source: Nohlen & Stöver |
| Popular Vote |
|---|
|
|
|
|
|
| CDA |
|
30.81% |
| PvdA |
|
28.29% |
| VVD |
|
17.32% |
| D66 |
|
11.06% |
| PSP |
|
2.12% |
| CPN |
|
2.05% |
| SGP |
|
1.97% |
| PPR |
|
1.97% |
| RPF |
|
1.25% |
| GPV |
|
0.82% |
| DS70 |
|
0.56% |
| Other |
|
1.79% |
References
- ↑ Nohlen, D & Stöver, P (2010) Elections in Europe: A data handbook, p1396 ISBN 978-3-8329-5609-7
- ↑ Nohlen & Stöver, p1414