Dutch general election, 1977
Dutch general election, 1977

|
|
|
|
All 150 seats to the House of Representatives
76 seats were needed for a majority |
| Turnout |
88.1% |
| |
First party |
Second party |
Third party |
| |
 |
 |
 |
| Leader |
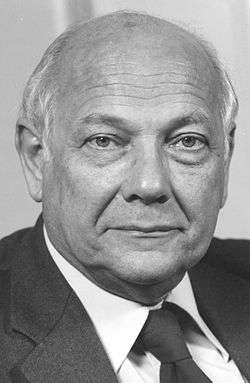
Joop den Uyl |
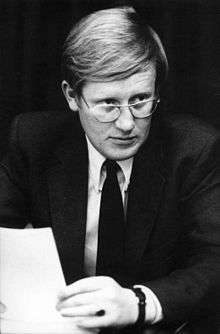
Dries van Agt |
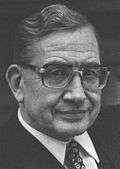
Hans Wiegel |
| Party |
PvdA |
CDA |
VVD |
| Leader since |
1966 |
1976 |
1971 |
| Last election |
43 seats, 27.3% |
48 seats, 30.9% * |
22 seats, 14.4% |
| Seats won |
53 |
49 |
28 |
| Seat change |
 10 10 |
1 |
6 |
| Popular vote |
2,813,793 |
2,653,416 |
1,492,689 |
| Percentage |
33.8% |
31.9% |
17.9% |
|
| |
Fourth party |
Fifth party |
Sixth party |
| |
 |
 |
 |
| Leader |
Jan Terlouw |
Hette Abma |
Marcus Bakker |
| Party |
D66 |
SGP |
CPN |
| Leader since |
1973 |
1971 |
1963 |
| Last election |
6 seats, 4.1% |
3 seats, 2.2% |
7 seats, 4.4% |
| Seats won |
8 |
3 |
2 |
| Seat change |
2 |
 0 0 |
 5 5 |
| Popular vote |
452,423 |
177,010 |
143,481 |
| Percentage |
5.4% |
2.1% |
1.7% |
|
| |
Seventh party |
Eighth party |
Ninth party |
| |
 |
_interpelleert_over_defensienota_-_NL-HaNA_2.24.01.05_0_927-2634_WM239.jpg) |
_-_NL-HaNA_2.24.01.05_0_927-5180_WM247.jpg) |
| Leader |
Ria Beckers |
Bart Verbrugh |
Bram van der Lek |
| Party |
PPR |
GPV |
PSP |
| Leader since |
1977 |
1977 |
1972 |
| Last election |
7 seats, 4.8% |
2 seats, 1.7% |
2 seats, 1.5% |
| Seats won |
3 |
1 |
1 |
| Seat change |
4 |
1 |
1 |
| Popular vote |
140,910 |
79,421 |
77,972 |
| Percentage |
1.6% |
0.9% |
0.9% |
|

|
|
|
General elections were held in the Netherlands on 25 May 1977.[1] The Labour Party remained the largest party, winning 53 of the 150 seats in the House of Representatives.[2] Following the election, it took 208 days of negotiations to form a new government. This was a European record for longest government formation that stood until after the 2010 Belgian general election.[3] The Christian Democratic Appeal was formed by the Anti Revolutionary Party (ARP), Christian Historical Union (CHU) and the Catholic People's Party (KVP) in 1976. The first joint party leader was a member of the KVP, Dries van Agt.
Results
| Party |
Votes |
% |
Seats |
+/– |
|---|
| Labour Party | 2,813,793 | 33.8 | 53 | +10 |
| Christian Democratic Appeal | 2.653.416 | 31.9 | 49 | +1 |
| People's Party for Freedom and Democracy | 1,492,689 | 17.9 | 28 | +6 |
| Democrats 1966 | 452,423 | 5.4 | 8 | +2 |
| Reformed Political Party | 177,010 | 2.1 | 3 | 0 |
| Communist Party of the Netherlands | 143,481 | 1.7 | 2 | –5 |
| Political Party of Radicals | 140,910 | 1.7 | 3 | –4 |
| Reformed Political League | 79,421 | 1.0 | 1 | –1 |
| Pacifist Socialist Party | 77,972 | 0.9 | 1 | –1 |
| Farmers' Party | 69,914 | 0.8 | 1 | –2 |
| Democratic Socialists '70 | 59,487 | 0.7 | 1 | –5 |
| Democratic Action Centre | 158,234 | 1.9 | 0 | New |
| European Conservative Union | 0 | New |
| Federation of Elderly Parties of the Netherlands | 0 | New |
| Griek List | 0 | New |
| Jusia List | 0 | New |
| Communist Unity Movement of the Netherlands | 0 | New |
| New Middle Party | 0 | 0 |
| Dutch Peoples-Union | 0 | New |
| Party of the Taxpayers | 0 | New |
| Roman Catholic Party of the Netherlands | 0 | –1 |
| Reformatory Political Federation | 0 | New |
| Socialist Party | 0 | New |
| Verbond tegen Ambtelijke Willekeur | 0 | New |
| Invalid/blank votes | 48,217 | – | – | – |
| Total | 8,365,829 | 100 | 150 | 0 |
| Registered voters/turnout | 9,506,318 | 88.0 | – | – |
| Source: Nohlen & Stöver |
| Popular Vote |
|---|
|
|
|
|
|
| PvdA |
|
33.83% |
| CDA |
|
31.89% |
| VVD |
|
17.95% |
| D66 |
|
5.44% |
| SGP |
|
2.13% |
| CPN |
|
1.73% |
| PPR |
|
1.69% |
| GPV |
|
0.95% |
| PSP |
|
0.94% |
| BP |
|
0.84% |
| DS70 |
|
0.72% |
| RPF |
|
0.64% |
| Other |
|
1.26% |
References
- ↑ Nohlen, D & Stöver, P (2010) Elections in Europe: A data handbook, p1396 ISBN 978-3-8329-5609-7
- ↑ Nohlen & Stöver, p1414
- ↑ Laurent Thomet (January 8, 2011). "Belgium's shoddy political record poses financial threat". Retrieved 2011-01-27.
Without a government for nearly seven months, Belgium now holds a dubious record in Europe and with no end in sight to the political crisis, fears are growing of a backlash from watchful markets. The divided country on Saturday broke the 208-day mark set by the Netherlands in 1977 for being without a government.