Wellsboro Area School District
| Wellsboro Area School District | |
|---|---|
 | |
| Address | |
|
227 Nichols Street Wellsboro, Pennsylvania, Tioga County 16901 United States | |
| Information | |
| Type | Public |
| School board | 9 locally elected members |
| Superintendent | Christopher Morral (salary $101,365 in 2012) |
| Administrator | Mrs. Bonnie Thompson, Business Manager |
| Principal | Mr. Robert Kreger, WHS |
| Principal | Mr. Steve Adams, CLES, DGES |
| Principal | Mr. Michael Pietropola, RLBMS |
| Staff |
78 non teaching staff members (2013) |
| Faculty |
111 teachers (2013)[1] |
| Grades | K-12 |
| Age | 5 years old to 21 years old for special education |
| Pupils |
1,496 pupils (2015)[3] |
| • Kindergarten | 96 (2014),[6] 110 (2010) |
| • Grade 1 | 122 (2014), 91 |
| • Grade 2 | 115 (2014), 114 |
| • Grade 3 | 87 (2014), 119 |
| • Grade 4 | 118 (2014), 107 |
| • Grade 5 | 114 (2014), 133 |
| • Grade 6 | 110 (2014), 127 |
| • Grade 7 | 131 (2014), 122 |
| • Grade 8 | 134 (2014), 117 |
| • Grade 9 | 125 (2014), 134 |
| • Grade 10 | 110 (2014), 112 |
| • Grade 11 | 125 (2014), 114 |
| • Grade 12 | 109 (2014), 127 (2010) |
| Language | English |
| Budget |
$25,262,680 (2016-17)[7] |
| Per pupil Spending | $13,365 in 2008 |
| Per pupil Spending | $13,939.87 (2010) |
| Website | http://www.wellsborosd.k12.pa.us/ |

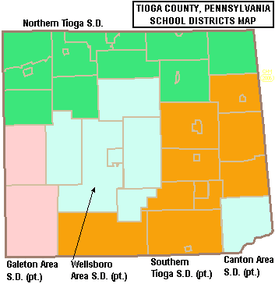
The Wellsboro Area School District is a small, rural/suburban public school district located in central Tioga County. Wellsboro Area School District encompasses approximately 330 square miles (850 km2). The District serves the borough of Wellsboro and also serves: Middlebury Township, Charleston Township, Delmar Township, Duncan Township, and Shippen Township. Pine Township in Lycoming County, Pennsylvania, which is not connected to the rest of the district, is also served. According to 2000 federal census data, the District served a resident population of 11,689. By 2010, the District's population rose slightly to 11,800 people.[13] The educational attainment levels for the Wellsboro Area School District population (25 years old and over) were 90.2% high school graduates and 24.3% college graduates.[14] The District is one of the 500 public school districts of Pennsylvania.
According to the Pennsylvania Budget and Policy Center, 31.8% of the District’s pupils lived at 185% or below the Federal Poverty Level as shown by their eligibility for the federal free or reduced price school meal programs in 2012.[15] In 2009, the District residents' per capita income was $17,091, while the median family income was $39,850.[16] In Tioga County, the median household income was $44,187.[17] In the Commonwealth, the median family income was $49,501 [18] and the United States median family income was $49,445, in 2010.[19] By 2013, the median household income in the United States rose to $52,100.[20] In 2014, the median household income in the USA was $53,700.[21]
Per District officials, in school year 2007-08 the Wellsboro Area School District provided basic educational services to 1,655 pupils through the employment of 134 teachers, 92 full-time and part-time support personnel, and 9 administrators. Wellsboro Area School District received more than $8.5 million in state funding in school year 2007-08. In school year 2009-10, Wellsboro Area School District provided basic educational services to 1,531 pupils. The District employed: 133 teachers, 94 full-time and part-time support personnel, and 10 administrators. Wellsboro Area School District received more than $8.5 million in state funding in school year 2009-10.
Wellsboro Area School District operates four schools: Charlotte Lappla Elementary (K-1), Don Gill Elementary (3-4 grades), Rock Butler Middle (5-8 grades), and Wellsboro Area High School (9-12 grades). The District also offers Wellsboro Online Academy to pupils permitting k-12 students to opt for an online learning environment, rather than attending the traditional brick and mortar school buildings.[22]
Governance
The Wellsboro Area School District is governed by 9 individually elected board members (serve four-year terms), the Pennsylvania State Board of Education, the Pennsylvania Department of Education and the Pennsylvania General Assembly.[23] The federal government controls programs it funds like Title I funding for low-income children in the Elementary and Secondary Education Act and the No Child Left Behind Act, (renamed Every Student Succeeds Act (ESSA) in December 2015) which mandates the district focus resources on student success in acquiring reading and math skills.[24] The school board is required by state law to post a financial report on the district in its website by March of each school year.[25]
The Superintendent and Business Manager are appointed by the school board. The Superintendent is the chief administrative officer with overall responsibility for all aspects of operations, including education and finance. The Business Manager is responsible for budget and financial operations. Neither of these officials are voting members of the School Board. Wellsboro Area School Board enters into individual employment contracts for these positions. These contracts must be in writing and are subject to public discloure under the state’s Right to Know Act. In Pennsylvania, public school districts are required to give 150 days notice to the Superintendent and Business Manager regarding renewal of their employment contracts.[26] Pursuant to Act 141 of 2012 which amended the Pennsylvania School Code, all school districts that have hired superintendents on/after the fall of 2012 are required to develop objective performance standards and post them on the district’s website.[27] The District goals were posted on the website.[28]
The Commonwealth Foundation for Public Policy Alternatives Sunshine Review gave the school board and district administration a "D" for transparency based on a review of "What information can people find on their school district's website". It examined the school district's website for information regarding; taxes, the current budget, meetings, school board members names and terms, contracts, audits, public records information and more.[29]
Academic achievement
Wellsboro Area School District was ranked 222nd out of the 493 ranked Pennsylvania school districts in 2015, by the Pittsburgh Business Times.[30] The ranking was based on student academic performance as demonstrated in the last three years of PSSA results in: reading, writing, math and science.[31][32] The PSSAs are given to all children in grades 3rd through 8th and the 11th grade in high school. Adapted examinations are given to children in the special education programs. Writing exams were given to children in 5th, 8th and 11th grades.[33]
- Overachiever statewide ranking
In 2013, the Pittsburgh Business Times also reported an Overachievers Ranking for 498 Pennsylvania school districts. Wellsboro Area School District ranked 438th. In 2012, the District was 447th. [39] The editor describes the ranking as: "a ranking answers the question - which school districts do better than expectations based upon economics? This rank takes the Honor Roll rank and adds the percentage of students in the district eligible for free and reduced-price lunch into the formula. A district finishing high on this rank is smashing expectations, and any district above the median point is exceeding expectations."[40]
Wellsboro Area School District's Wellsboro Area High School was cited in a state report regarding irregularities in the PSSA testing.[41] After an investigation, the District was required by the Pennsylvania Department of Education to develop a plan to remediate the issues involved. Statewide 48 school districts or charter programs had suspicious results in the exams administered in 2009, 2010, or 2011.[42][43] The scandal called into question much of the student academic growth touted by the Rendell Administration which conspicuously ignored the Data Recognition Corp. forensic erasure analysis.[44][45][46] In 2012, Wellsboro Area Administration received a notice from the Pennsylvania Department of Education that the High School had been cleared.[47]
District AYP status history
In 2012, Wellsboro Area School District declined again to Warning Adequate Yearly Progress (AYP) status due to lagging student achievement.[48] In 2011, the Wellsboro Area School District achieved Adequate Yearly Progress (AYP). In 2011, 94 percent of the 500 Pennsylvania public school districts achieved the No Child Left Behind Act progress level of 72% of students reading on grade level and 67% of students demonstrating on grade level math. In 2011, 46.9 percent of Pennsylvania school districts achieved Adequate Yearly Progress (AYP) based on student performance. An additional 37.8 percent of school districts made AYP based on a calculated method called safe harbor, 8.2 percent on the growth model and 0.8 percent on a two-year average performance.[49][50]
- 2006-2010 - achieved AYP status each school year.[51]
- 2005 - achieved Making Progress School Improvement I AYP status
- 2004 - declined to School Improvement Level I AYP status due to low reading and math achievement. Wellsboro Area School District administration was required by the Pennsylvania Department of Education, to develop a School Improvement Plan to address the District's low student achievement. Under the Pennsylvania Accountability System, the school district was required to pay for additional tutoring for struggling students.[52]
- 2003 - Warning AYP status due to lagging academic achievement
Graduation rate
In 2015, Wellsboro Area School District graduation rate declined again to 85.71%.[53]
- 2014 - 88.24%
- 2013 - 81.67%.[54]
- 2012 - 83%.[55]
- 2011 - 89%.[56]
- 2010 - 92%, the Pennsylvania Department of Education issued a new, 4-year cohort graduation rate.[57]
- According to traditional graduation rate calculations
High school
Wellsboro Area High School is located at 225 Nichols Street, Wellsboro. In 2015, enrollment was reported as 469 pupils in 9th through 12th grades, with 35% of pupils eligible for a free lunch due to family poverty. Additionally, 17% of pupils received special education services, while 9% of pupils were identified as gifted.[61] The school employed 38 teachers.[62] Per the PA Department of Education, 100% of the teachers were rated "Highly Qualified" under the federal No Child Left Behind Act.
According to the National Center for Education Statistics, in 2010, Wellsboro Area High School reported an enrollment of 487 pupils in grades 9th through 12th, with 129 pupils eligible for a federal free or reduced-price lunch. The school employed 40 teachers, yielding a student–teacher ratio of 12:1.[63] According to a report by the Pennsylvania Department of Education, 56 classes were taught by teachers who were rated "Non‐Highly Qualified" under No Child Left Behind.[64]
- 2015 School Performance Profile
Wellsboro Area High School achieved 89 out of 100. Reflects on grade level reading, mathematics and science achievement. The PDE reported that 85.9% of the High School’s students were on grade level in reading/literature. In Algebra 1, 74.5% of students showed on grade level skills at the end of the course. In Biology I, 85% demonstrated on grade level science understanding at the end of the course.[65] Statewide, 53 percent of schools with an eleventh grade achieved an academic score of 70 or better. Five percent of the 2,033 schools with 11th grade were scored at 90 and above; 20 percent were scored between 80 and 89; 28 percent between 70 and 79; 25 percent between 60 and 69 and 22 percent below 60. The Keystone Exam results showed: 73 percent of students statewide scored at grade-level in English, 64 percent in Algebra I and 59 percent in biology.[66][67]
- 2014 School Performance Profile
Wellsboro Area High School achieved 87 out of 100. Reflects on grade level reading, mathematics and science achievement. In reading/literature - 87% were on grade level. In Algebra 1, 68% showed on grade level skills. In Biology, 79% demonstrated on grade level science understanding at the end of the course.[68][69] Statewide, the percentage of high school students who scored proficient and advanced in Algebra I increased to 39.7% to 40.1%. The percentage of high school students who scored proficient and advanced in reading/literature declined to 52.5%. The percentage of high school students who scored proficient and advanced in biology improved from 39.7% to 41.4%.[70]
- 2013 School Performance Profile
Wellsboro Area High School achieved 83.8 out of 100. Reflects on grade level reading, mathematics and science achievement. In reading/literature -74% were on grade level. In Algebra 1 68.93% showed on grade level skills. In Biology, 64% showed on grade level science understanding.[71]
AYP History
In 2012, Wellsboro Area High School remained in Warning Adequate Yearly Progress (AYP) status due to a low graduation rate.[72]
- 2011 - declined to Warning level due to low math achievement.[73]
- 2004-2010 - achieved Adequate Yearly Progress status each school year[74]
- 2003 - Warning AYP status due to lagging academic achievement.
- PSSA Results
Pennsylvania System of School Assessments, commonly called PSSAs are No Child Left Behind Act related examinations which were administered from 2003 through 2012, in all Pennsylvania public high schools. The exams were administered in the Spring of each school year. The goal was for 100% of students to be on grade level or better in reading and mathematics, by the Spring of 2014. The tests focused on the state's Academic Standards for reading, writing, mathematics and science. The Science exam included content in science, technology, ecology and the environmental studies. The mathematics exam included: algebra I, algebra II, geometry and trigonometry. The standards were first published in 1998 and are mandated by the Pennsylvania State Board of Education.[75] In 2013, the Commonwealth of Pennsylvania changed its high school assessments to the Keystone Exams in Algebra 1, Reading/literature and Biology1. The exams are given at the end of the applicable course, rather than all in the spring of the student's 11th grade year.[76]
- 11th Grade Reading:
- 2012 - 83% on grade level, (8% below basic). State - 67% of 11th graders are on grade level.[77]
- 2011 - 71% (11% below basic). State - 69.1% [78]
- 2010 - 67% (17% below basic). State - 67%.[79]
- 2009 - 78%, State - 65%[80]
- 2008 - 68%, State - 65% [81]
- 2007 - 69%, State - 65% [82]
- 11th Grade Math:
- 2012 - 67% on grade level (14% below basic). In Pennsylvania, 59% of 11th graders are on grade level.[83]
- 2011 - 57% (20% below basic). State - 60.3% [84]
- 2010 - 63.7% (19% below basic). State - 59% [85]
- 2009 - 67.5%, State - 56%[86]
- 2008 - 69%, State - 55%[87]
- 2007 - 47%, State - 53%
- 11th Grade Science:
- 2012 - 66% on grade level (5% below basic). State - 42% of 11th graders were on grade level.[88]
- 2011 - 47% (10% below basic). State - 40% [89]
- 2010 - 36% (18% below basic). State - 39%
- 2009 - 47%, State - 40%
- 2008 - 54%, State - 39%
Science in Motion Wellsboro Area High School did not take advantage of a state program called Science in Motion which brought college professors and sophisticated science equipment to the school to raise science awareness and to provide inquiry-based experiences for the students. The Science in Motion program was funded by a state appropriation and cost the school nothing to participate.[90]
Graduation requirements
The Wellsboro School Board requires students to earn 25 credits to graduate. The following credits are required of all students for graduation: English 4 credits, Social Studies 4 credits, Mathematics 4 credits, Science 4 credits, Arts & Humanities 2 credits, Health 0.5 credit, Physical Education 2 credits, Driver Education .25 credit, Computer 0.5 credit, Career Pathway Electives 3.50 credits and the Graduation project .25 credit.[91]
By law, all Pennsylvania secondary school students must complete a project as a part of their eligibility to graduate from high school. The type of project, its rigor and its expectations are set by the individual school district.[92][93] Effective with the graduating class of 2017, the Pennsylvania State Board of Education eliminated the state mandate that students complete a culminating project in order to graduate.[94]
By Pennsylvania School Board regulations, for the graduating class of 2019, students must demonstrate successful completion of secondary level course work in Algebra I, Biology, English Composition, and Literature for which the Keystone Exams serve as the final course exams. Students’ Keystone Exam scores shall count for at least one-third of the final course grade.[95][96][97][98] In 2011, Pennsylvania high school students field tested the Algebra 1, Biology and English Literature exams. The statewide results were: Algebra 1 38% on grade level, Biology 35% on grade level and English Lit - 49% on grade level.[99] Individual student, school or district reports were not made public, although they were reported to district officials by the Pennsylvania Department of Education. Students identified as having special needs and qualifying for an Individual Educational Program (IEP) may graduate by meeting the requirements of their Individual Education Plan (IEP).
College remediation
According to a Pennsylvania Department of Education study released in January 2009, 16% of Wellsboro Area High School graduates required remediation in mathematics and or reading before they were prepared to take college level courses in the Pennsylvania State System of Higher Education or community colleges.[100] Less than 66% of Pennsylvania high school graduates, who enroll in a four-year college in Pennsylvania, will earn a bachelor's degree within six years. Among Pennsylvania high school graduates pursuing an associate degree, only one in three graduate in three years.[101] Per the Pennsylvania Department of Education, one in three recent high school graduates who attend Pennsylvania's public universities and community colleges takes at least one remedial course in math, reading or English.
Dual enrollment
Wellsboro Area High School offers a dual enrollment program. This state program permits high school students to take courses, at local higher education institutions, to earn college credits. Students remain enrolled at their high school. The courses count towards high school graduation requirements and towards earning a college degree. The students continue to have full access to activities at their high school. The college credits are offered at a deeply discounted rate. The state offers a small grant to assist students in costs for tuition, fees and books.[102] Under the Pennsylvania Transfer and Articulation Agreement, many Pennsylvania colleges and universities accept these credits for students who transfer to their institutions.[103] For the 2009-10 funding year, the school district received a state grant of $11,588 for the program. Wellsboro Area High School has a dual enrollment agreement with Mansfield University.[104] In 2010, Governor Edward Rendell eliminated the grants to students.
The District is not participating in the Penn College NOW program offered by the Pennsylvania College of Technology. Penn College NOW classes are taught by approved local high school teachers, at the high school.[105] Penn College NOW is partially funded by the Carl D. Perkins Career and Technical Education Improvement Act of 2006 (Public Law 109-270) through the Pennsylvania Department of Education, by the support of Pennsylvania companies through the Educational Improvement Tax Credit program managed by the Pennsylvania Department of Community and Economic Development and by Pennsylvania College of Technology.
SAT scores
In 2014, 68 Wellsboro Area School District students took the SAT exams. The District's Verbal Average Score was 512. The Math average score was 479. The Writing average score was 481.[106][107] Statewide in Pennsylvania, Verbal Average Score was 497. The Math average score was 504. The Writing average score was 480. The College Board also reported that nationwide scores were: 497 in reading, 513 in math and 487 in writing.[108] In 2014, 1,672,395 students took the SATs in the United States.
In 2013, 83 Wellsboro Area School District students took the SAT exams. The District's Verbal Average Score was 534.7. The Math average score was 528. The Writing average score was 499. The College Board reported that statewide scores were: 494 in reading, 504 in math and 482 in writing. The nationwide SAT results were the same as in 2012.[109]
In 2012, 72 Wellsboro Area School District students took the SAT exams. The District's Verbal Average Score was 497. The Math average score was 500. The Writing average score was 477. The statewide Verbal SAT exams results were: Verbal 491, Math 501, Writing 480. In the USA, 1.65 million students took the exams achieving scores: Verbal 496, Math 514, Writing 488. According to the College Board the maximum score on each section was 800, and 360 students nationwide scored a perfect 2,400.
In 2011, 81 Wellsboro students took the SAT exams. The district's Verbal Average Score was 489. The Math average score was 484. The Writing average score was 462.[110] Pennsylvania ranked 40th among state with SAT scores: Verbal - 493, Math - 501, Writing - 479.[111] In the United States 1.65 million students took the exam in 2011. They averaged 497 (out of 800) verbal, 514 math and 489 in writing.[112]
The Center for Rural Pennsylvania, a research arm of the Pennsylvania General Assembly, compared the SAT data of students in rural areas of Pennsylvania to students in urban areas. From 2003 to 2005, the average total SAT score for students in rural Pennsylvania was 992, while urban students averaged 1,006. During the same period, 28 percent of 11th and 12th graders in rural school districts took the exam, compared to 32 percent of urban students in the same grades. The average math and verbal scores were 495 and 497, respectively, for rural students, while urban test-takers averaged 499 and 507, respectively. Pennsylvania’s SAT composite score ranked low on the national scale in 2004. The composite SAT score of 1,003 left Pennsylvania ranking 44 out of the 50 states and Washington, DC.[113]
The Pennsylvania Department of Education reported that 71 percent of students in rural areas of Pennsylvania chose to continue their education after high school in 2003, whereas 79 percent of urban high school graduates opted to continue their education.
AP Courses
In 2015, Wellsboro Area High School offered 7 Advanced Placement (AP) courses at a higher cost than regular courses. Berwick Area High School requires students to take the AP exam if they take an AP course. The fee for each AP Exam is $91 (2014).[114] The school normally retains $9 of that fee as a rebate to help with administrative costs. In 2012, the fee was $89 per test per pupil. Students have the option of taking College Board approved courses and then taking the College Board's examination in the Spring. Students, who achieve a 3 or better on the exam, may be awarded college credits at US universities and colleges. Each higher education institution sets its own standards about what level of credits are awarded to a student based on their AP exam score. Most higher education give credits for scores of 4 or 5. Some schools also give credits for scores of 3. High schools give credits towards graduation to students who take the school's AP class. In 2015, at Wellsboro Area High School only 24.27% of the students who took an AP course earned a 3 or better on the exam.[115]
In 2014, 30% of pupils at Wellsboro Area High School who took the AP exam given by the College Board achieved a 3 or better on the exam.[116] In 2013, 29% of pupils at Wellsboro Area High School who took an AP exam achieved a 3 or better on the exam.[117]
Rock L. Butler Middle School
Rock L Butler Middle School is located at 9 Nichols Street, Wellsboro. In 2015, enrollment was 489 pupils, in grades 5th through 8th, with 38% of pupils eligible for a free lunch due to family poverty. Additionally, 18% of pupils received special education services, while 8% of pupils were identified as gifted.[118] According to a 2014 report by the Pennsylvania Department of Education, 100% of its teachers were rated "Highly Qualified" under No Child Left Behind.[119]
According to the National Center for Education Statistics, in 2013, the school reported an enrollment of 500 pupils, in grades 5th through 8th, with 182 pupils receiving a federal free or reduced price lunch due to family poverty. The school employed 35 teachers yielding a student-teacher ratio of 14:1.[120] According to a report by the Pennsylvania Department of Education, 56 classes were taught by teachers who were rated "Non‐Highly Qualified" under No Child Left Behind.[121] The school was a federally designated Title I school.
In 2010, the administration reported 477 students enrolled in grades 5th through 8th grade with 163 students eligible for a federal free or reduced-price lunch due to family poverty. The school employed 36 teachers yielding a 13:1 student–teacher ratio.[122] The Pennsylvania Department of Education reported in the School's annual report that 56 classes that were taught by teachers who were rated "Non‐Highly Qualified" under the federal No Child Left Behind Act in 2012.
- 2015 School Performance Profile
The PDE reported that 73% of 8th grade students at Rock Butler Middle School students were on grade level in reading on the PSSAs given in April 2015. In math/Algebra 1, just 32% of 8th grade students showed on grade level skills. In science, 68% of the school’s 8th graders demonstrated on grade level science understanding. No eighth grade writing scores were reported. In 7th grade, 59% were on grade level in reading, while 38% showed on grade level math skills. Among 6th graders, 81% were on grade level in reading and 49% were on grade level in mathematics. Among fifth graders, 76% of 5th grade students were on grade level in reading. In mathematics, 47% of 5th grade students showed on grade level skills. No fifth grade writing scores were reported.[123] Statewide 58% of eighth (8th) graders were on grade level in reading, while 29% demonstrated on grade level math skills. Pennsylvania 7th graders were 58% on grade level in reading and 33% demonstrated on grade level math skills. Among sixth (6th) graders, 60.7% were reading on grade level, while 39.7% demonstrated on grade level math skills. Statewide 61.9% of fifth (5th) graders were on grade level in reading, while 42.8% demonstrated on grade level math skills.[124]
- 2014 School Performance Profile
Rock Butler Middle School achieved 78.6 out of 100. Reflects on grade level reading, mathematics and science achievement. In reading/literature - 77% were on grade level. In Algebra 1/Math, 73% showed on grade level mathematics skills. In Science, 64% of 8th graders showed on grade level science understanding. In writing, 61.7% of the 8th grade students demonstrated on grade level writing skills.[125]
- 2013 School Performance Profile
Rock L. Butler Middle School achieved 78.8 out of 100. Reflects on grade level reading, writing, mathematics and science achievement. In reading, 71% of the students were on grade level. In Mathematics, 72.5% of the students showed on grade level skills. In Science, 75% of the 8th graders demonstrated on grade level understanding. In writing, 48.9% of the 5th and 8th grade students were on grade level.[126]
AYP History
In 2012, Rock L. Butler Middle School remained in School Improvement II status due to lagging reading and math achievement.[127]
- 2011, Rock L. Butler Middle School declined further to School Improvement II status due to chronic, low math achievement.[128] The district reported that 17 core subject classes were taught by teachers that were not highly qualified under No Child Left Behind. Wellsboro Area School District is a Title I eligible and participating district under the No Child Left Behind Act, parents may contact their child’s school to determine which professional employees are, by definition, highly qualified. Due to the low student achievement, the District was required to notify parents that they could transfer their child to another district middle school that was achieving AYP.[129] In 2011, Wellsboro Area School Board revised the attendance policy to permit 10 days of absence without a doctor's note. Previously the policy had permitted 20 sick days without a note.[130]
- 2010 - remained in "Making Progress: School Improvement Level 1". The administration was required to write a School Improvement Plan, make it public and submit it to the Pennsylvania Department of Education.
- 2009 - declined further to School Improvement Level I AYP status due to chronic, low student achievement in reading and math[131] In 2010 and 2009 the attendance rate was 95%.[132]
- 2008 - declined to Warning AYP status due to lagging student achievement[133]
- 2003 - 2007 - achieved AYP status each school year.
- PSSA Results:
Pennsylvania System of School Assessments, commonly called PSSAs are NCLB related examination given in the Spring of each school year. Fifth graders are teasted in: reading, mathematics, and writing. Sixth and seventh grades have been tested in reading and mathematics since 2006. Eighth graders are tested in: reading, writing, mathematics and Science. Beginning in the Spring of 2013, eighth graders, who are enrolled in Algebra I take the Keystone Exam for Algebra I at the end of the course. The testing of 8th grade in reading and mathematics began in 1999, as a state initiative.[134] Testing in science began in 2007. The goal is for 100% of students to be on grade level or better in reading and mathematics, by the Spring of 2014. The tests focus on the state's Academic Standards for reading, writing, mathematics and science.[135] The standards were published in 1998 and are mandated by the Pennsylvania State Board of Education.[75] In 2014, the Commonwealth of Pennsylvania adopted the Pennsylvania Core Standards - Mathematics.[136]
|
|
- 8th Grade Science:
- 2012 - 62% on grade level (11% below basic). State - 59% of 8th graders were on grade level.
- 2011 - 59% (17% below basic). State – 58.3%
- 2010 - 62% (19% below basic). State - 57%
- 2009 - 64%, State - 54%
- 2008 - 59%, State - 52% [144]
|
|
|
|
|
|
- Dropout Early Warning System
In 2013, Wellsboro Area School District did not implement the state no cost dropout prevention Early Warning System and Interventions Catalog at the junior high school.[146] The process identifies students at risk for dropping out by examining the pupil’s: attendance, behavior and course grades. Interventions are implemented to assist at-risk pupils to remain in school. The program is funded by federal and private dollars.[147]
Don Gill Elementary School
Don Gill Elementary School is located at 10 Sherman Street, Wellsboro. In 2015, the School's enrollment was 320 pupils in grades 2nd through 4th, with 45% of pupils receiving a federal free or reduced price meals due to family poverty. Additionally, 15% of the pupils receive special education services, while 4% are identified as gifted.[148] According to a report by the Pennsylvania Department of Education, 100% of the teachers were rated highly qualified under No Child Left Behind.[149] The school is a federally designated Title I school.
According to the National Center for Education Statistics, in 2013, enrollment was 313 pupils in grades 2nd through 4th, with 132 pupils receiving a free or reduced price lunch. The School employed 23 teachers yielding a student-teacher ratio of 13.6:1.[150] According to a report by the Pennsylvania Department of Education, 100% of its teachers were rated "Highly Qualified" under the federal No Child Left Behind Act.[151]
According to the National Center for Education Statistics, in 2010, Don Gill Elementary School reported an enrollment of 358 pupils in grades kindergarten through 4th, with 142 pupils receiving a federal free or reduced-price lunch due to family poverty. The school employed 25 teachers, yielding a student–teacher ratio of 14:1.[152] According to a report by the Pennsylvania Department of Education, 45 classes were taught by teachers who were rated "Non‐Highly Qualified" under the federal No Child Left Behind Act. In 2013, only 70% of the classes were taught by highly qualified teachers. The school provided full day kindergarten to all its pupils.[153]
- 2015 School Performance Profile
According to the Pennsylvania Department of Education, 65% of fourth graders were on grade level in reading, while 34% showed on grade level math skills. In science, 88% of fourth graders showed on grade level understanding. Among third (3rd) graders, 70% were on grade level in reading and 53% were on grade level in mathematics.[154] Pennsylvania 4th graders were 58.6% on grade level in reading and 44.4% demonstrated on grade level math skills. In science, 77.3% of fourth graders showed on grade level understanding. Among Pennsylvania third (3rd) graders, 62% were reading on grade level, while 48.5% demonstrated on grade level math skills.[155]
- 2014 School Performance Profile
Don Gill Elementary School achieved a score of 81.3 out of 100. The score reflects on grade level: reading, science, writing and mathematics achievement. In 2013-14, only 80% of the students were reading on grade level in grades 3rd through 4th. In 3rd grade, 79% of the pupils were reading on grade level. In math, 82% were on grade level (3rd-4th grades). In 4th grade science, 86% of the pupils demonstrated on grade level understanding.[156]
- 2013 School Performance Profile
Don Gill Elementary School achieved a score of 73 out of 100. The score reflects on grade level: reading, science, writing and mathematics achievement. In 2012-13, only 69% of the students were reading on grade level in grades 3rd and 4th. In 3rd grade, 71% of the pupils were reading on grade level. In math, 84% were on grade level (3rd-4th grades). In 4th grade science, just 90.74% of the pupils demonstrated on grade level understanding.[157]
AYP History
In 2011 and 2012, Don Gill Elementary School achieved AYP status.[158]
- 2010 - Warning status due to not making AYP under No Child Left Behind.
- 2005 to 2009 - achieved AYP each school year.[159] The attendance rate in 2010 and 2009 was 95%.[160]
- PSSA history
Each year, in the Spring, in order to comply with the federal No Child Left Behind Law, the 3rd graders take the PSSAs in math and reading. The fourth grade is tested in reading, math and science. The fifth grade is evaluated in reading, mathematics and writing. Pennsylvania System of School Assessments, commonly called PSSAs are No Child Left Behind Act related examinations which were administered beginning 2003 to all Pennsylvania public school students in grades 3rd-8th.[161] The goal was for 100% of students to be on grade level or better in reading and mathematics, by the Spring of 2014.[162][163][164] The tests focused on the state's Academic Standards for reading, writing, mathematics and science. The Science exam is given to 4th grades and includes content in science, technology, ecology and the environmental studies.[165] The first cohort of children who attended Accountability Block Grant funded full-day kindergarten reached third grade and took the PSSAs in the spring of 2008.
|
|
- 4th Grade Science:
- 2012 - 86%, (2% below basic). State - 82%
- 2011 - 86%, (2% below basic). State - 82.9%
- 2010 - 84%, State - 81%
- 2009 - 87%, State - 83%
- 2008 - 89%, State - 81%
|
|
Charlotte Lappla Elementary School
Charlotte Lappla Elementary School is located at 32 Meade Street, Wellsboro. In 2015, enrollment was 218 pupils, in kindergarten and first grade, with 50% of pupils eligible for a free lunch due to family poverty. Additionally, 15% of pupils received special education services, while none of pupils were identified as gifted.[171] According to a 2014 report by the Pennsylvania Department of Education, 100% of its teachers were rated "Highly Qualified" under No Child Left Behind.[172]
Charlotte Lappla Elementary School provided kindergarten and 1st grade in 2010. There were 213 pupils and 15 teachers. By 2012, enrollment declined to 201 children. Eighty one pupils qualified for a federal free lunch or reduced-price lunch due to family poverty.[173] In 2013, only 66% of the classes were taught by teachers who were "highly qualified" under the No Child Left Behind Act. The school provided full day kindergarten to all its pupils.[153]
Under the No Child Left Behind Act, no mandated statewide testing is conducted for kindergarten or first grade.
Wellness policy
Wellsboro Area School Board established a district wellness policy in 2006 - Policy 246.[174] The policy deals with nutritious meals served at school, the control of access to some foods and beverages during school hours, age appropriate nutrition education for all students, and physical education for students K-12. The policy is in response to state mandates and federal legislation (P.L. 108 - 265). The law dictates that each school district participating in a program authorized by the Richard B. Russell National School Lunch Act (42 U.S.C. 1751 et seq) or the Child Nutrition Act of 1966 (42 U.S.C. 1771 et seq) "shall establish a local school wellness policy by School Year 2006."
The legislation placed the responsibility of developing a wellness policy at the local level so the individual needs of each district can be addressed. According to the requirements for the Local Wellness Policy, school districts must set goals for nutrition education, physical activity hat are aligned with the Pennsylvania State Academic Standards for Health, Safety and Physical Education, campus food provision, and other school-based activities designed to promote student wellness. Additionally, districts were required to involve a broad group of individuals in policy development and to have a plan for measuring policy implementation. Districts were offered a choice of levels of implementation for limiting or prohibiting low nutrition foods on the school campus. In final implementation these regulations prohibit some foods and beverages on the school campus.[175] The Pennsylvania Department of Education required the district to submit a copy of the policy for its approval.
Wellsboro Area School District offers a free school breakfast and free or reduced-price lunch to children in low income families. All students attending the school can eat breakfast and lunch. Children from families with incomes at or below 130 percent of the federal poverty level are provided a breakfast and lunch at no cost to the family. Children from families with incomes between 130 and 185 percent of the federal poverty level can be charged no more than 30 cents per breakfast. A foster child whose care and placement is the responsibility of the State or who is placed by a court with a caretaker household is eligible for both a free breakfast and a free lunch. Runaway, homeless and Migrant Youth are also automatically eligible for free meals.[176] The meals are partially funded with federal dollars through the United States Department of Agriculture.[177]
In 2013, the USDA issued new restrictions to foods in public schools. The rules apply to foods and beverages sold on all public school district campuses during the day. They limit vending machine snacks to a maximum of 200 calories per item. Additionally, all snack foods sold at school must meet competitive nutrient standards, meaning they must have fruits, vegetables, dairy or protein in them or contain at least 10 percent of the daily value of fiber, calcium, potassium, and Vitamin D.[178] In order to comply with the Healthy, Hunger-Free Kids Act of 2010 all US public school districts are required to raise the price of their school lunches to $2.60 regardless of the actual cost of providing the lunch.[179]
Wellsboro Area School District provides health services as mandated by the Commonwealth and the federal government. Nurses are available in each building to conduct annual health screenings (data reported to the PDE and state Department of Health) and to dispense prescribed medications to students during the school day. Students can be excluded from school unless they comply with all the State Department of Health’s extensive immunization mandates. School nurses monitor each pupil for this compliance.[180] Nurses also monitor each child's weight.
Special education
In December 2015, the District administration reported that 278 pupils or 18.1% of the district's pupils received Special Education services, with 40% of the identified students having a specific learning disability.[181]
In December 2013, the District administration reported that 248 pupils or 16.3% of the district's pupils received Special Education services, with 42% of the identified students having a specific learning disability.[182] In 2012, Wellsboro Area School District reported that 235 children or 15.2% of the students received Special Education services, with 51% of identified students having a specific learning disability. In 2010, Wellsboro Area School District reported that 15.9% of the students received Special Education services, with 48% of identified students having a specific learning disability. In December 2008, the district reported that 15% of the students received special education services.[183] The district currently employs 16 certified special education teachers. The district also contracts for speech support, occupational therapy, physical therapy, vision support and music therapy.[184]
In 2007, Pennsylvania Secretary of Education Gerald Zahorchak testified before the Pennsylvania House Education Committee regarding full day kindergarten. He claimed that districts which offered the program would see a significant decrease in special education students due to early identification and early intervention. He asserted the high cost of full day kindergarten would be recouped by Districts in lower special education costs.[185] Wellsboro Area School District has provided full day kindergarten since 2003. The District has seen an increase in the percentage of special education students it serves, yielding no savings.
In order to comply with state and federal Individuals with Disabilities Education Act rules and regulations, the school district engages in identification procedures to ensure that eligible students receive an appropriate educational program consisting of special education and related services, individualized to meet student needs. At no cost to the parents, these services are provided in compliance with state and federal law; and are reasonably calculated to yield meaningful educational benefit and student progress .[186] To identify students who may be eligible for special education services, various screening activities are conducted on an ongoing basis. These screening activities include: review of group-based data (cumulative records, enrollment records, health records, report cards, ability and achievement test scores); hearing, vision, motor, and speech/language screening; and review by the Special Education administration. When screening results suggest that the student may be eligible, the District seeks parental consent to conduct a multidisciplinary evaluation. Parents who suspect their child is eligible may verbally request a multidisciplinary evaluation from a professional employee of the District or contact the district's Special Education Department.[187][188]
In 2010, the state of Pennsylvania provided $1,026,815,000 for Special Education services. This funding is in addition to the state's basic education per pupil funding, as well as, all other state and federal funding.[189] The Pennsylvania Special Education funding system assumes that 16% of the district’s students receive special education services. It also assumes that each student’s needs accrue the same level of costs.[190] The state requires each district to have a three-year special education plan to meet the unique needs of its special education students.[191] Overidentification of students, in order to increase state funding, has been an issue in the Commonwealth. Some districts have more than 20% of its students receiving special education services while others have 10% supported through special education.[192]
Wellsboro Area School District received a $925,949 supplement for special education services in 2010.[193] For the 2011-12, 2012–13 and 2013-14 school years, all Pennsylvania public school districts received the same level of funding for special education that they received in 2010-11. This level funding is provided regardless of changes in the number of pupils who need special education services and regardless of the level of services the respective students required.[194][194][195] For the 2014-2015 school year, Wellsboro Area School District received an increase to $942,431, from the Commonwealth for special education funding.[196]
Additionally, the state provides supplemental funding for extraordinarily impacted students. The District must apply for this added funding. In 2013, the state's Special Education Funding Reform Commission provided a report on the state of funding for special education in the Commonwealth.[197] Funding for special education programs is borne largely on a local basis at 60%, with the state contributing $1 billion or 30% and the federal government providing 10% of the funding.
Gifted education
The Wellsboro Area School District Administration reported that 80 students or 5.08% of its students were gifted in 2009.[198] By law, the district must provide mentally gifted programs at all grade levels. The referral process for a gifted evaluation can be initiated by teachers or parents by contacting the student’s building principal and requesting an evaluation. All requests must be made in writing. To be eligible for mentally gifted programs in Pennsylvania, a student must have a cognitive ability of at least 130 as measured on a standardized ability test by a certified school psychologist. Other factors that indicate giftedness will also be considered for eligibility.[199][200]
School safety and bullying
Wellsboro Area School District administration reported there were zero incidents of bullying in the District in 2014. Additionally, there was one incident of terroristic threats and no sexual incidents involving students. The local law enforcement was involved in five incidents at the schools, making 2 arrests.[201] [202] Each year the school safety data is reported by the district to the Safe School Center which then publishes the compiled reports online. Nationally, nearly 20% of pupils report being bullied at school.[203]
Wellsboro Area School District Administration reported there were zero incidents of bullying in the district in 2009. There were 8 incidents involving local police.[204] Each year the school safety data is reported by the district to the Safe School Center which publishes the reports online.
The Wellsboro Area School Board has provided the district's antibully policy online.[205] All Pennsylvania schools are required to have an anti-bullying policy incorporated into their Code of Student Conduct. The policy must identify disciplinary actions for bullying and designate a school staff person to receive complaints of bullying. The policy must be available on the school's website and posted in every classroom. All Pennsylvania public schools must provide a copy of its anti-bullying policy to the Office for Safe Schools every year, and shall review their policy every three years. Additionally, the District must conduct an annual review of that policy with students.[206] The Center for Schools and Communities works in partnership with the Pennsylvania Commission on Crime & Delinquency and the Pennsylvania Department of Education to assist schools and communities as they research, select and implement bullying prevention programs and initiatives.[207][208]
Education standards relating to student safety and antiharassment programs are described in the 10.3. Safety and Injury Prevention in the Pennsylvania Academic Standards for Health, Safety and Physical Education.[209]
Budget
Pennsylvania public school districts budget and expend funds according to procedures mandated by the General Assembly and the Pennsylvania Department of Education (PDE). An annual operating budget is prepared by school district administrative officials. A uniform form is furnished by the PDE and submitted to the board of school directors for approval prior to the beginning of each fiscal year on July 1.
Under Pennsylvania’s Taxpayer Relief Act, Act 1 of the Special Session of 2006, all school districts of the first class A, second class, third class and fourth class must adopt a preliminary budget proposal. The proposal must include estimated revenues and expenditures and the proposed tax rates. This proposed budget must be considered by the Board no later than 90 days prior to the date of the election immediately preceding the fiscal year. The preliminary budget proposal must also be printed and made available for public inspection at least 20 days prior to its adoption. The board of school directors may hold a public hearing on the budget, but are not required to do so. The board must give at least 10 days’ public notice of its intent to adopt the final budget according to Act 1 of 2006.[210]
In 2013, the average teacher salary in Wellsboro Area School District was $61,443 a year.[211] The District employed 156 teachers and administrators with a top salary of $127,727.[212][213] Pennsylvania teacher salaries (2013–14) are searchable in a statewide database provided by TribLive News.[214] Wellsboro Area School District teacher and administrator retirement benefits are equal to at least 2.00% x Final Average Salary x Total Credited Service. (Some teachers benefits utilize a 2.50% benefit factor.)[215] After 40 years of service, Pennsylvania public school teachers and administrators can retire with 100% of the average salary of their final 3 years of employment. According to a study conducted at the American Enterprise Institute, in 2011, public school teachers’ total compensation is roughly 50 percent higher than they would likely receive in the private sector. The study found that the most generous benefits that teachers receive are not accounted for in many studies of compensation including: pension, retiree health benefits and job security.[216] In 2014-15, Pennsylvania public school district mandated teacher pension contribution rose to 21.40% of employee salaries and in 2015-16 it rose again to 25.84% of total salaries.[217] In 2014-15, the state mandated District contribution to the teacher pension fund rose to 21.40% of employee salaries and in 2015-16 it rose again to 25.84% of total District salaries.[218]
In 2012, the Wellsboro Area School District employed 116 teachers with an average teacher salary in Wellsboro Area School District was $58,301 a year, while the cost of the benefits teachers receive was $20,059.98 per employee, for a total annual average teacher compensation of $78,361.85.[219]
In 2011, Wellsboro Area School District employed 131 teachers with an average teacher salary in Wellsboro Area School District was $59,964 a year, while the cost of the benefits teachers receive was $16,913 per employee, for a total annual average teacher compensation of $72,267.76.[220] According to a study conducted at the American Enterprise Institute, in 2011, public school teachers’ total compensation is roughly 50 percent higher than they would likely receive in the private sector. The study found that the most generous benefits that teachers receive are not accounted for in many studies of compensation, including: pension, retiree health benefits and job security.[216]
In 2009, Wellsboro Area School District reported that it employed 130 teachers with a salary range of $38,428 to $101,000.[221] The teachers also receive a benefits package which includes: a defined benefit pension, health insurance, life insurance, reimbursement for college credits, 10 paid sick days (which accumulate), 3 paid personal days, and paid bereavement leave of absence. The teachers receive extra duty compensation and payment for work beyond the regular school day and school year. The district also offers a retirement incentive to teachers of $1,000 to $10,000. The district gives the union 6 paid days to use for conducting union business.[222]
In 2007, the Wellsboro Area School District employed 119 teachers and the average teacher salary in the district was $51,718 for 180 days worked.[223] In 2009, salaries for 115 professional staff range between $38,428 to $91,000. Fifty two teachers earned over $60,000 in 2009. The superintendent earned $101,000.[224] The superintendent also receives an extensive benefits package including: health insurance, life insurance, the taxpayer pays for conferences, dues, up to $500/month to rent for one year and $6,000 for moving and a defined benefit pension.[225]
Per pupil spending Wellsboro Area School District administrative costs per pupil were $922 in 2008. This ranked 91st out of 500 Pennsylvania public school districts for administrative spending. The lowest administrative cost per pupil in Pennsylvania was $398 per pupil.[226]
Wellsboro Area School District ranked 144th in Pennsylvania for per pupil spending at $13,365 in 2008.[227] In 2010, the per pupil spending had increased to $13,816.89 per child.[228] In 2011, Pennsylvania’s per pupil spending was $13,467, ranking 6th in the United States.[229] In 2007, the Pennsylvania per pupil total expenditures was reported as $12,759.[230]
The U.S. Census Bureau reported that Pennsylvania spent $8,191 per pupil in school year 2000-01.[231] In 2007, the Pennsylvania per pupil total expenditures was reported as $12,759.[230] Among the fifty states, Pennsylvania’s total per pupil revenue (including all sources) ranked 11th at $15,023 per student, in 2008-09.[232] Pennsylvania’s total revenue per pupil rose to $16,186 ranking 9th in the nation in 2011.[233]
Reserves In 2009, Wellsboro Area School District reported having an unreserved-undesignated fund balance of $1,710,155.00.[234] In 2012, Wellsboro Area School District Administration reported $1,727,200 in the unreserved-undesignated fund balance. The District also reported $2,511,445 in its unreserved-designated fund in 2012, for a total reserves of $4,238,645. In 2014-15, Wellsboro Area School District reported having $4,414,804 in reserves.[235] Pennsylvania public school district reserve funds are divided into two categories – designated and undesignated. The undesignated funds are not committed to any planned project. Designated funds and any other funds, such as capital reserves, are allocated to specific projects. School districts are required by state law to keep 5 percent of their annual spending in the undesignated reserve funds to preserve bond ratings. According to the Pennsylvania Department of Education, from 2003 to 2010, as a whole, Pennsylvania school districts amassed nearly $3 billion in reserved funds.[236]
Audits The Pennsylvania Auditor General conducted a performance audit of the Wellsboro Area School District in January 2010. It was noted that district personnel should improve controls over remote access to its computers.[237] Wellsboro Area School District also conducts an annual audit. The reports are posted in the district's website after review by the school board.[238]
Tuition Students who live in the Wellsboro Area School District's attendance area may choose to attend one of Pennsylvania's 157 public charter schools. A student living in a neighboring public school district or a foreign exchange student may seek admission to Wellsboro Area School District. For these cases, the Pennsylvania Department of Education sets an annual tuition rate for each school district. It is the amount the public school district pays to a charter school for each resident student that attends the charter and it is the amount a nonresident student's parents must pay to attend the District's schools. The 2012 tuition rates are Elementary School - $8,343.38, High School - $9,951.51.[239] For 2016, Wellsboro Area School District reported receiving over $100,000 in tuition payments.
Wellsboro Area School District is funded by a combination of: a local earned income tax 1%,[240] a property tax, a local services tax of $5 per year per person, a real estate transfer tax 0.5%, coupled with substantial funding from the Commonwealth of Pennsylvania and the federal government.[241] Grants can provide an opportunity to supplement school funding without raising local taxes. Interest earnings on accounts also provide nontax income to the District. In the Commonwealth of Pennsylvania, pension income and Social Security income are exempted from state personal income tax and local earned income tax, regardless of the level of the individual’s personal wealth.[242] The average Pennsylvania public school teacher pension in 2011 exceeds $60,000 a year plus they receive federal Social Security benefits: both are free of Pennsylvania state income tax and local income tax which funds local public schools.[243]
State basic education funding
According to a report from Representative Todd Stephens office, Wellsboro Area School District receives 39.3% of its annual revenue from the state.[244][245]
For the 2015-16 school year, Governor Tom Wolf released a partial Basic Education Funding (BEF) of $2,811,980 to the Wellsboro Area School District, in January 2016.[246] This was part of $10.3 billion in school funding withheld from the public schools, by the Governor since the summer of 2015.[247] The dispersement did not follow the new Basic Education Fair Funding formula which had been established by the Pennsylvania General Assemby in June 2015.[248][249][250]
For the 2014-15 school year, Wellsboro Area School District received $5,786,210 in State Basic Education funding. The District also received $174,510 in new Ready To Learn Block grant. The State’s enacted Education Budget includes $5,526,129,000 for the 2014-2015 Basic Education Funding.[251] The Education budget also included Accountability Block Grant funding at $100 million and $241 million in new Ready to Learn funding for public schools that focus on student achievement and academic success. The State paid $500.8 million to Social Security on the school employees behalf and another $1.16 billion to the state teachers pension system (PSERS). In total, Pennsylvania’s Education budget for K-12 public schools is $10 billion. This was a $305 million increase over 2013-2014 state spending and the greatest amount ever allotted by the Commonwealth for its public schools.[252]
For the 2013-14 school year, Wellsboro Area School District received a 1.6% increase or $5,786,792 in Pennsylvania Basic Education Funding (BEF). This is $88,901 more than its 2012-13 state BEF to the District. Additionally, Wellsboro Area School District received $90,977 in Accountability Block Grant funding to focus on academic achievement and level funding for special education services. Among the public school districts in Tioga County, Wellsboro Area received the highest percentage increase in BEF. The District has the option of applying for several other state and federal grants to increase revenues. The Commonwealth’s budget increased Basic Education Funding statewide by $123 million to over $5.5 billion. Most of Pennsylvania’s 500 public school districts received an increase of Basic Education Funding in a range of 0.9% to 4%. Eight public school districts received exceptionally high funding increases of 10% to 16%. The highest increase in state funding was awarded to Austin Area School District which received a 22.5% increase in Basic Education Funding.[253] The state funded the PSERS (Pennsylvania school employee pension fund) with $1,017,000,000 and Social Security payments for school employees of $495 million.[254]
For the 2012-13 school year, the Wellsboro Area School District received $5,788,868 in state funding.[255] The Governor's Executive Budget for 2012-2013 includes $9.34 billion for kindergarten through 12th grade public education, including $5.4 billion in basic education funding, which was an increase of $49 million over the 2011-12 budget. The state also provides $100 million for the Accountability Block grant. Wellsboro Area School District received $90,977 in Accountability Block Grant funding to focus on academic achievement. The state also provided $544.4 million for School Employees’ Social Security and $856 million for School Employees’ Retirement fund called PSERS.[256] This amount is a $21,823,000 increase (0.34%) over the 2011-2012 appropriations for Basic Education Funding, School Employees' Social Security, Pupil Transportation, Nonpublic and Charter School Pupil Transportation. Since taking office, Corbett’s first two budgets have restored more than $918 million in support of public schools, compensating for the $1 billion in federal stimulus dollars lost at the end of the 2010-11 school year.
In 2011-12, Wellsboro Area School District received a $5,697,891 allocation, of state Basic Education Funding.[257][258] Additionally, Wellsboro Area School District received $90,978 in Accountability Block Grant funding. The enacted Pennsylvania state Education budget included $5,354,629,000 for the 2011-2012 Basic Education Funding appropriation. This amount was a $233,290,000 increase (4.6%) over the enacted State appropriation for 2010-2011.[259] The highest increase in state basic education funding was awarded to Duquesne City School District, which got a 49% increase in state funding for 2011-12.[260] In 2010, Wellsboro Area School District reported that 584 students received free or reduced-price lunches, due to the family meeting the federal poverty level.[261]
For the 2010-2011 school year, the state provided Wellsboro Area School District a 2% increase in state Basic Education Funding for $6,087,259. Among Tioga County public school districts, the highest increase went to Southern Tioga School District which received a 3.23% increase. In the Commonwealth, the highest increase went to Kennett Consolidated School District in Chester County which was given a 23.65% increase in state Basic Education Funding.[262]
In the 2009-2010 budget year, the Commonwealth of Pennsylvania provided a 4.74% increase in Basic Education Funding for a total of $5,967,902 to Wellsboro Area School District. The District also received supplemental funding for: Title I (federal funding for low-income students), for district size, a poverty supplement from the Commonwealth and more. In Pennsylvania, the highest state funding increase was 22% to Muhlenberg School District.[263] The amount of increase each school district received was set by Governor Edward G. Rendell and the Secretary of Education Gerald Zahorchak, as a part of the state budget proposal given each February.[264]
In 2008-09 school year, the state Basic Education funding to the Wellsboro Area School District was $5,697,891.20. According to the Pennsylvania Department of Education, 679 students received free or reduced-price lunches due to low family income in the 2007-08 school year.[265]
Accountability Block Grants
Beginning in 2004-05, the state launched the Accountability Block Grant school funding. This program has provided $1.5 billion to Pennsylvania’s school districts. The Accountability Block Grant program requires that its taxpayer dollars are focused on specific interventions that are most likely to increase student academic achievement. These interventions include: teacher training, all-day kindergarten, lower class size K-3rd grade, literacy and math coaching programs that provide teachers with individualized job-embedded professional development to improve their instruction, and before or after school tutoring assistance to struggling students. For 2010-11, the District applied for and received $246,936 in addition to all other state and federal funding. The District used the funding to provide full-day kindergarten for the previous 5 years.[266]
Ready to Learn grant
Beginning in the 2014-15 budget, the State funded a new Ready to Learn Grant for public schools. A total of $100 million is allocated through a formula to districts based on the number of students, level of poverty of community as calculated by its market value/personal income aid ratio (MV/PI AR) and the number of English language learners. Ready to Learn Block Grant funds may be used by the Districts for: school safety; Ready by 3 early childhood intervention programs; individualized learning programs; and science, technology, engineering and math (STEM) programs.[267]
Wellsboro Area School District received $174,510 in Ready to Learn Grant dollars in addition to State Basic Education funding, Special Education funding, PreK Counts funding, transportation reimbursement, reimbursement for Social Security payments for employees and other state grants which the district must apply to receive.
Classrooms for the Future
The Classroom for the Future state program provided districts with hundreds of thousands of extra state funding to buy laptop computers for each core curriculum high school class (English, Science, History, Math) and paid for teacher training to optimize the computers use. The program was funded from 2006 to 2009. Wellsboro Area School District was denied funding by the Pennsylvania Department of Education, in 2006-07. In 2007-08, the District received $161,987. The District received $45,413 in 2008-09.[268][269] Among the public school districts in Tioga County, the highest award was given to Southern Tioga School District which received $514,344. The highest funding statewide was awarded to Philadelphia City School District in Philadelphia County - $9,409,073. The grant program was discontinued by Governor Edward Rendell as part of his 2009-10 state education budget.
Education Assistance grant
The state's EAP funding provides for the continuing support of tutoring services and other programs to address the academic needs of eligible students. Funds are available to eligible school districts and full-time career and technology centers (CTC) in which one or more schools have failed to meet at least one academic performance target, as provided for in Section 1512-C of the Pennsylvania Public School Code. In 2010-11 the Wellsboro Area School District did not apply for funding.[270]
Other grants
The Wellsboro Area School District did not participate in: Pennsylvania Department of Environmental Protection's Environmental Education annual grants; PA Science Its Elementary grants (discontinued effective with 2009-10 budget by Governor Rendell); 2012 Striving Readers Comprehensive Literacy grant; 2012 and 2013 Pennsylvania Hybrid Learning Grants;[271] Project 720 High School Reform grants[272] (discontinued effective with 2011-12 budget); nor the federal 21st Century Learning grants.
Federal grants
Wellsboro Area School District received $1,314,561 in ARRA - Federal Stimulus money to be used in specific programs like special education and meeting the academic needs of low-income students.[273] This was in addition to a regular annual state and federal funding. The funding was limited to the 2009-10 and 2010-2011 school years.[274] Due to the temporary nature of the funding, schools were repeatedly warned to use the funds for one-time expenditures like acquiring equipment, making repairs to buildings, training teachers to provide more effective instruction or purchasing books and software.
Race to the Top Grant
Wellsboro School District officials did not apply for the Race to the Top federal grant which would have brought the district hundreds of thousands to one million additional federal dollars for improving student academic achievement.[275] Participation required the administration, the school board and the local teachers' union to sign an agreement to prioritize improving student academic success.[276] In Pennsylvania, 120 public school districts and 56 charter schools agreed to participate.[277] Pennsylvania was not approved for the grant. According to then Governor Rendell, failure of districts to agree to participate was cited as one reason that Pennsylvania was not approved.[278]
Title II grants
The Federal government provides annual grants to schools to be used to improve the quality of teacher instructions to pupils. The goal is to provide each child in public schools with “Highly Quality” teachers and principals as defined by the state.[279] The funds are sent to the state Department of Education which distributes them to each school district and charter school.[280] Beginning in 2002, the federal funding committed to Title II was $3,175,000,000.
Public school district administrations must apply to the state annually for the Title II funds. In 2012-13, Wellsboro Area School District received $81,022 in federal Title II funding.[281] In 2014-15, Wellsboro Area School District applied for and received $75,424.[282]
English language learners grant
The Federal government provides annual grants to schools to assist in educating immigrant children and children who are identified as limited English proficient.[283] Upon registering for school a language survey is done for all new enrollment pupils, typically in kindergarten or preschool. They identify the primary language spoken at home. This data is collected and submitted to the Pennsylvania Department of Education, which in turn notifies the federal government.[284]
In 2012-13, Wellsboro Area School District received $272 in Title III funding for English language learners.[285] For 2014-15, Wellsboro Area School District received $285 in Title III funding.[286]
School Improvement Grant
In the summer of 2011, the Wellsboro Area School District administration was again notified that the Rock Butler Middle School qualified for School Improvement Grant funding, from the federal government (over $9.9 million available). The middle school was eligible for funding due to chronic low achievement. The grant stipulates the funds be used for improving student achievement using one of four federally dictated strategies. The strategies are: transformation, turnaround, restart with new faculty and administration or closure of failing schools.[287] The Pennsylvania Education Secretary awarded $66 million to reform Pennsylvania's lowest-achieving schools in August 2011. The funding is for three years.[288]
For the 2010-11 school year, Wellsboro Area School District administration did not apply for a School Improvement Grant. It was eligible for funding due to the chronic, low achievement at the Butler Middle School.[289] In 2011-12 the District was also eligible for School Improvement Grant funding due to the School Improvement II status of the middle school. The Administration did not participate in the funding opportunity.
In 2010, Pennsylvania received $141 million from the federal –US Department of Education, to turn around its worst-performing schools. The funds were disbursed via a competitive grant program.[290] The Pennsylvania Department of Education has identified 200 Pennsylvania schools as "persistently lowest-achieving," making them eligible for this special funding.[291] Pennsylvania required low performing schools to apply or provide documentation about why they had not applied. The funds must be used, by the district, to turn around schools in one of four ways: school closure, restart - close the school and reopen it as a charter school. The other two options involve firing the principal. One would require at least half the faculty in a chronically poor performing school be dismissed. The second involves intensive teacher training coupled with strong curriculum revision or a longer school day.[292]
Wellness fitness grant
Wellsboro Area School District was awarded a $342,457 federal grant in 2010, for its Wellsboro Fitness for Life program to reform and develop physical education (PE) and nutrition programs that are in alignment with the Pennsylvania Academic Standards for Health, Safety and PE and to address gaps identified in the School Health Index self-assessment. The level of reform required for the district to go from sports-center PE to a fitness-centered focus with nutrition elements requires a system wide, coordinated approach to include fitness and nutrition assessments, equipment, curriculum, professional development, evaluations, and extensive community partnership support. The primary goal of the program is to help students achieve lifelong fitness and health habits, the school district plans a comprehensive, integrated program providing state-of-the-art fitness equipment, consistent fitness assessments, student fitness planning and portfolio development, daily physical activities meeting all student interests, and providing nutritional information, activities, with active monitoring of individual dietary improvement plans; improved curriculum; and staff development opportunities.[293]
Common Cents state initiative
The Wellsboro Area School Board did not participate in the Pennsylvania Department of Education Common Cents program. The program called for the state to audit the district, at no cost to local taxpayers, to identify ways the district could save tax dollars.[294] After the review of the information, the district was not required to implement the recommended cost savings changes.
Real estate taxes
In 2016, Wellsboro Area School Board set real estate taxes at 17.8440 mills for residents in Tioga County. District residents living in Lycoming County had property taxes set at 13.7570 mills.[295] A mill is $1 of tax for every $1,000 of a property's assessed value. Property taxes, in the Commonwealth of Pennsylvania, apply only to real estate - land and buildings. The property tax is not levied on cars, business inventory, or other personal property. Certain types of property are exempt from property taxes, including: places of worship, places of burial, private social clubs, charitable and educational institutions and government property. Additionally, service related, disabled US military veterans may seek an exemption from paying property taxes. Unlike other states, under Pennsylvania state tax policy, natural gas and oil pipelines are exempted from property taxes.[296] There are a plethora of gas pipelines in the District due to marcellus shale gas development.[297] Pipeline companies prohibit development within the 100 foot wide right-of-way, there by limiting future development options for the landowner. This limits future potential property tax revenues for the school district, by constraining future land development.
Pennsylvania school district revenues are dominated by two main sources: 1) Property tax collections, which account for the vast majority (between 75-85%) of local revenues; and 2) Act 511 tax collections, which are around 15% of revenues for school districts.[298] Irregular property reassessments have become a serious issue in the commonwealth as it creates a significant disparity in taxation within a community and across a region. The school district includes municipalities in two counties, each of which has different rates of property tax assessment, necessitating a state board equalization of the tax rates between the counties.[299] In 2010, miscalculations by the board were widespread in the Commonwealth and adversely impacted funding for many school districts.[300]
- 2015-16 - 17.8120 mills in Tioga County. District residents living in Lycoming County - 13.9840 mills.[301]
- 2014-15 - 17.4100 mills in Tioga County and Lycoming County 13.6200 mills
- 2013-14 - 17.0063 mills in Tioga County and Lycoming County 13.7971 mills.[302]
- 2012-13 - 16.7545 mills in Tioga County and Lycoming County 13.6498 mills[303]
- 2011-12 - 16.3806 mills in Tioga County. Lycoming County 14.2833 mills.[304]
- 2010-11 - 16.0827 mills in Tioga County. Lycoming County 14.2752 mills.[305]
- 2009-10 - 15.4430 mills in Tioga County. Lycoming County 14.6757 mills.[306]
- 2008-09 - 15.4435 mills in Tioga County. Lycoming County 14.6984 mills.[307]
- 2007-08 - 15.0420 mills in Tioga County. Lycoming County 13.8570 mills.[308]
- 2006-07 - 14.6500 mills in Tioga County. Lycoming County 13.0400 mills.[309]
- 2005-06 - 13.9700 mills in Tioga County. Lycoming County 12.5700 mills.[310]
According to a report prepared by the Pennsylvania Department of Education, the total real estate taxes collected by all school districts in Pennsylvania rose from $6,474,133,936 in 1999-00 to $10,438,463,356 in 2008-09.[311] The average yearly property tax paid by Tioga County residents amounts to about 3.44% of their yearly income. Tioga County is ranked 401st of the 3143 United States counties for property taxes as a percentage of median income.[312] Pennsylvania's 2011 tax burden of 10.35% ranked 10th highest out of 50 states. The tax burden was above the national average of 9.8%. Pennsylvania's taxpayers paid $4,374 per capita in state and local taxes, including school taxes.[313]
Act 1 Adjusted index
The Act 1 of 2006 Index regulates the rates at which each school district can raise property taxes in Pennsylvania. Districts are not allowed to raise taxes above that index unless they allow voters to vote by referendum, or they seek an exception from the state Department of Education. The base index for the 2011-2012 school year is 1.4 percent, but the Act 1 Index can be adjusted higher, depending on a number of factors, such as property values and the personal income of district residents. Act 1 included 10 exceptions, including: increasing pension costs, increases in special education costs, a catastrophe like a fire or flood, increase in health insurance costs for contracts in effect in 2006 or dwindling tax bases. The base index is the average of the percentage increase in the statewide average weekly wage, as determined by the PA Department of Labor and Industry, for the preceding calendar year and the percentage increase in the Employment Cost Index for Elementary and Secondary Schools, as determined by the Bureau of Labor Statistics in the U.S. Department of Labor, for the previous 12-month period ending June 30. For a school district with a market value/personal income aid ratio (MV/PI AR) greater than 0.4000, its index equals the base index multiplied by the sum of .75 and its MV/PI AR for the current year.[314] In June 2011, the Pennsylvania General Assembly eliminated six of the ten the exceptions to the Act 1 Index.[315] The following exceptions were maintained: 1) costs to pay interest and principal on indebtedness incurred prior to September 4, 2004 for Act 72 schools and prior to June 27, 2006 for non-Act 72 schools; 2) costs to pay interest and principal on electoral debt; 3) costs incurred in providing special education programs and services (beyond what is already paid by the State); and 4) costs due to increases of more than the Index in the school’s share of payments to PSERS (PA school employees pension fund) taking into account the state mandated PSERS contribution rate.[316][317] The legislature also froze the payroll amount public school districts use to calculate the pension-plan exception at the 2012 payroll levels. Further increases in payroll cannot be used to raise the district’s exception for pension payments. A specific timeline for Act I Index decisions is published annually, by the Pennsylvania Department of Education.[318]
The School District Adjusted Index for the Wellsboro Area School District 2006-2007 through 2011-2012.[319]
|
For the 2016-17 budget year', Wellboro Area School Board did not apply for any exceptions to exceed the District's Act 1 Index limit.[327] Statewide 299 school districts adopted a resolution to not exceed their Act I index in 2016-17.
For the 2015-16 budget year, Wellsboro Area School Board applied for two exceptions to exceed their Act 1 Index limit: for special education cost and for its rapidly rising teacher pension costs. For the school budget 2015-16, 310 Pennsylvania public school districts adopted a resolution certifying that tax rates would not be increased above its Act 1 Index limit. Another 187 school districts adopted a preliminary budget leaving open the option of exceeding the Index limit. Regarding the pension costs exception, 172 school districts received approval to exceed the Index limit in full, while others received a partial approval of their request. For special education costs, 119 districts received approval to exceed their tax limit. No Pennsylvania public school districts received an approval for the grandfathered construction debts exception.[328]
For the 2014-15 budget year, Wellsboro Area School Board did not apply for exceptions to exceed their Act 1 Index limit. In 2014-15, all Pennsylvania school districts were required to make a 21.4% of payroll payment to the teacher’s pension fund (PSERS).[329] For the school budget 2014-15, 316 Pennsylvania public school districts adopted a resolution certifying that tax rates would not be increased above its Act 1 Index limit. Another 181 school districts adopted a preliminary budget leaving open the option of exceeding the Index limit. Districts may apply for multiple exceptions each year. For the pension costs exception, 163 school districts received approval to exceed the Index in full, while others received a partial approval of their request. For special education costs, 104 districts received approval to exceed their tax limit. Seven Pennsylvania public school districts received an approval for the grandfathered construction debts exception.[330]
For the 2013-14 budget year, Wellsboro Area School Board did not apply for exceptions to exceed their Act 1 Index limit. For the school budget year 2013-14, 311 Pennsylvania public school districts adopted a resolution certifying that tax rates would not be increased above their index. Another 171 school districts adopted a preliminary budget leaving open the option of exceeded the Index limit. For the exception for pension costs, 89 school districts received approval to exceed the Index in full while others received a partial approval of their request. For special education costs, 75 districts received approval to exceed their tax limit. For the pension costs exception, 169 school districts received approval to exceed the Index. Eleven Pennsylvania public school districts received an approval for grandfathered construction debts.[331]
For the 2012-13 budget year, Wellsboro Area School Board did not apply for exceptions to exceed the Act 1 Index. For 2012-2013, 274 Pennsylvania public school districts adopted a resolution certifying that tax rates would not be increased above their index; 223 school districts adopted a preliminary budget leaving open the option of exceeded the Index limit. For the exception for pension costs, 194 school districts received approval to exceed the Index. For special education costs, 129 districts received approval to exceed the tax limit. For the exception for pension costs, 194 school districts received approval to exceed the Index. For special education costs, 129 districts received approval to exceed the tax limit.[332]
For the 2011-12 school year, the Wellsboro Area School Board applied for several exceptions to exceed the Act 1 Index. This included: Pension costs, Maintenance of Selected Revenue and Maintenance of Local Tax Revenue. Each year the Wellsboro Area School Board has the option of adopting either 1) a resolution in January certifying they will not increase taxes above their index or 2) a preliminary budget in February. A school district adopting the resolution may not apply for referendum exceptions or ask voters for a tax increase above the inflation index. A specific timeline for these decisions is publisher each year by the Pennsylvania Department of Education.[333]
According to a state report, for the 2011-2012 school year budgets, 247 school districts adopted a resolution certifying that tax rates would not be increased above their index; 250 school districts adopted a preliminary budget. Of the 250 school districts that adopted a preliminary budget, 231 adopted real estate tax rates that exceeded their index. Tax rate increases in the other 19 school districts that adopted a preliminary budget did not exceed the school district’s index. Of the districts who sought exceptions 221 used the pension costs exemption and 171 sought a Special Education costs exemption. Only 1 school district sought an exemption for Nonacademic School Construction Project, while 1 sought an exception for Electoral debt for school construction.[334] In June 2011, the Commonwealth's General Assembly passed an Omnibus Education Bill House Bill 1326 which repealed several Act 1 Index exceptions except: pension costs, special education costs and building costs that have already been approved by voter referendum.[335]
In 2010-11, the Wellsboro Area School Board did not apply for an exception to exceed the index.[336] In the Spring of 2010, 135 Pennsylvania school boards asked to exceed their adjusted index. Approval was granted to 133 of them and 128 sought an exception for pension costs increases.[337]
Property tax Relief
In 2014, Wellsboro Area School District approved 3,122 homestead properties to receive $121 in tax relief.[338] The increase in the amount was related to fewer residents applying for tax relief. By law, the amount received by the District must be divided equally among all approved residences.[339]
In 2011, the property tax relief was set at $119 for the 3,174 eligible properties that applied. In 2009, the Homestead/Farmstead Property Tax Relief from gambling, for the Wellsboro Area School District, was $123 per approved permanent primary residence. In the district, 3088 property owners applied for the tax relief. The relief was subtracted from the total annual school property tax bill. Property owners apply for the relief through the county Treasurer's office. Farmers can qualify for a farmstead exemption on building used for agricultural purposes. The farm must be at least 10 contiguous acres and must be the primary residence of the owner. Farmers can qualify for both the homestead exemption and the farmstead exemption.[340]
Enrollment
Enrollment in Wellsboro Area School District is projected to decline by 100 students by 2015. Over the next 10 years, rural Pennsylvania school enrollment is projected to decrease 8 percent. The most significant enrollment decline is projected to be in western Pennsylvania, where rural school districts may have a 16 percent decline.[341] As the enrollment declines, per pupil administrative costs of the schools will continue to rise. A study of Pennsylvania public school spending, conducted by Standard and Poor's, examined the consolidation of Wellsboro Area School Administration with neighboring Galeton Area School District. The study found that consolidation of the school's central administration with Galeton Area school district would achieve a $3 million administrative cost savings in the new district.[342]
In March 2011, the Pennsylvania Institute of Certified Public Accountants released a report finding that the state would save hundreds of millions of tax dollars, by cutting the number of school administrations in half through consolidation, with no impact on programs offered to students.[343]
Pennsylvania has one of the highest numbers of pupil school districts in the nation. In Pennsylvania, 80% of the school districts serve student populations under 5,000, and 40% serve less than 2,000. Less than 95 of Pennsylvania's 501 school districts have enrollment below 1250 students, in 2007.[344] This results in excessive school administration bureaucracy and not enough course diversity.[345] In a survey of 88 superintendents of small districts, 42% of the 49 respondents stated that they thought consolidation would save money without closing any schools.[346]
Extracurriculars
Wellsboro Area School District offers an extensive extracurricular program, including clubs, arts and interscholastic athletics program. Eligibility to participate is determined by school board policy. The sports programs are through the Northern Tier League, consisting of High Schools in Tioga, Bradford and Lycoming Counties.
By Pennsylvania law, all K-12 students in the district, including those who attend a private nonpublic school, cyber charter school, charter school and those home schooled, are eligible to participate in the extracurricular programs, including all athletics. They must meet the same eligibility rules as the students enrolled in the district's schools.[347]
According to PA Child Abuse Recognition and Reporting Act 126 of 2014, all volunteer coaches and all those who assist in student activities, must have criminal background checks. Like all school district employees, they must also attend an anti child abuse training once every three years.[348][349][350]
According to PA Child Abuse Recognition and Reporting Act 126 of 2014, all volunteer coaches and all those who assist in student activities, must have criminal background checks. Like all school district employees, they must also attend an anti child abuse training once every three years.[348][349][350]
Sports
Coaches receive compensation as outlined in the teachers' union contract. When athletic competition exceeds the regular season, additional compensation is paid.[351] According to Pennsylvania’s Safety in Youth Sports Act, all sports coaches, paid and volunteer, are required to annually complete the Concussion Management Certification Training and present the certification before coaching.[352][353]
Wellsboro Area School District provides its athletics disclosure form on its web site.[354] Article XVI-C of the Public School Code requires the disclosure of interscholastic athletic opportunities for all public secondary school entities in Pennsylvania. All school entities with grades 7-12 are required to annually collect data concerning team and financial information for all male and female athletes beginning with the 2012-13 school year and submit the information to the Pennsylvania Department of Education. Beginning with the 2013-14 school year, all non-school (booster club and alumni) contributions and purchases must also be reported to PDE.[355]
The District funds:
|
|
- Middle School Sports
|
|
According to PIAA directory July 2015 [356]
References
- ↑ NCES, Common Core of Data - Wellsboro Area School District, 2013
- ↑ National Center for Education Statistics, Common Core of Data - Wellsboro Area School District, 2010
- ↑ Pennsylvania Department ofEducation (2015). "Wellsboro Area School District Fast Facts 2015".
- ↑ Pennsylvania Department of Education, Enrollment and projections by LEA, July 2010
- ↑ Pennsylvania Department of Education, Enrollment by LEA, July 2013
- ↑ PDE, Enrollment Public Schools by LEA, 2015
- ↑ Wellsboro Area School Board, Wellsboro Area School District Budget Report 2016-17, June 2016
- ↑ Wellsboro Area School District Administration (2015). "Wellsboro Area School District Budget Report 2015" (PDF).
- ↑ Wellsboro Area School District Administration (June 12, 2013). "Wellsboro Area School District Budget Report" (PDF).
- ↑ Clarke, Cheryl, Wellsboro school district’s deficit now below $200,000, Sun-Gazette, March 14, 2012
- ↑ BRYAN G. ROBINSON (June 29, 2011). "Wellsboro Area School Board OKs 1.8 percent tax hike". Sun-Gazette.
- ↑ Wellsboro Area School District Administration (June 9, 2010). "Wellsboro Area School District Budget report" (PDF).
- ↑ US Census Bureau, 2010 Census Poverty Data by Local Educational Agency, 2011
- ↑ proximityone (2014). "School District Comparative Analysis Profiles".
- ↑ Pennsylvania Budget and Policy Center, Education Facts Student Poverty Concentration by LEA, 2012
- ↑ American fact Finder, US Census Bureau, 2009
- ↑ US Census Bureau (2014). "Pennsylvania Median household income, 2006-2010 by County".
- ↑ US Census Bureau (2010). "American Fact Finder, State and County quick facts".
- ↑ US Census Bureau (September 2011). "Income, Poverty, and Health Insurance Coverage in the United States: 2010" (PDF).
- ↑ Michael Sauter & Alexander E.M. Hess, (August 31, 2013). "America's most popular six-figure jobs". USA Today.
- ↑ Jeff Guo (September 15, 2015). "Lower wages for whites, higher wages for immigrants, and inequality for all". Washington Post.
- ↑ Wellsboro Area School Administration (2015). "WASD Online Academy".
- ↑ Pennsylvania Public School Code Governance 2010
- ↑ US Department of Education (2015). "Every Student Succeeds Act".
- ↑ Pennsylvania General Assembly (2012). "Act of Jul. 12, 2012, P.L. 1142, No. 141 Section 921-A".
- ↑ Pennsylvania General Assembly, Pennsylvania School Code, 2013
- ↑ Pennsylvania General Assembly (2012). "Act of Jul. 12, 2012, P.L. 1142, No. 141".
- ↑ Wellsboro Area School District Administration (2015). "WASD DISTRICT GOALS 2015-2016".
- ↑ The Commonwealth Foundation for Public Policy Alternatives. "The Pennsylvania Project". Retrieved May 20, 2010.
- ↑ Pittsburgh Business Times (April 10, 2015). "Guide to Pennsylvania Schools Statewide School District Ranking 2015".
- 1 2 Pittsburgh Business Times (April 30, 2010). "Statewide Honor Roll Rankings".
- ↑ "Statewide Honor Roll Rankings 2013". Pittsburgh Business Times. April 5, 2013.
- ↑ Paul Jablow (November 18, 2015). "Understanding the PSSA exams". The Notebook.
- ↑ Pittsburgh Business Times (April 11, 2014). "Western Pennsylvania School Guide 2014".
- ↑ Pittsburgh Business Times (April 5, 2013). "Guide to Pennsylvania Schools Statewide ranking 2013".
- ↑ Pittsburgh Business Times, Statewide Honor Roll Rankings 2012, April 4, 2012
- ↑ Pittsburgh Business Times (April 1, 2011). "State wide Honor Roll".
- ↑ Pittsburgh Business Times (May 23, 2008). "Pennsylvania Public School Rankings".
- ↑ Pittsburgh Business Times, Statewide Overachivers Ranking Information, April 4, 2013
- ↑ "Overachiever statewide ranking". Pittsburgh Business Times. May 6, 2010.
- ↑ Liz Hayes & Jody Weigand (July 13, 2011). "New Kensington-Arnold 'flagged' for test scores". TribLIVE.
- ↑ Karen Graham and Dylan Purcell., PSSA-cheating reforms yield lower scores across Pa., Philadelphia inquirer, July 30, 2012
- ↑ Eleanor Chute & Mary Niederberger (September 9, 2012). "Inquiry continues into cheating on PSSA tests". Pittsburgh Post Gazette.
- ↑ USA Today (July 13, 2011). "Pa. looking into possible cheating on state tests".
- ↑ Data Recognition Corporation (July 2009). "Data Forensics Technical Report" (PDF).
- ↑ Ben Herold (July 15, 2011). "List of 89 Pa. schools to be investigated". the Notebook.
- ↑ Education Week (January 13, 2012). "28 Pa. Districts and Charters Cleared of Cheating".
- ↑ Pennsylvania Department of Education (September 21, 2012). "Wellsboro Area School District AYP status".
- ↑ Pennsylvania Department of Education, Pennsylvania Public School District AYP History, 2011
- ↑ Pennsylvania Department of Education, Pennsylvania District AYP History 2003-2010, 2011
- ↑ PDE, AYP History by LEA 2003-2011, 2012
- ↑ US Department of Education (2003). "NCLB Parental Notices".
- ↑ Pennsylvania Department of Education (November 4, 2015). "Wellsboro Area High School School Performance Report 2015".
- ↑ Pennsylvania Department of Education (October 4, 2013). "Wellsboro Area High School School Performance Report 2013".
- ↑ Pennsylvania Department of Education (September 21, 2012). "Wellsboro Area High School Report Card 2012" (PDF).
- ↑ Pennsylvania Department of Education, Wellsboro Area High School Report Card 2011, September 29, 2011
- ↑ Pennsylvania Department of Education (March 15, 2011). "New 4-year Cohort Graduation Rate Calculation Now Being Implemented".
- ↑ Pennsylvania Department of Education (2010). "Wellsboro Area High School Report Card 2010" (PDF).
- ↑ Pennsylvania Department of Education (2009). "Wellsboro Area High School Academic Report Card 2009".
- ↑ Pennsylvania Partnerships for Children (2007). "High School Graduation" (PDF).
- ↑ Pennsylvania Department of Education (November 4, 2015). "Wellsboro Area High School Fast Facts 2015".
- ↑ US News and World Report, Best High Schools, 2015
- ↑ National Center for Education Statistics, Common Care Data - Wellsboro Area High School, 2010
- ↑ Pennsylvania Department of Education, Professional Qualifications of Teachers High School, September 29, 2011
- ↑ Pennsylvania Department of Education (November 4, 2015). "Wellsboro Area High School School Performance Profile 2015".
- ↑ Jan Murphy (November 4, 2015). "Report card for state's high schools show overall decline". Pennlive.com.
- ↑ Pennsylvania Department of Education (November 4, 2015). "2015 Keystone Exam School Level Data".
- ↑ Pennsylvania Department of Education (November 6, 2014). "Wellsboro Area High School Academic Performance Data 2014".
- ↑ Evamarie Socha (November 6, 2014). "Half of Valley districts see state test scores decline". The Daily Item.
- ↑ By Eleanor Chute (November 21, 2014). "Pennsylvania student scores declined with reduced funding, test results show". Pittsburgh Post-Gazette.
- ↑ Pennsylvania Department of Education (October 4, 2013). "Wellsboro Area High School Academic Performance Data 2013".
- ↑ Pennsylvania Department of Education (September 21, 2012). "Wellsboro Area High School AYP Overview 2012".
- ↑ Pennsylvania Department of Education, Wellsboro Area High School AYP Overview 2011, September 21, 2012
- ↑ Pennsylvania Department of Education, Wellsboro Area High School AYP history 2003-2011, 2012
- 1 2 Pennsylvania Department of Education (2014). "State Academic Standards".
- ↑ Pennsylvania Department of Education (2014). "State Assessment System".
- ↑ Pennsylvania Department of Education (September 29, 2012). "2011-2012 PSSA and AYP Results".
- ↑ Pennsylvania Department of Education (September 29, 2011). "2010-2011 PSSA and AYP Results".
- ↑ Pennsylvania Department of Education (2010). "2009-2010 PSSA and AYP Results".
- ↑ Scranton Times Tribune (2009). "2009 PSSA RESULTS Wellsboro Area SD".
- ↑ Pennsylvania Department of Education (August 2008). "2007-2008 PSSA and AYP Results".
- ↑ Pennsylvania Department of Education (2007). "PSSA Math and Reading results".
- 1 2 Pittsburgh Post Gazette (October 15, 2012). "How is your school doing?".
- ↑ Pennsylvania Department of Education, Wellsboro High School Academic Achievement Report Card 2010, November 14, 2011
- ↑ Pennsylvania Department of Education, Wellsboro High School Academic Achievement Report Card 2010, October 20, 2010
- ↑ Pennsylvania Department of Education (2009). "2009 PSSAs: Reading, Math, Writing and Science Results".
- ↑ Pennsylvania Department of Education, Wellsboro Area High School Academic Achievement Report Card 2008, August 15, 2008
- ↑ Pennsylvania Department of Education (September 21, 2012). "Wellsboro Area High School Academic Achievement Report Card 2012" (PDF).
- ↑ Pennsylvania Department of Education (September 29, 2011). "2010-2011 PSSA results in Science".
- ↑ The Pennsylvania Basic Education/Higher Education Science and Technology Partnership, Science in Motion annual report, 2012
- ↑ Wellsboro Area School District Administration (November 2009). "Wellsboro Area School District Strategic Plan Chapter 4 Academic Standards and Assessment,".
- ↑ Pennsylvania Code §4.24 (a) High school graduation requirements
- ↑ Wellsboro Area School District Administration (2010). "Graduation Project STANDARDS AND REGULATIONS MANUAL".
- ↑ Pennsylvania State Board of Education, Proposed changes to Chapter 4, May 10, 2012
- ↑ Pennsylvania Department of Education (2010). "Keystone Exam Overview" (PDF).
- ↑ Pennsylvania Department of Education (September 2011). "Pennsylvania Keystone Exams Overview".
- ↑ Pennsylvania State Board of Education (2010). "Rules and Regulation Title 22 PA School Code CH. 4".
- ↑ Associated Press (January 20, 2016). "State moves ahead with plan to delay Keystone Exams as graduation requirement".
- ↑ Pennsylvania Department of Education (2011). "Keystone Exams".
- ↑ Pennsylvania College Remediation Report
- ↑ National Center for Education Statistics
- ↑ Pennsylvania Department of Education (2010). "2010-2011 Dual Enrollment Guidelines".
- ↑ Pennsylvania Department of Education (March 2010). "Pennsylvania Transfer and Articulation Agreement.".
- ↑ Mansfield University Administration (2015). "Dual Enrollment Program".
- ↑ Pennsylvania College of Technology administration (2014). "Penn College NOW Dual Enrollment".
- ↑ PDE, School Performance profile, November 6, 2014
- ↑ Pennsylvania Department of Education (2014). "SAT and ACT Scores".
- ↑ College Board (2014). "2014 College-Bound Seniors State Profile Report" (PDF).
- ↑ College Board (2013). "The 2013 SAT Report on College & Career Readiness".
- ↑ Pennsylvania Department of Education (2011). "Public School SAT Scores 2011".
- ↑ College Board (September 2011). "SAT Scores State By State - Pennsylvania".
- ↑ "While U.S. SAT scores dip across the board, N.J. test-takers hold steady". NJ.com. September 2011.
- ↑ The Center for Rural Pennsylvania (August 2006). "SAT Scores and Other School Data".
- ↑ College Board (2014). "Exam Fees and Reductions: 2015".
- ↑ PDE, School Performance Profile - Academic Performance Data - Wellsboro Area High School, November 2015
- ↑ PDE, School Performance Profile - Academic Performance Data - Wellsboro Area High School, November 2014
- ↑ PDE, School Performance Profile - Academic Performance Data - Wellsboro Area High School, November 2013
- ↑ Pennsylvania Department of Education (November 4, 2015). "Rock Butler Middle School Fast Facts 2015".
- ↑ Pennsylvania Department of Education, Professional Qualifications of Teachers Rock Butler Middle School, November 5, 2015
- ↑ National Center for Education Statistics, Common Core Data – Rock L Butler Middle School, 2012
- ↑ Pennsylvania Department of Education, Professional Qualifications of Teachers Rock L Butler Middle School, September 21, 2012
- ↑ National Center of Education Statistics, Common Core of Data - Rock L Butler Middle School, 2010
- ↑ Pennsylvania Department of Education (October 1, 2015). "2015 PSSA School Level Data".
- ↑ Pennsylvania Department of Education (October 1, 2015). "2015 PSSA State Level Data".
- ↑ Pennsylvania Department of Education (November 6, 2014). "Rock Bulter Middle School Academic Performance Data 2014".
- ↑ Pennsylvania Department of Education (October 4, 2013). "Rock L. Butler Middle School Academic Performance Data 2013,".
- ↑ Pennsylvania Department of Education (September 21, 2012). "Rock L Butler Middle School AYP Overview 2012".
- ↑ Pennsylvania Department of Education (September 29, 2011). "ROCK L BUTLER Middle School AYP Overview 2011".
- ↑ Wellsboro Area School District Administration (August 23, 2011). "Rock L. Butler Middle School Notice of Public School Adequate Yearly Progress Public School Choice".
- ↑ Wellsboro Area School Board (2011). "Wellsboro Area School District Attendance Policy 204" (PDF).
- ↑ Pennsylvania Department of Education (2010). "ROCK L BUTLER Middle School AYP Overview".
- ↑ Pennsylvania Department of Education (2010). "Rock Butler Middle School - School AYP Data Table".
- ↑ PDE, Rock Bulter Middle School AYP status, August 2008
- ↑ Pennsylvania Department of Education. "IU16-PSSA 95-96 Results by School". Retrieved May 11, 2014.
- ↑ Pennsylvania Department of Education (2014). "Standards Aligned Systems".
- ↑ Pennsylvania Department of Education (2014). "State Academic Standards Mathematics".
- ↑ Pennsylvania Department of Education (September 29, 2011). "Rock L Butler Middle School Academic Achievement Report Card 2010" (PDF).
- ↑ Pennsylvania Department of Education (2010). "Rock L Butler Middle School Academic Achievement Report Card 2010" (PDF).
- ↑ Pennsylvania Department of Education, Rock L Butler Middle School Academic Achievement Report Card 2009, September 14, 2009
- ↑ Pennsylvania Department of Education, Rock L Butler Middle School Academic Achievement Report Card 2008, August 15, 2008
- ↑ Pennsylvania Department of Education, Rock L Butler Middle School Academic Achievement Report Card 2007, 2007
- ↑ Pennsylvania Department of Education (September 21, 2012). "Rock L Butler Middle School Academic Achievement Report Card 2012" (PDF).
- ↑ PSSA Scores by School Database 2009 - Wellsboro Area School District, The Times Tribune, June 27, 2010
- ↑ Pennsylvania Department of Education (2008). "The 2008 PSSA Science State Level Proficiency Results by Grade and State Total (Full Academic Year)".
- ↑ Pennsylvania Department of Education (2008). "PSSA Results Math and Reading School".
- ↑ Office of First Lady (September 2, 2014). "Pennsylvania First Lady and Acting Secretary of Education Announce 35 Schools Statewide Implementing Dropout Program".
- ↑ Pennsylvania Department of Education, The Early Warning System, 2014
- ↑ Pennsylvania Department of Education (November 4, 2015). "Don Gill Elementary School Fast Facts 2015".
- ↑ Pennsylvania Department of Education, School Performance Profile, Don Gill Elementary School Fast Facts, 2015
- ↑ National Center for Education Statistics, Common Core Data – Don Gill Elementary School, 2013
- ↑ Pennsylvania Department of Education, Professional Qualifications of Teachers Don Gill Elementary School, September 21, 2012
- ↑ National Center for Education Statistics, Common Care Data – Don Gill Elementary School, 2010
- 1 2 Pennsylvania Partnership for Children, Full-Day Kindergarten Enrollment, 2010
- ↑ Pennsylvania Department of Education (October 1, 2015). "2015 PSSA School Level Data".
- ↑ Pennsylvania Department of Education (October 1, 2015). "2015 PSSA State Level Data".
- ↑ Pennsylvania Department of Education (November 6, 2014). "Don Gill Elementary School Academic Performance Data 2014".
- ↑ Pennsylvania Department of Education (October 4, 2013). "Don Gill Elementary School Academic Performance Data 2013,".
- ↑ Pennsylvania Department of Education, (September 21, 2012). "Don Gill Elementary School AYP status Overview 2012".
- ↑ Pennsylvania Department of Education, Don Gill Elementary School School AYP Data Table, 2010
- ↑ Pennsylvania Department of Education, Don Gill Elementary School School AYP Overview 2010, October 2010
- ↑ Pennsylvania State Board of Education (2003). "PSSA results 2003".
- ↑ New America Foundation (2003). "No Child Left Behind Overview".
- ↑ The Goals of No Child Left Behind (July 20, 2010). "The Goals of No Child Left Behind".
- ↑ Learning Point Associates (2002). "Understanding the No Child Left Behind Act" (PDF).
- ↑ Pennsylvania State Board of Education (January 11, 2003). "Pennsylvania Academic Standards Science and Technology, Ecology and Environment".
- ↑ Pennsylvania Department of Education (2012). "Don Gill Elementary School Academic Achievement Report Card 2012" (PDF).
- ↑ Pennsylvania Department of Education, Don Gill Elementary School Academic Achievement Report Card 2011, September 29, 2011
- ↑ Pennsylvania Department of Education, Don Gill Elementary School Academic Achievement Report Card 2010, October 20, 2010
- 1 2 Pennsylvania Department of Education, Don Gill Elementary School Academic Achievement Report Card 2009, September 14, 2009
- ↑ Pennsylvania Department of Education, Don Gill Elementary School Academic Achievement Report Card 2008, August 15, 2008
- ↑ Pennsylvania Department of Education (November 4, 2015). "Charlotte Lappla Elementary School Fast Facts 2015".
- ↑ Pennsylvania Department of Education, Professional Qualifications of Teachers Charlotte Lappla Elementary School, November 5, 2015
- ↑ National Center for Education Statistics, Common Core Data Charlotte Lappla Elementary School, 2010
- ↑ "Wellsboro Area School Board Policy Student Wellness". June 13, 2006.
- ↑ Nutrition Standards for Competitive Foods in Pennsylvania Schools for the School Nutrition Incentive, Pennsylvania Department of Education — Division of Food and Nutrition. July 2008
- ↑ USDA, Child Nutrition Programs - Eligibility Manual for School Meals, 2012
- ↑ Pennsylvania Hunger Action Center, The Pennsylvania School Breakfast Report Card, 2009
- ↑ USDA, Child Nutrition Programs, June 27, 2013
- ↑ United States Department of Agriculture (2011). "Food and Nutrition Service Equity in School Lunch Pricing Fact Sheet" (PDF).
- ↑ Pennsylvania State Department of Health (2010). "Pennsylvania Bulletin Doc. No. 10-984 School Immunizations; Communicable and Noncommunicable Diseases".
- ↑ Pennsylvania Bureau of Special Education Services (2015). "Wellsboro Area School District Special Education Data Report LEA Performance on State Performance Plan (SPP) Targets".
- ↑ Pennsylvania Bureau of Special Education Services (2013). "Wellsboro Area School District Special Education Data Report LEA Performance on State Performance Plan (SPP) Targets".
- ↑ Pennsylvania Bureau of Special Education (2010). "Special Education Data Report LEA Performance on State Performance Plan (SPP) Targets School Year 2008-2009" (PDF).
- ↑ Wellsboro Area School District Administration (2011). "Special Education Annual Public Notice 2011".
- ↑ Gerald L. Zahorchak, D. Ed. (May 30, 2007). "House Education Committee Hearing on Governor's Proposed Increase for Accountability Block Grants Testimony for Gerald L. Zahorchak, D. Ed. Secretary, Pennsylvania Department of Education" (PDF).
- ↑ Pennsylvania Bureau of Special Education (2008). "Pennsylvania Parent Guide to Special Education Services".
- ↑ Pennsylvania Department of Education - School District Administration (January 2016). "Procedural Safeguards Notice".
- ↑ Pennsylvania Department of Education, Bureau of Special Education (September 2005). "Gaskin Settlement Agreement Overview Facts Sheet" (PDF).
- ↑ Pennsylvania Department of Education. "Pennsylvania Special Education Funding".
- ↑ Senator Patrick Browne (November 1, 2011). "Senate Education Committee Holds Hearing on Special Education Funding & Accountability".
- ↑ Pennsylvania Department of Education Amy Morton, Executive Deputy Secretary (November 11, 2011). "Public Hearing: Special Education Funding & Accountability Testimony".
- ↑ Baruch Kintisch Education Law Center (November 11, 2011). "Public Hearing: Special Education Funding & Accountability Testimony" (PDF).
- ↑ Pennsylvania Department of Education (July 2010). "Special Education Funding from Pennsylvania State_2010-2011".
- 1 2 Pennsylvania Department of Education (2011). "Special Education Funding 2011-2012 Fiscal Year".
- ↑ Pennsylvania Department of Education, Investing in PA kids, April 2012
- ↑ Pennsylvania Department of Education, Special Education funding report by LEA, July 2014
- ↑ Special Education Funding Reform Commission (December 11, 2015). "Special Education Funding Reform Commission Report" (PDF).
- ↑ Pennsylvania Department of Education (December 1, 2009). "Gifted Students as Percentage of Total Enrollment by School District/Charter School" (PDF).
- ↑ Pennsylvania Department of Education and Pennsylvania School Board. "CHAPTER 16. Special Education For Gifted Students". Retrieved February 4, 2011.
- ↑ Pennsylvania Department of Education (March 26, 2010). "Special Education for Gifted Students Notice of Parental rights" (PDF).
- ↑ Center for Safe Schools (2013). "Wellsboro Area School District School Safety Report 2013-14" (PDF).
- ↑ Commonwealth of Pennsylvania Safe School Center (2012). "Pennsylvania Safe Schools Online Reports".
- ↑ Safe & Responsive Schools Project (June 20, 2011). "Area high school students create anti-bullying mural". Williamsport Sun Gazette.
- ↑ Commonwealth of Pennsylvania Safe School Center (2009). "Pennsylvania Safe Schools Online Reports".
- ↑ Wellsboro School Board, Bullying/Cyberbullying Policy 249, January 13, 2009
- ↑ Pennsylvania General Assembly (2006). "Regular Session 2007–2008 House Bill 1067, Act 61 Section 6 page 8".
- ↑ Center for Safe Schools of Pennsylvania (2006). "Bullying Prevention advisory".
- ↑ Pennsylvania Department of Education (2012). "Bullying, Hazing, and Harassment Resources".
- ↑ Pennsylvania State Board of Education (January 11, 2003). "Pennsylvania Academic Standards Health, Safety and Physical Education".
- ↑ Pennsylvania General Assembly, Taxpayer Relief Act, Act 1 of the Special Session of 2006, June 27, 2006
- ↑ Pennsylvania Department of Education (2013). "Investing in Pennsylvania Students".
- ↑ "Wellsboro Area School District Payroll report 2013". OpenPA Gov.org. 2014.
- ↑ Times Tribune (June 16, 2013). "PA Teacher Profile Database 2011-12".
- ↑ Triblive News (2015). "Pennsylvania teacher salary search".
- ↑ Pennsylvania School Employees Retirement System (2014). "Your PSERS Benefits & Leaving Employment".
- 1 2 American Enterprise Institute, (2011). "Assessing the Compensation of Public School Teachers".
- ↑ Pennsylvania School Board Association (February 27, 2015). "Pension, PSERS Background Basics".
- ↑ PSERS Board of Trustees (2015). "Fiscal Year 2015/2016 Employer Contribution Rate" (PDF).
- ↑ Pennsylvania Department of Education (2013). "Investing in Pennsylvania Students 2013".
- ↑ Pennsylvania Department of Education (2012). "Investing in Pennsylvania Students".
- ↑ "Pa. Public School Salaries,". 2009.
- ↑ Wellsboro Area School Board (2009). "Wellsboro Area School District Teachers' Union Contract".
- ↑ Fenton, Jacob, Average classroom teacher salary in Tioga County, 2006-07, The Morning Call. March 2009
- ↑ PA Public School Salaries 2009, Asbury Park Press. November 2010
- ↑ Altoona Mirror (August 2007). "Superintendent contract Wellsboro ASD. Benefits of Learning,".
- ↑ Fenton, Jacob., Pennsylvania School District Data: Will School Consolidation Save Money?, The Morning Call, February 2009
- ↑ "Per Pupil Spending in Pennsylvania Public Schools in 2008 Sort Spending".
- ↑ Pennsylvania Department of Education (2010). "2009-10 Selected Data - 2009-10 Total Expenditures per ADM".
- ↑ US Census Bureau, States Ranked According to Per Pupil Public Elementary-Secondary School System Finance Amounts: Fiscal Year 2011, May 2013
- 1 2 US Census Bureau (2009). "Total and current expenditures per pupil in fall enrollment in public elementary and secondary education, by function and state or jurisdiction: 2006-07".
- ↑ US Census Bureau (March 2003). "Public Education Finances 2000-01 Annual Survey of Local Government Finances" (PDF).
- ↑ United States Census Bureau (2009). "States Ranked According to Per Pupil Elementary-Secondary Public School System Finance Amounts: 2008-09" (PDF).
- ↑ US Census Bureau (May 2013). "States Ranked According to Per Pupil Public Elementary-Secondary School System Finance Amounts: Fiscal Year 2011" (PDF).
- ↑ Pennsylvania Department of Education Report (2009). "Summaries of Annual Financial Report Data".
- ↑ Jan Murphy (June 15, 2016). "Search the database: How much is in your school district's fund balance?".
- ↑ Murphy, Jan., Pennsylvania's public schools boost reserves, CentreDaily Times, September 22, 2010
- ↑ Pennsylvania Auditor General (January 2010). "WELLSBORO AREA SCHOOL DISTRICT TIOGA COUNTY, PENNSYLVANIA PERFORMANCE AUDIT REPORT".
- ↑ Wellsboro Area School Administration, 2013. "Wellsboro Area School District Audits and Reports".
- ↑ Pennsylvania Department of Education (May 2012). "Pennsylvania Public School District Tuition Rates".
- ↑ Pennsylvania of Community & Economic Development (2012). "Earned Income Tax".
- ↑ Penn State Cooperative Extension (2010). "What are the Local Taxes in Pennsylvania?, Local Tax Reform Education Project" (PDF).
- ↑ Pennsylvania Department of Revenue (April 2010). "Personal Income Taxation Guidelines".
- ↑ John Finnerty (2013). "PA teachers pensions". CNHI Harrisburg Bureau.
- ↑ Pennsylvania Representative Todd Stephens (January 23, 2014). "LEEF Funding Chart 2014".
- ↑ JANICE BISSETT & ARNOLD HILLMAN (2006). "A Summary of the History and Financing of Education in Pennsylvania 1682- 2013" (PDF). PA Association of Rural and Small Schools.
- ↑ Jan Murphey (January 4, 2016). "Here's the payout your school district gets from the partial 2015-16 state budget". Pennlive.com.
- ↑ Jennifer Wakeman (January 4, 2016). "Harrisburg releases $3.3 billion in delayed funds".
- ↑ Pennsylvania General Assembly (June 26, 2015). "Basic Education Funding Commission".
- ↑ Jan Murphy (January 6, 2016). "School funding distribution gives rise to new battle between Wolf, GOP lawmakers". PennLive.com.
- ↑ Pennsylvania Department of Education (January 2016). "Summary of State Appropriations for Education 2015-2016 Fiscal Year Education Budget".
- ↑ PDE (July 7, 2014). "Enacted Education Budget 2014-2015".
- ↑ Pennsylvania Department of Education, 2014-15 Enacted Education Budget Fast Facts, July 14, 2014
- ↑ Democrat Appropriations Committee, Report on Education funding by LEA, July 2, 2013
- ↑ Pennsylvania Office of the Budget, 2013-14 State Budget Highlights, 2013
- ↑ Senator Jake Corman (June 28, 2012). "Pennsylvania Education funding by Local School District" (PDF).
- ↑ Pennsylvania General Assembly Sen Jake Corman (June 29, 2012). "SB1466 of 2012 General Fund Appropriation".
- ↑ PA Senate Appropriations Committee (June 28, 2011). "School District 2011-12 Funding Report".
- ↑ Pennsylvania Department of Education (July 2011). "Basic Education Funding".
- ↑ Pennsylvania Department of Education (June 30, 2011). "Basic Education Funding".
- ↑ Pennsylvania Department of Education (June 30, 2011). "Basic Education Funding 2011-2012 Fiscal Year".
- ↑ Pennsylvania Department of Education, District Allocations Report 2009, 2009-10
- ↑ Pennsylvania House Appropriations Committee Education Budget information (June 30, 2010). "PA Basic Education Funding-Printout2 2010-2011" (PDF).
- ↑ Pennsylvania Department of Education 2009-2010 Funding Report by LEA October 2009.
- ↑ Pennsylvania Office of Budget (February 2009). "Governor's Budget Proposal 2009 Pennsylvania Department of Education Budget Proposal 2009".
- ↑ Pennsylvania Department of Education, Funding Report by LEA October 2009, October 2009
- ↑ Pennsylvania Department of Education - Accountability Block Grant report 2010, Grantee list 2010
- ↑ Pennsylvania Department of Education (2013). "Passport for Learning Block Grant".
- ↑ Pennsylvania Auditor General (December 22, 2008). "Classrooms for the Future grants audit".
- ↑ Pennsylvania Office of the Governor press release (August 30, 2007). "Governor Rendell Announces 'Classrooms for the Future' Schools".
- ↑ "Educational Assistance Program Funding 2010-2011 Fiscal Year". Pennsylvania Department of Education. Retrieved January 2011. Check date values in:
|access-date=(help) - ↑ Pennsylvania Department of Education Press Office (October 17, 2013). "Acting Secretary of Education Says Hybrid Learning Benefits Students; Highlights Success of First-Year Pilot Program".
- ↑ PSEA (2006). "Project 720 PDE Education Improvement Initiative Series" (PDF).
- ↑ Tioga County ARRA FUNDING
- ↑ "School stimulus money". Pittsburgh Post-Gazette. March 12, 2009.
- ↑ Governor's Press Office. (January 20, 2010). "Pennsylvania's 'Race to the Top' Fueled by Effective Reforms, Strong Local Support,".
- ↑ Pennsylvania Department of Education Secretary Gerald Zahorchek (December 2009). "Pennsylvania Race to the Top Letter to Superintendents".
- ↑ Governor's Press Office. (January 20, 2010). "Pennsylvania's 'Race to the Top' Fueled by Effective Reforms, Strong Local Support,".
- ↑ U.S. Department of Education (March 29, 2010). "Race to the Top Fund".
- ↑ PDE (2015). "TITLE II, PART A - TEACHER AND PRINCIAL TRAINING & RECRUITING".
- ↑ PDE (2015). "Federal Programs".
- ↑ PDE, Title IIA egrants 2012-13, 2012
- ↑ PDE, Title IIA egrants 2014-15, 2014
- ↑ US Department of Education (September 15, 2004). "Title III — Language Instruction for Limited English Proficient and Immigrant Students".
- ↑ PDE, English As A Second Language (ESL), 2015
- ↑ PDE (2015). "Title III Supplemental Program".
- ↑ PDE, Title III Grant Allocations 2014-15, 2014
- ↑ Pennsylvania Department of Education (2011). "Pennsylvania School Improvement Planning".
- ↑ Pennsylvania Department of Education (August 23, 2011). "Education Secretary Announces $66 Million Awarded to Reform Pennsylvania Lowest-Achieving Schools".
- ↑ Pennsylvania Department of Education (2010). "School Improvement grants 2010".
- ↑ Pennsylvania Department of Education. "School Improvement information".
- ↑ Pennsylvania Department of Education. "Pennsylvania School Improvement Grant Components_Stat_Requirements".
- ↑ Pennsylvania Department of Education (June 9, 2010). "Pennsylvania School Improvement Grant Components_Stat_Requirements" (PDF).
- ↑ "Carol M White Physical Education Program 2010 Grants". 2010.
- ↑ Common Cents program - Making Every Dollar Count
- ↑ Wellsboro Area School District Administration (2016). "Wellsboro Area School District state budget report" (PDF).
- ↑ Katie Colaneri (June 11, 2015). "New pipeline could mean tax bonanza for NJ towns, but for Pa.? Not so much". State Impact NPR.org.
- ↑ Penn State Extension (2012). "Marcellus Shale Gas Development: What Does It Mean for Pennsylvania Schools?".
- ↑ Pennsylvania Department of Education (2004). "Act 511 Tax Report".
- ↑ State Tax Equalization Board (2011). "State Tax Equalization Board About US".
- ↑ Pennsylvania Auditor General office - Bureau of Audits (February 2011). "A Special Performance Audit of the Pennsylvania State Tax Equalization Boards" (PDF).
- ↑ Pennsylvania Department of Education (2015). "Real Estate Tax Rates by School District 2015-16 Real Estate Mills".
- ↑ Pennsylvania Department of Education (2013). "Real Estate Tax Rates by School District 2013-14 Real Estate Mills".
- ↑ Pennsylvania Department of Education, Real Estate Tax Rates by School District 2012-13 Real Estate Mills, May 2012
- ↑ Pennsylvania Department of Education, Real Estate Tax Rates by School District 2011-12 Real Estate Mills, May 2011
- ↑ Pennsylvania Department of Education, Financial Elements Reports 2010-11, 2010
- ↑ Pennsylvania Department of Education, Financial Elements Reports, 2009
- ↑ Pennsylvania Department of Education, Financial Elements Reports 2008-09 Real Estate Mills, May 2008
- ↑ Pennsylvania Department of Education, Real Estate Tax Millage by School District, 2007
- ↑ Pennsylvania Department of Education, Real Estate Tax Millage by School District, 2006
- ↑ Pennsylvania Department of Education, Real Estate Tax Millage by School District, 2005
- ↑ Pennsylvania Department of Education (2009). "Pennsylvania School Finances - Summaries of Annual Financial Report Data 2008-09".
- ↑ Tioga County Property Taxes 2012, Tax-rates.org, 2012
- ↑ Tax Foundation, The facts on Pennsylvania’s Tax Climate, January 2015
- ↑ Pennsylvania Department of Education (2010). "2010-11 Act 1 of 2006 Referendum Exception Guidelines".
- ↑ Kaitlynn Riely (August 4, 2011). "Law could restrict school construction projects". Pittsburgh Post-Gazette.
- ↑ Pennsylvania General Assembly (June 29, 2011). "SB330 of 2011".
- ↑ Eric Boehm (July 1, 2011). "Property tax reform final piece of state budget". PA Independent.
- ↑ Pennsylvania Department of Education (2011). "Special Session Act 1 of 2006 the Taxpayer Relief Act information" (PDF).
- ↑ Pennsylvania Department of Education (May 2010). "Special Session Act 1 of 2006 School District Adjusted Index for 2006-2007 through 2010-2011,".
- ↑ Pennsylvania Department of Education, 2011-2012 School District Adjusted Index, September 2010
- ↑ Pennsylvania Department of Education (September 2011). "2012-2013 School District Adjusted Index Listing".
- ↑ Pennsylvania Department of Education, 2013-2014 School District Adjusted Index, September 2012
- ↑ Pennsylvania Department of Education, 2014-2015 School District Adjusted Index, September 2013
- ↑ Pennsylvania Department of Education, 2015-2016 School District Adjusted Index, September 2014
- ↑ Pennsylvania Department of Education (September 5, 2015). "2016-2017 School District Adjusted Index,".
- ↑ Pennsylvania Department of Education (2015). "Property Tax Relief".
- ↑ Pennsylvania Department of Education (April 2016). "Report on Referendum Exceptions For School Year 2016-2017" (PDF).
- ↑ Pennsylvania Department of Education (April 2015). "Taxpayer Relief Act Special Session Act 1 of 2006 Report on Referendum Exceptions For School Year 2015-2016" (PDF).
- ↑ Pennsylvania School Employees, Retirement System, PSERS Chart showing payment mandates 2007-2020, 2014
- ↑ Pennsylvania Department of Education (April 30, 2014). "Report on Referendum Exceptions For School Year 2014-2015".
- ↑ Pennsylvania Department of Education, Report on Referendum Exceptions For School Year 2013-2014, April 2013
- ↑ Pennsylvania Department of Education, Report on Referendum Exceptions For School Year 2012-2013, March 30, 2012
- ↑ Pennsylvania Department of Education (2011). "Special Session Act 1 of 2006 the Taxpayer Relief Act information".
- ↑ Pennsylvania Department of Education (April 2011). "Report on Exceptions".
- ↑ Pennsylvania General Assembly (June 2010). "Pennsylvania HB1326 Taxpayer Tax Relief Act Exceptions to Raise Property Taxes".
- ↑ PDE, Pennsylvania Special Session Act1 property tax relief Report_2009-2010, May 2009
- ↑ Scarcella, Frank & Pursell, Tricia, (May 25, 2010). "Local school tax assessments exceed state averages.". The Daily Item.
- ↑ Pennsylvania Department of Education (May 1, 2014). "2014-2015 Estimated State Property Tax Relief per Homestead".
- ↑ Pennsylvania Gaming Control Board (2014). "Gaming Benefits for Pennsylvanians".
- ↑ Property Tax Reduction Allocations 2010-2011 Fiscal Year
- ↑ The Center for Rural Pennsylvania, "Research Analyzes Rural School District Enrollment and Building Capacity", October 2009
- ↑ Pennsylvania Legislative Budget & Finance Committee (2007). "Study of the Cost-Effectiveness of Consolidating Pennsylvania School Districts".
- ↑ Pennsylvania Institute of Certified Public Accountants (January 2011). "Report of the Fiscal Responsibility Task Force" (PDF).
- ↑ Pennsylvania Legislative Budget & Finance Committee (2007). "Study of the Cost Effectiveness of Consolidating Pennsylvania School Districts".
- ↑ Rendell, E. & Soderberg, M. (2009). "Pennsylvania school district consolidation. 2009-10 Executive Budget Fast Facts." (PDF).
- ↑ Study of the cost-effectiveness of consolidating Pennsylvania districts. New York: Standard & Poor’s School Evaluation Services. 2007, p. 6.
- ↑ Pennsylvania Office of the Governor Press Release (November 10, 2005). "Home-Schooled, Charter School Children Can Participate in School District Extracurricular Activities".
- 1 2 Eleanor Chute., New Pa. law expands clearance requirements for school volunteers, employees, Pittsburgh Post-Gazette, December 15, 2014
- 1 2 Pennsylvania General Assembly (2014). "ACT 126 – Child Abuse Recognition and Reporting Act".
- 1 2 Ali Stevens., Child Protective Services Law impacts schools, WKOK.com 1070AM, January 6, 2015
- ↑ Wellsboro Area School Board, Wellsboro Area School District Teacher Union Contract, 2014
- ↑ PA General Assembly (July 1, 2012). "Senate Bill 200 of Session 2011 Safety in Youth Sports Act".
- ↑ UMPC Sports Medicine (2014). "Managing Concussions in Student Athletes: The Safety in Youth Sports Act".
- ↑ Wellsboro Area School District Administration (2014). "Wellsboro Area School District Athletics".
- ↑ Pennsylvania Department of Education (2013). "Interscholastic Athletic Opportunities Disclosure Form" (PDF).
- ↑ Pennsylvania Interscholastic Athletics Association (2015). "PIAA School Directory".
Tioga County, Pennsylvania Schools | |||||||||||||||||||||||
|---|---|---|---|---|---|---|---|---|---|---|---|---|---|---|---|---|---|---|---|---|---|---|---|
| |||||||||||||||||||||||
| |||||||||||||||||||||||
Lycoming County, Pennsylvania Schools | |||||||||||||||||||||||||||||||||
|---|---|---|---|---|---|---|---|---|---|---|---|---|---|---|---|---|---|---|---|---|---|---|---|---|---|---|---|---|---|---|---|---|---|
| |||||||||||||||||||||||||||||||||
| |||||||||||||||||||||||||||||||||