1986 Atlantic hurricane season
 | |
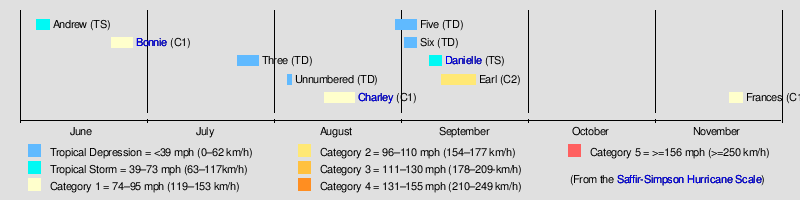
| Season summary map | |
| First system formed | June 5, 1986 |
|---|---|
| Last system dissipated | November 21, 1986 |
| Strongest storm1 | Earl – 979 mbar (hPa) (28.91 inHg), 105 mph (165 km/h) (1-minute sustained) |
| Total depressions | 10 |
| Total storms | 6 |
| Hurricanes | 4 |
| Major hurricanes (Cat. 3+) | 0 |
| Total fatalities | 70 |
| Total damage | $57 million (1986 USD) |
| 1Strongest storm is determined by lowest pressure | |
1984, 1985, 1986, 1987, 1988 | |
The 1986 Atlantic hurricane season officially began on June 1, 1986, and lasted until November 30, 1986. These dates conventionally delimit the period of each year when most tropical cyclones form in the Atlantic basin. During the 1986 season, the first subtropical depression formed in the first week of June, while the last tropical cyclone dissipated at the end of the third week of November. The 1986 season had lower than average activity because of an ongoing El Niño event, and was the least active season in the North Atlantic since the 1983 Atlantic hurricane season. This was also the first season since 1972 to have no major hurricanes.[1] Earl was the strongest hurricane of the season, reaching Category 2 status. Few storms caused significant damage; Hurricane Bonnie caused heavy rains and flooding across southeast Texas when it made landfall near Sea Rim State Park. Hurricane Charley caused limited damage in North Carolina and Massachusetts, but crossed the Atlantic as an extratropical cyclone and caused considerable damage in the British Isles.
Seasonal forecast and summary
Dr. William M. Gray of Colorado State University issued forecasts on May 29 and July 28 indicating within both forecasts the anticipation of a below normal hurricane season. In May, a total of 8 named tropical storms were expected, with four hurricane expected, 15 days with hurricanes, and a total of 35 days with a tropical storm active in the northern Atlantic ocean. In July, the numbers were dropped to a total of 7 named storms, 4 hurricanes, 10 hurricane days, and 25 days with a named tropical storm, which almost perfectly verified.[2]
The season's activity was reflected with a cumulative accumulated cyclone energy (ACE) rating of 36,[3] which is classified as "below normal".[4] ACE is, broadly speaking, a measure of the power of the hurricane multiplied by the length of time it existed, so storms that last a long time, as well as particularly strong hurricanes, have high ACEs. ACE is only calculated for full advisories on tropical systems at or exceeding 34 knots (39 mph, 63 km/h) or tropical storm strength. Subtropical cyclones are excluded from the total.[5]
Timeline of events
- June 1
- 0000 UTC (8:00 p.m. EDT May 31) – The 1986 Atlantic hurricane season officially begins.[6]
- June 5
- June 6
- 0000 UTC (8:00 p.m. EDT June 5) – Subtropical Depression One acquired tropical characteristics and strengthened into Tropical Storm Andrew.[7]
- June 7
- 1200 UTC (8:00 a.m. EDT June 6) – Tropical Storm Andrew attained its peak intensity with maximum sustained winds of 50 mph (85 km/h) and a minimum barometric pressure of 999 mbar (29.5 inHg).[7]
- June 9
- 0000 UTC (8:00 p.m. EDT June 8) – Tropical Storm Andrew was absorbed by a low pressure system.[7]
- June 23
- 1800 UTC (1:00 p.m. CDT) – Tropical Depression Two formed in the eastern Gulf of Mexico.[8]
- June 24
- 1800 UTC (1:00 p.m. CDT) – Tropical Depression Two strengthened into Tropical Storm Bonnie.[8]
- June 25
- 1800 UTC (1:00 p.m. CDT) – Tropical Storm Bonnie strengthened into Category 1 hurricane.[8]
- June 26
- 0900 UTC (4:00 a.m. CDT) – Hurricane Bonnie attained its peak intensity with winds of 85 mph (140 km/h) and a minimum pressure of 990 mbar (hPa; 29.23 inHg).[8]
- 1000 UTC (5:00 a.m. CDT) – Hurricane Bonnie made landfall near High Island, Texas with winds of 85 mph (140 km/h).[8]
- 1800 UTC (1:00 p.m. CDT) – Hurricane Bonnie weakened back to a tropical storm.[8]
- June 27
- 0000 UTC (7:00 p.m. CDT June 26) – Tropical Storm Bonnie weakened back to a tropical depression.[8]
- June 28
- August 4
- 0600 UTC (1 a.m. CST) – A tropical depression developed in the western Gulf of Mexico.[1]
- August 5
- 1200–1800 UTC (7:00 a.m.–1:00 p.m. CST) – The tropical depression made landfall in North Padre Island, Texas.[1]
- 1800 UTC (1:00 p.m. CST) – The tropical depression dissipated over southern Texas.[1]
- August 13
- 1200 UTC (8:00 a.m. EDT) – A subtropical depression formed over the Florida Panhandle.[9]
- August 15
- 1200 UTC (8:00 a.m. EDT) – The subtropical depression transitioned into a tropical depression 70 miles (110 km) southeast of Charleston, South Carolina.[9]
- 1200 UTC (2:00 p.m. EDT) – The tropical depression strengthened into Tropical Storm Charley.[9]
- August 17
- 1200 UTC (8:00 a.m. EDT) – Tropical Storm Charley strengthened into Category 1 hurricane.[9]
- 1400 UTC (10:00 a.m. EDT) – Hurricane Charley made landfall near Cape Fear, North Carolina with winds of 75 mph (120 km/h).[9]
- 2200 UTC (6:00 p.m. EDT) – Hurricane Charley attained its peak intensity with maximum sustained winds of 75 mph (120 km/h) and a minimum barometric pressure of 987 mbar (29.1 inHg).[9]
- August 18
- 1200 UTC (8:00 a.m. EDT) – Hurricane Charley weakened back to a tropical storm.[9]
- August 21
- 0000 UTC (8:00 p.m. EDT) – Tropical Storm Charley transitioned into an extratropical storm.[9]
- August 30
- 1200 UTC (8:00 a.m. EDT) – Tropical Depression Five formed in the mid-Atlantic.[1]
- September 1
- 1200 UTC (8:00 a.m. EDT) – Tropical Depression Six formed in the Gulf of Mexico.[1]
- September 4
- Around 0600 UTC (1:00 a.m. CST) – Tropical Depression Six made landfall near Altamira, Tamaulipas, Mexico.[1]
- 1200 UTC (8:00 a.m. EDT) – Tropical Depression Five dissipated east-southeast of Bermuda.[1]
- 1200 UTC (7:00 a.m. EDT) – Tropical Depression Six dissipated over Mexico.[1]
- September 7
- 2:00 a.m. EDT (0600 UTC) - Tropical Depression Seven formed several hundred miles east of the Windward Islands.[10]
- 2:00 p.m. EDT (1800 UTC) - Tropical Depression Seven strengthened into Tropical Storm Danielle.[10]
- September 8
- 0600 UTC (2:00 a.m. EDT) – Tropical Storm Danielle attained its peak intensity with maximum sustained winds of 60 mph (95 km/h) and a minimum barometric pressure of 1,000 mbar (30 inHg).[10]
- September 9
- 1800 UTC (2:00 p.m. EDT) – Tropical Storm Danielle weakened back to a tropical depression.[10]
- September 10
- 1200 UTC (8:00 a.m. EDT) – Tropical Depression Danielle dissipated in the western Caribbean Sea.[10]
- 1800 UTC (2:00 p.m. EDT) – Tropical Depression Eight developed 1240 miles (2000 km) east-northeast of Puerto Rico.[11]
- September 11
- 0000 UTC (8:00 p.m. EDT September 10) – Tropical Depression Eight strengthened into Tropical Storm Earl.[11]
- 1800 UTC (2:00 p.m. EDT) – Tropical Storm Earl strengthened into a Category 1 hurricane.[11]
- September 12
- 1200 UTC (8:00 a.m. EDT) – Hurricane Earl strengthened into a Category 2 hurricane.[11]
- September 14
- 1200 UTC (8:00 a.m. EDT) – Hurricane Earl attained its peak intensity with maximum sustained winds of 105 mph (165 km/h) and a minimum barometric pressure of 979 mbar (28.9 inHg).[11]
- September 16
- 0000 UTC (8:00 p.m. EDT September 15) – Hurricane Earl weakened back to a Category 1 hurricane.[11]
- September 19
- 0000 UTC (98:00 p.m. EDT September 18) – Hurricane Earl transitioned into an extratropical cyclone.[11]
- There was no tropical cyclone activity in the Atlantic basin during October 1986.
- November 18
- 1800 UTC (2:00 p.m. EDT) – Tropical Depression Nine formed north of the Leeward Islands.[12]
- November 19
- 0600 UTC (2:00 a.m. EDT) – Tropical Depression Nine strengthened into Tropical Storm Frances.[12]
- November 20
- 0600 UTC (2:00 a.m. EDT) – Tropical Storm Frances strengthened into a Category 1 hurricane.[12]
- 1200 UTC (8:00 a.m. EDT) – Hurricane Frances attained its peak intensity with maximum sustained winds of 85 mph (140 km/h) and a minimum pressure of 1,000 mbar (30 inHg).[12]
- November 21
- 1200 UTC (8:00 a.m. EDT) – Hurricane Frances weakened back into a tropical storm.[13]
- November 22
- 0000 UTC (8:00 p.m. EDT) – Tropical Storm Frances merged with an extratropical storm.[13]
- November 30
- 2359 UTC (7:59 p.m. EDT) – The 1986 Atlantic hurricane season officially ended.[6]
Storms
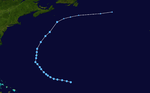
Tropical Storm Andrew
| Tropical storm (SSHWS) | |||
|---|---|---|---|
| |||
| Duration | June 5 – June 8 | ||
| Peak intensity | 50 mph (85 km/h) (1-min) 999 mbar (hPa) | ||


In early June, a large area of disturbed weather persisted over the Greater Antilles, bringing heavy rains to the islands. The area moved northward, developing a circulation over the Bahamas. Strong upper-level winds caused when satellite imagery showed a circulation developing over the Bahamas. Strong upper-level winds caused the structure to resemble a subtropical cyclone, and as a result, the system was classified as a subtropical depression on June 5.[7][14] The depression moved to the northwest and transitioned into a tropical storm on June 6; it was named Andrew about 258 mi (415 km) southeast of Charleston, South Carolina.[14] The tropical storm approached the South Carolina coast within 115 mi (185 km) before recurving to the northeast on June 7. The storm passed within 70 mi (110 km) of Cape Hatteras while recurving, while near its peak intensity of 50 mph (80 km/h). The storm accelerated to the northeast, briefly crossing into the forecasting territory of Environment Canada, the first of three storms of the season to do so,[15] before ultimately being absorbed by a low pressure system over Canada on June 8.[14]
While active, Andrew posed a threat to the Carolinas. Gale warnings were posted from an area ranging from Cape Lookout to south of Virginia Beach, Virginia on June 7.[16] Waves reached heights of 12-foot (3.7 m) off the coast of the Carolinas,[17] which killed a person on Ocracoke Island. Three companions were also swept out, all of whom made it back to shore. At Wrightsville Beach and Carolina Beach, at least 40 swimmers were caught in the currents, four of whom were hospitalized.[18] The precursor to the storm produced heavy rainfall across Jamaica that caused a deadly flood event.[14]
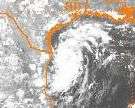
Hurricane Bonnie
| Category 1 hurricane (SSHWS) | |||
|---|---|---|---|
| |||
| Duration | June 23 – June 28 | ||
| Peak intensity | 85 mph (140 km/h) (1-min) 992 mbar (hPa) | ||


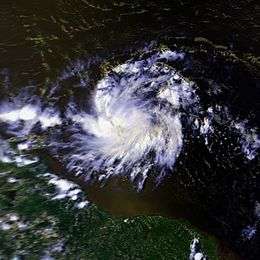
During late June, a frontal trough drifted into the northeastern Gulf of Mexico, and by June 22 a surface circulation formed. Tracking west-northwestward, it developed into Tropical Depression Two on June 23 while located about 330 miles (535 km) south of Pensacola, Florida. The next day, it attained tropical storm status, and with continued favorable conditions attained hurricane status on June 25 to the south of Louisiana. Bonnie turned to the northwest and made landfall near Sea Rim State Park in Texas. The storm quickly weakened over land as it turned to the north and northeast, and on June 28 it was absorbed by an approaching frontal zone in southeastern Missouri.[19]
Prior to moving ashore, 22,000 people were evacuated. Upon making landfall, Hurricane Bonnie produced a storm surge peaking at 5.2 feet (1.5 m) at Sabine Pass. Rainfall from the storm peaked at 13 inches (330 mm) in Ace, Texas,[20] which caused some street flooding and destroyed a small dam in Liberty County, Texas. The hurricane also spawned eleven tornadoes, which, in combination with moderate winds, destroyed about 25 residencies in southwestern Louisiana. Three storm deaths occurred in the Port Arthur, Texas area; two deaths occurred from separate car accidents, and another occurred after a partially paralyzed woman died in a house fire. Hurricane Bonnie caused minor damage totaling $2 million (1986 USD, $3.5 million 2006 USD).[21]
Tropical Depression Three
| Tropical depression (SSHWS) | |||
|---|---|---|---|
| |||
| Duration | July 23 – July 28 | ||
| Peak intensity | 35 mph (55 km/h) (1-min) 1012 mbar (hPa) | ||

The third tropical depression of the season was detected early on July 27 in the open waters of the Atlantic, north of Bermuda. While about 180 miles (290 km) north of the island, the storm was moving northward at 15 mph (24 km/h) while its maximum sustained winds were about 30 mph (48 km/h).[22] Later that afternoon, aircraft reconnaissance found no well-defined circulation and the storm's status was reduced from a depression. The depression never threatened any land areas.[23]
Unnumbered Tropical Depression
| Tropical depression (SSHWS) | |||
|---|---|---|---|
| |||
| Duration | August 4 – August 5 | ||
| Peak intensity | 35 mph (55 km/h) (1-min) 1012 mbar (hPa) | ||

A tropical disturbance was detected on August 4 in the northwestern Gulf of Mexico along the lower Texas coast. The low-pressure system moved slowly toward land, limiting the system's development.[24] On August 5, the system became organized enough to be considered a tropical depression.[25] The storm moved inland overnight, dumping several inches of rain over South Texas and causing street flooding in Brownsville and nearby South Padre Island. The system caused rainfall up to 4.45 inches (113 mm) in some areas but had no major problems attributed to it.[25][26] This storm was not carried as a depression operationally, and thus has no assigned number.[27]
Hurricane Charley
| Category 1 hurricane (SSHWS) | |||
|---|---|---|---|
| |||
| Duration | August 13 – August 20 | ||
| Peak intensity | 80 mph (130 km/h) (1-min) 987 mbar (hPa) | ||


Hurricane Charley was the costliest tropical cyclone of the season, and the first hurricane to threaten the east-central United States since Hurricane Gloria in the previous year. The third tropical storm and second hurricane of the season, Charley formed as a subtropical low on August 13 along the Florida panhandle. A few days later intensified it into a tropical storm off the coast of South Carolina, and Charley attained hurricane status before moving across eastern North Carolina. It gradually weakened over the north Atlantic Ocean before transitioning into an extratropical cyclone, though its remnants remained identifiable for over a week until after crossing the British Isles and dissipating on August 30.[28]
The storm brought light to moderate precipitation along its path through the southeastern United States. In Georgia and South Carolina, the rainfall alleviated drought conditions.[29] In North Carolina, where the hurricane made landfall, tidal flooding and downed trees were the primary impact. The storm brought high winds to southeastern Virginia, where 110,000 people were left without power. Minor damage extended along the Atlantic coastline northward through Massachusetts. One traffic fatality was reported each in North Carolina and Virginia. Three people in Maryland died due to a plane crash related to the storm. Throughout the United States, Hurricane Charley caused an estimated $15 million in damage (1986 US$, $29 million 2008 USD).[28]
As an extratropical cyclone, Charley brought heavy rainfall and strong winds to Ireland and the United Kingdom, causing at least 11 deaths.[30] In Ireland, the rainfall set records for 24‑hour totals, including an accumulation of more than 7.8 in (200 mm) which set the record for the greatest daily rainfall total in the country. In the country, the rainfall caused widespread flooding, resulting in two rivers overflowing their banks. In the Dublin area, 451 buildings were flooded, some up to a depth of 8 ft (2.4 m).[31] In the United Kingdom, the storm caused downed trees and power lines, as well as flooded rivers.[30]
Tropical Depression Five
| Tropical depression (SSHWS) | |||
|---|---|---|---|
| |||
| Duration | August 30 – September 4 | ||
| Peak intensity | 35 mph (55 km/h) (1-min) 1016 mbar (hPa) | ||


This tropical depression formed in the eastern tropical Atlantic Ocean on August 31. The depression moved west-northwest, then northwest away from the Caribbean Sea without further development before dissipating east-southeast of Bermuda on September 4.[27]
Tropical Depression Six
| Tropical depression (SSHWS) | |||
|---|---|---|---|
| |||
| Duration | September 1 – September 4 | ||
| Peak intensity | 35 mph (55 km/h) (1-min) 1003 mbar (hPa) | ||

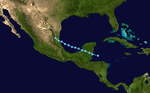
A tropical wave crossed the Caribbean sea, moving into a favorable upper environment in the western Caribbean sea on August 31. The system formed into a weak tropical depression before crossing the Yucatán peninsula, becoming better organized as it moved into the south-central and western Gulf of Mexico between September 1 and 3. The system moved ashore east-central Mexico before quickly dissipating as a tropical cyclone on September 4. Satellite imagery revealed that its residual cloud pattern persisted over Mexico for an additional couple of days before degenerating. Heavy rainfall fell primarily north of its track, with the maximum across northeast Mexico falling at El Barranco/Altamira, where a total of 9.33 inches (237 mm) was measured.[32]
Tropical Storm Danielle
| Tropical storm (SSHWS) | |||
|---|---|---|---|
| |||
| Duration | September 7 – September 10 | ||
| Peak intensity | 60 mph (95 km/h) (1-min) 1000 mbar (hPa) | ||

On September 1, a tropical wave moved off the coast of Africa and headed westward. The disturbance was below the 10 degree latitude as it organized into a tropical depression on September 7 and then a tropical storm later that day. Danielle peaked as a 60 mph (97 km/h) storm on September 8, while Reconnaissance Aircraft reported gusts of up to hurricane force. After passing through the Lesser Antilles, Danielle encountered vertical wind shear, and on September 10 it dissipated in the central Caribbean Sea. The remnants continued westward and ultimately regenerated into Tropical Storm Lester.[33]
The islands of Saint Vincent and the Grenadines experienced wind gusts up to hurricane force, causing severe power outages and causing roof damage. In the Grenadines, the storm drove a coast guard ship aground,[34] while five people were injured and hundreds of homes were destroyed. Torrential rainfall produced several mudslides, which, in turn, damaged roads, bridges, electricity, and water services.[35] Danielle also destroyed twelve homes on the island of Barbados.[36] In Trinidad and Tobago, strong flooding of up to four feet caused 27 landslides, destroying four bridges. The storm caused $8 million in damage in Tobago.[37] Total damage from the storm amounted to $9.2 million (1986 USD), mostly to crops, though no deaths were reported.[35]
Hurricane Earl
| Category 2 hurricane (SSHWS) | |||
|---|---|---|---|
| |||
| Duration | September 10 – September 18 | ||
| Peak intensity | 105 mph (165 km/h) (1-min) 979 mbar (hPa) | ||


The strongest storm of the season began as a tropical wave off Africa on September 4. After moving across the tropical Atlantic Ocean it strengthened as Tropical Depression Five on September 10 while about 1240 miles (2000 km) east of Puerto Rico. The depression quickly strengthened and reached hurricane strength on September 11, peaked as a Category 2 hurricane on September 12 as it made a half circle, weakened to a Category 1 on September 16 and bounced back the way it came. Earl then turned north and became extratropical southeast of Newfoundland on September 19. At its peak, Earl had sustained winds of 105 mph (170 km/h) and a minimum central pressure of 979 mbar.[38]
Hurricane Frances
| Category 1 hurricane (SSHWS) | |||
|---|---|---|---|
| |||
| Duration | November 18 – November 21 | ||
| Peak intensity | 85 mph (140 km/h) (1-min) 1000 mbar (hPa) | ||


First spotted as a tropical disturbance near the Lesser Antilles on November 15, the system moved generally northward while slowly developing. The system organized into a tropical depression on November 18 and quickly strengthened into a tropical storm. The storm curved northeast and strengthened further, reaching hurricane strength on November 20. However, a surface high-pressure system to the north caused the storm to weaken as the vertical wind shear increased over its center. Frances was later absorbed by an extratropical cyclone on November 21.[39]
Storm names
The following names were used for named storms that formed in the north Atlantic in 1986. No names were retired, so it was used again in the 1992 season. This is the same list used for the 1980 season except for Andrew, which replaced Allen. A storm was named Andrew for the first time in 1986. Names that were not assigned are marked in gray.
|
|
Retirement
The World Meteorological Organization retired no names used in the 1986 season.
See also
- List of Atlantic hurricanes
- List of Atlantic hurricane seasons
- 1986 Pacific hurricane season
- 1986 Pacific typhoon season
- 1986 North Indian Ocean cyclone season
- Southern Hemisphere tropical cyclone seasons: 1985–1986, 1986–1987
References
- 1 2 3 4 5 6 7 8 9 10 11 National Hurricane Center; Hurricane Research Division (July 6, 2016). "Atlantic hurricane best track (HURDAT version 2)". United States National Oceanic and Atmospheric Administration. Retrieved December 5, 2016.
- ↑ William M. Gray; Christopher W. Landsea; Philip Klotzbach (November 2002). Verification of Previous Forecasts (Report). Colorado State University. Retrieved July 7, 2009.
- ↑ Hurricane Research Division (March 2011). Atlantic basin Comparison of Original and Revised HURDAT (Report). National Oceanic and Atmospheric Administration. Retrieved July 23, 2011.
- ↑ Background information: the North Atlantic Hurricane Season. Climate Prediction Center (Report). National Oceanic and Atmospheric Administration. May 27, 2010. Archived from the original on May 10, 2011. Retrieved March 30, 2011.
- ↑ David Levinson (August 20, 2008). 2005 Atlantic Ocean Tropical Cyclones. National Climatic Data Center (Report). National Oceanic and Atmospheric Administration. Retrieved July 23, 2011.
- 1 2 Frequently Asked Questions: When is hurricane season?. Atlantic Oceanographic and Meteorological Laboratory, Hurricane Research Division (Report). National Oceanic and Atmospheric Administration. 2009. Retrieved July 1, 2009.
- 1 2 3 4 5 Miles B. Lawrence (1986). Preliminary Report: Tropical Storm Andrew Page 2. National Hurricane Center (Report). National Oceanic and Atmospheric Administration. Retrieved November 28, 2013.
- 1 2 3 4 5 6 7 8 Harold P. Gerrish (1986). Hurricane Bonnie Preliminary Report. National Hurricane Center (Report). National Oceanic and Atmospheric Administration. p. 5. Retrieved November 20, 2008.
- 1 2 3 4 5 6 7 8 Robert C. Sheets (September 11, 1986). Hurricane Charley Preliminary Report. National Hurricane Center (Report). National Oceanic and Atmospheric Administration. p. 4. Retrieved October 17, 2008.
- 1 2 3 4 5 Gilbert B. Clark (1987). Preliminary Report Tropical Storm Danielle 7–10 September 1986 (Report). National Hurricane Center. p. 2. Retrieved July 7, 2009.
- 1 2 3 4 5 6 7 Robert A. Case (1987). Hurricane Earl. National Hurricane Center (Report). National Oceanic and Atmospheric Administration. p. 3. Retrieved July 7, 2009.
- 1 2 3 4 Miles B. Lawrence (1987). Preliminary Report Hurricane Frances 18–21 November 1986. National Hurricane Center (Report). National Oceanic and Atmospheric Administration. p. 2. Retrieved March 16, 2013.
- 1 2 Miles B. Lawrence (1986). Hurricane Frances Preliminary Report. National Hurricane Center (Report). National Oceanic and Atmospheric Administration. Retrieved August 31, 2010.
- 1 2 3 4 Miles B. Lawrence (1986). Preliminary Report: Tropical Storm Andrew Page 1. National Hurricane Center (Report). National Oceanic and Atmospheric Administration. Retrieved November 28, 2013.
- ↑ Storms of 1986 (Report). Environment Canada. 2003. Retrieved November 28, 2013.
- ↑ Miles B. Lawrence (1987). Atlantic Hurricane Season of 1986 (PDF). National Hurricane Center (Report). National Oceanic and Atmospheric Administration. Archived from the original (PDF) on November 26, 2013. Retrieved November 28, 2013.
- ↑ "First Tropical Storm Falters". The Southeast Missourian. Associated Press. June 8, 1986. Retrieved October 27, 2013.
- ↑ "Undertoe from Storm Kills Swimmer". The Spokesman-Review. Associated Press. June 9, 1986. Retrieved October 27, 2013.
- ↑ Harold P. Gerrish (1986). Hurricane Bonnie Preliminary Report Page:2. National Hurricane Center (Report). National Oceanic and Atmospheric Administration. Retrieved November 20, 2008.
- ↑ David M. Roth (April 24, 2007). Hurricane Bonnie — June 26–30, 1986. Weather Prediction Center (Report). National Oceanic and Atmospheric Administration. Retrieved July 7, 2009.
- ↑ Harold P. Gerrish (1986). Hurricane Bonnie Preliminary Report Page:4. National Hurricane Center (Report). National Oceanic and Atmospheric Administration. Retrieved November 20, 2008.
- ↑ "Sunday, BC cycle". Domestic News. United Press International. July 27, 1986.
- ↑ "Sunday, AM cycle". Domestic News. Associated Press. July 27, 1986.
- ↑ "Tropical Disturbance Along Lower Texas Coast". Domestic News. Associated Press. August 5, 1986.
- 1 2 David M. Roth (2008). Tropical Depression of August, 1986. Weather Prediction Center (Report). National Oceanic and Atmospheric Administration. Archived from the original on October 4, 2008. Retrieved September 25, 2008.
- ↑ "Heavy Rains Cause Street Flooding". Domestic News. Associated Press. August 5, 1986.
- 1 2 David M. Roth (May 4, 2009). CLIQR database. Weather Prediction Center (Report). National Oceanic and Atmospheric Administration. Retrieved July 7, 2009.
- 1 2 Robert C. Sheets (September 11, 1986). Hurricane Charley Preliminary Report (Page 1). National Hurricane Center (Report). National Oceanic and Atmospheric Administration. Retrieved October 17, 2008.
- ↑ David M. Roth (April 24, 2007). Hurricane Charley Rainfall Summary. Weather Prediction Center (Report). National Oceanic and Atmospheric Administration. Archived from the original on October 20, 2008. Retrieved October 18, 2008.
- 1 2 Staff Writer (August 26, 1986). "Tail End of Hurricane Charley Kills At Least 11 in Britain and Ireland". Associated Press.
- ↑ August 1986 Monthly Weather Bulletin (Report). Irish Meteorological Service. 1986. Retrieved October 25, 2008.
- ↑ David M. Roth (July 6, 2009). Tropical Depression Six — August 31 – September 6, 1986 (Report). Weather Prediction Center. Retrieved July 6, 2009.
- ↑ Miles B. Lawrence (September 1987). "Annual Summary: Atlantic Hurricane Season of 1986" (PDF). Monthly Weather Review. Atlantic Oceanographic and Meteorological Laboratory. 115: 2160. Bibcode:1987MWRv..115.2155L. doi:10.1175/1520-0493(1987)115<2155:ahso>2.0.co;2. Archived from the original (PDF) on May 7, 2009. Retrieved July 7, 2009.
- ↑ Gilbert B. Clark (1987). Preliminary Report Tropical Storm Danielle 7–10 September 1986 (Report). National Hurricane Center. p. 1. Retrieved July 7, 2009.
- 1 2 St. Vincent Tropical Storm Danielle Sep 1986 Situation Reports 1–2. UN Department of Humanitarian Affairs (Report). ReliefWeb. September 27, 1986. Retrieved July 7, 2009.
- ↑ Ministry of Housing Lands and the Environment Government of Barbados (September 2003). Barbados National Assessment Report on the Implementation of the Barbados Programme of Action (BPOA) (Report). Small Islands Developing States Network. Archived from the original on March 30, 2009. Retrieved July 7, 2009.
- ↑ Trinidad and Tobago Meteorological Service (May 2, 2002). Tropical Cyclones Affecting Trinidad and Tobago 1725–2000 (PDF) (Report). Office of Disaster Preparedness and Management, Government of the Republic of Trinidad and Tobago via the Internet Wayback Machine. Archived from the original (PDF) on December 23, 2005. Retrieved July 7, 2009.
- ↑ Robert A. Case (1987). Hurricane Earl. National Hurricane Center (Report). National Oceanic and Atmospheric Administration. p. 3. Retrieved July 7, 2009.
- ↑ Miles B. Lawrence (1987). Preliminary Report Hurricane Frances 18–21 November 1986 (Report). National Hurricane Center. Retrieved July 7, 2009.
External links
Tropical cyclones of the 1986 Atlantic hurricane season | ||
|---|---|---|
| ||
| ||