Timeline of the 1972 Atlantic hurricane season

The 1972 Atlantic hurricane season is one of five Atlantic hurricane seasons not to have any major hurricanes,[nb 1] the others being 1968, 1986, 1994, and 2013. Although Subtropical Storm Alpha formed on May 23, the season officially began on June 1 and ended on November 30, dates that conventionally delimit the period of each year when most tropical cyclones develop in the Atlantic basin.[2] The season's final storm, Subtropical Storm Delta, dissipated on November 7.
The season produced nineteen tropical or subtropical cyclones, of which seven intensified into tropical or subtropical storms; three became hurricanes, but none further intensified into major hurricanes, the first such occurrence since the 1968 season. Despite the inactivity, the 1972 season resulted in one of the worst natural disasters in American history, Hurricane Agnes. Agnes was a weak but large storm that initially made landfall on the Florida Panhandle before moving up the eastern United States. The hurricane killed 122 people and caused $2.1 billion (1972 USD) in damage, mostly due to flooding in Pennsylvania and New York.[3]
This timeline includes information that was not operationally released, meaning that data from post-storm reviews by the National Hurricane Center, such as a storm that was not operationally warned upon, has been included. This timeline documents tropical cyclone formations, strengthening, weakening, landfalls, extratropical transitions, and dissipations during the season.
Timeline of storms

May
May 23
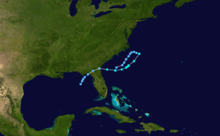
- 18:00 UTC (2:00 p.m. EDT) – A subtropical depression forms while located about 285 km (175 mi) to the southeast of Savannah, Georgia.[4]
May 26
May 26
- 12:00 UTC (6:00 a.m. EDT) – The subtropical storm attains its peak intensity, with maximum sustained wind speeds of 70 mph (115 km/h).[4]
- 16:00 UTC (12:00 a.m. EDT) – The subtropical storm is named "Alpha" as the National Hurricane Center (NHC) initiates advisories on the system.[5]
May 28
- 00:00 UTC (8:00 p.m. EDT, May 27) – Subtropical Storm Alpha weakens into a subtropical depression, after it makes landfall near Brunswick, Georgia.[3][4]
- 02:00 UTC (10:00 p.m. EDT May 27) – The NHC issues its final advisory on Subtropical Depression Alpha as it moves into Florida.[6]
- 1200 UTC (6:00 a.m. EDT) – Subtropical Depression Alpha emerges into the Gulf of Mexico, with winds of 35 mph (55 km/h).[4]
May 29
- 12:00 UTC (6:00 a.m. EDT) – Subtropical Depression Alpha is last noted in the Gulf of Mexico, before it dissipates later that day.[4]
June
June 1
- 00:00 UTC, (20:00 EDT, May 31) – The 1972 Atlantic hurricane season officially begins.[2]
June 14
- 7:00 a.m. CDT (12:00 UTC) – A tropical depression forms over the Yucatan Peninsula.[7][8]
June 15
- 1:00 p.m. CDT (18:00 UTC) – The tropical depression emerges off the Yucatan Peninsula into the western Caribbean Sea with winds of 35 mph (55 km/h).[7][8]
June 16
June 18
June 19
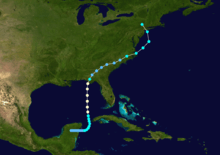
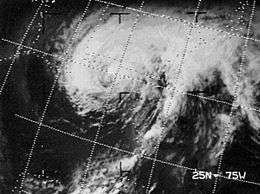
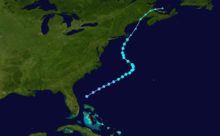
- 1:00 p.m. CDT (18:00 UTC) – Hurricane Agnes makes landfall near Panama City, Florida with winds of 85 mph (135 km/h).[7][8]
- 7 p.m CDT (00:00 UTC) – Hurricane Agnes weakens into a tropical storm.[7][8]
June 20
June 21
- 2:00 p.m. EDT (18:00 UTC) – Tropical Depression Agnes unexpectedly re-strengthens into a tropical storm while over eastern North Carolina.[7][8]
- 8:00 p.m. EDT (00:00 UTC) – Tropical Storm Agnes emerges into the Atlantic Ocean near Nags Head, North Carolina.[7][8]
June 22
- 8:00 a.m. EDT (12:00 UTC) – Tropical Storm Agnes reaches its secondary peak intensity, with maximum winds of 70 mph (115 km/h).[7][8]
- 1:00 p.m. EDT (18:00 UTC) – Tropical Storm Agnes makes landfall near New York City, New York with winds of 65 mph (105 km/h).[7][8]
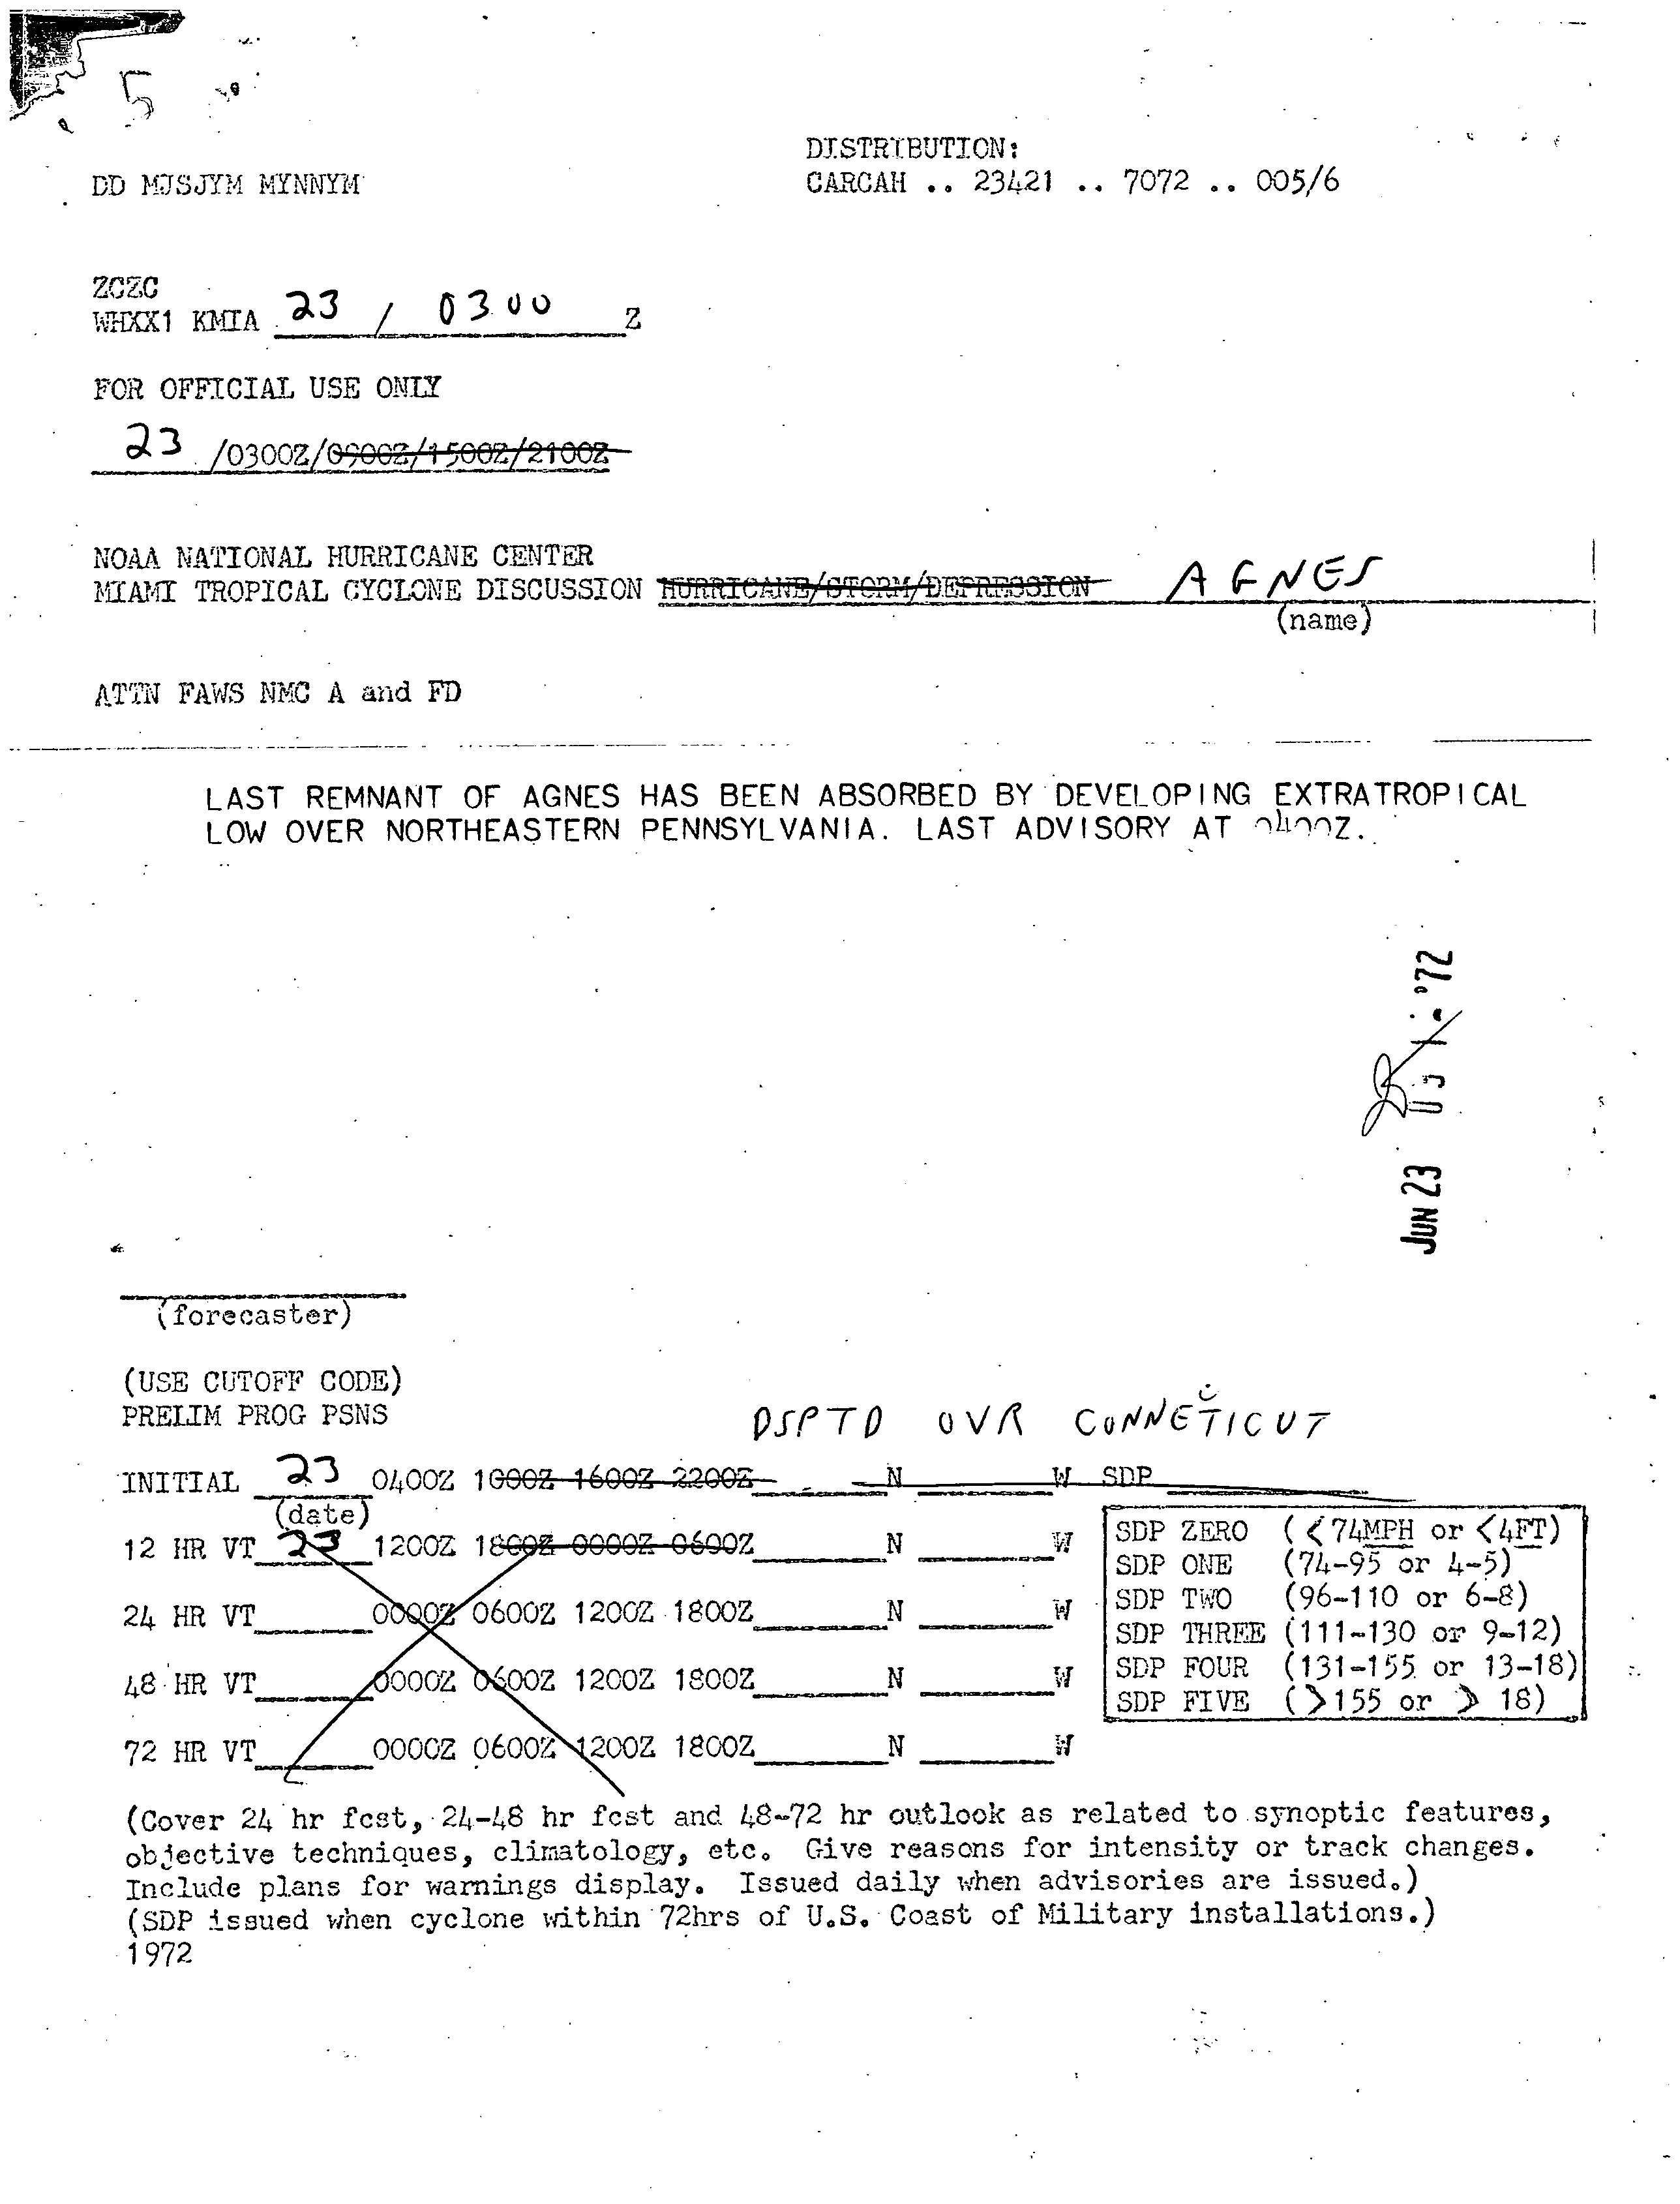
June 23
July
There were no tropical systems during the month of July in the Atlantic hurricane basin.
August
August 22
August 23
August 25
August 27
August 27
August 29
- 8:00 a.m. EDT (12:00 UTC) – A tropical depression forms to the west of Daytona Beach, Florida.[12][13]
August 30
August 31
September
September 1
September 3
September 4
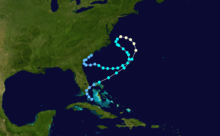
- 8:00 p.m. EDT (00:00 UTC September 5) – A tropical depression forms northeast of Santa Clara, Cuba.[4]
September 5
- 2:00 p.m. EDT (18:00 UTC) – The tropical depression makes landfall on Key Largo, Florida with winds of 35 mph (55 km/h).[4]
- 8:00 p.m. EDT (00:00 UTC) – The tropical depression emerges off the Floridian coast into the North Atlantic.[4]
September 6
- 8:00 a.m. EDT (12:00 UTC) – The tropical depression strengthens into a tropical storm and is named "Dawn".[4]
September 7
September 8
- 8:00 p.m. EDT (00:00 UTC September 9) – Hurricane Dawn weakens into a tropical storm.[4]
September 12
- 2:00 p.m. EDT (18:00 UTC) – Tropical Storm Dawn weakens into a tropical depression.[4]
September 14
- 8:00 a.m. EDT (12:00 UTC) – Tropical Depression Dawn dissipates northeast of Charleston, South Carolina after having paralleled the Georgia and South Carolina coasts for the previous 24 hours.[4]

September 19
September 19
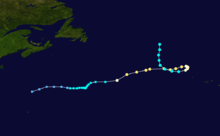
- 9:00 p.m. ADT (00:00 UTC September 20) – The subtropical depression strengthens into a subtropical storm and is named "Charlie".[4]
September 20
- 9:00 p.m. ADT (00:00 UTC September 21) – Subtropical Storm Charlie reaches its peak intensity, with maximum sustained winds of 65 mph (105 km/h).[4]
September 21
- 3:00 a.m.(06:00 UTC) – Subtropical Storm Charlie becomes extratropical.[4]
October
- No tropical cyclones formed in the Atlantic Ocean during the month of October.
November

November 1
November 2
- 9:00 a.m. ADT (12:00 UTC) – Subtropical Storm Delta reaches its peak strength, with maximum sustained winds of 45 mph (70 km/h).[4]
November 4
- 9:00 p.m. ADT (00:00 UTC) – Subtropical Storm Delta weakens into a subtropical depression.[4]
November 7
November 30
- The 1972 Atlantic hurricane season officially ends.[2]
See also
Footnotes
- ↑ A major hurricane is a storm that ranks as Category 3 or higher on the Saffir–Simpson hurricane wind scale.[1]
References
- ↑ Chris Landsea; Neal Dorst (ed.) (June 2, 2011). "A: Basic Definitions". Hurricane Research Division: Frequently Asked Questions. Atlantic Oceanographic and Meteorological Laboratory. A3) What is a super-typhoon? What is a major hurricane ? What is an intense hurricane ?. Retrieved October 3, 2016.
- 1 2 3 Christopher W. Landsea; Neal Dorst; Erica Rule (June 2, 2011). "G: Tropical Cyclone Climatology". Hurricane Research Division: Frequently Asked Questions. Atlantic Oceanographic and Meteorological Laboratory. National Oceanic and Atmospheric Administration. G1) When is hurricane season ?. Retrieved October 3, 2016.
- 1 2 3 4 5 "Season Summary for 1972" (PDF). US Weather Service. Retrieved 2009-01-29.
- 1 2 3 4 5 6 7 8 9 10 11 12 13 14 15 16 17 18 19 20 21 22 23 24 National Hurricane Center; Hurricane Research Division (July 6, 2016). "Atlantic hurricane best track (HURDAT version 2)". United States National Oceanic and Atmospheric Administration. Retrieved December 5, 2016.
- ↑ "Subtropical Storm Alpha, Marine Bulletin 1". National Hurricane Center. 26 May 1972. Retrieved 24 October 2016.
- ↑ "Subtropical Storm Alpha, Subtropical Cyclone Bulletin 8". National Hurricane Center. 28 May 1972. Retrieved 24 October 2016.
- 1 2 3 4 5 6 7 8 9 10 11 12 "Hurricane Agnes Best Track". Tropical Prediction Center. Retrieved 2009-01-28.
- 1 2 3 4 5 6 7 8 9 10 11 12 "HURDAT Best Track for Hurricane Agnes". Atlantic Basin Hurricane Database. Retrieved 2009-01-29.
- ↑ http://www.nhc.noaa.gov/archive/storm_wallets/cdmp/dvd0183-jpg/1972/atlantic/agnes/tropdisc/tcd2303z.jpg
- 1 2 3 4 5 6 7 8 9 "Hurricane Betty Best Track". Tropical Prediction Center. Retrieved 2009-01-28.
- 1 2 3 4 5 6 7 8 9 "HURDAT Best Track for Hurricane Betty". Atlantic Basin Hurricane Database. Retrieved 2009-01-29.
- 1 2 3 4 5 "Tropical Storm Carrie Best Track". Tropical Prediction Center. Retrieved 2009-01-28.
- 1 2 3 4 5 "HURDAT Best Track for Tropical Storm Carrie". Atlantic Basin Hurricane Database. Retrieved 2009-01-29.