Sunderland City Council election, 2008
The 2008 Sunderland Council election took place on 1 May 2008 to elect members of Sunderland Metropolitan Borough Council in Tyne and Wear, England. One third of the council was up for election and the Labour party stayed in overall control of the council.[1]
After the election, the composition of the council was
- Labour 48
- Conservative 22
- Independent 4
- Liberal Democrat 1[2]
Background
Before the election the council had 53 Labour, 17 Conservative, 4 independents and 1 Liberal Democrat councillors.[3] 25 seats were contested in the election with a record 70,828 voters being registered to vote by post, a third of all registered voters.[3]
Election result
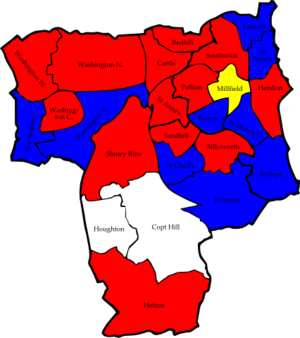
The results saw Labour remain in control of the council, but with a reduced majority after the Conservative party gained 5 seats,[4] including 4 from Labour.[5] The Conservatives gained 2 seats from Labour in Washington and a seat each in Ryhope and St Chads, while also taking a seat from an independent, formerly Labour, councillor in Doxford.[6] The Conservative gains took the party to 22 seats, compared to 48 for Labour.[7] Labour also lost 2 seats to independents in Copt Hill and Houghton wards, but did take one seat back in Hendon which had been held by an independent.[7][6] This meant there were 4 independents on the council, while the Liberal Democrats remained on 1 seat.[7] Overall turnout in the election was 34.9%.[8]
The leader of the Conservatives on the council, Lee Martin, put the Labour losses partly down to national issues such as the abolition of the 10 pence income tax rate and partly down to local issues.[9] The Labour leader of the council described the results as "mid-term blues", while the defeat of the Labour cabinet member Joseph Lawson in Houghton ward to an independent was put down to plans to shut a quarry in the area.[10]
| Sunderland Local Election Result 2008[11][12] | ||||||||||
|---|---|---|---|---|---|---|---|---|---|---|
| Party | Seats | Gains | Losses | Net gain/loss | Seats % | Votes % | Votes | +/− | ||
| Labour | 13 | 1 | 6 | -5 | 52.0 | 39.6 | 29,109 | -3.7% | ||
| Conservative | 9 | 5 | 0 | +5 | 36.0 | 32.0 | 23,547 | +3.9% | ||
| Independent | 2 | 2 | 2 | 0 | 8.0 | 6.4 | 4,710 | -1.9% | ||
| Liberal Democrat | 1 | 0 | 0 | 0 | 4.0 | 11.6 | 8,543 | +2.9% | ||
| BNP | 0 | 0 | 0 | 0 | 0 | 10.2 | 7,540 | -0.4% | ||
| The Left Party | 0 | 0 | 0 | 0 | 0 | 0.1 | 90 | +0.1% | ||
| UKIP | 0 | 0 | 0 | 0 | 0 | 0.1 | 40 | +0.0% | ||
Ward results
| Party | Candidate | Votes | % | ± | |
|---|---|---|---|---|---|
| Conservative | Anthony Morrissey | 1,712 | 51.6 | -2.1 | |
| Labour | Philip Routledge | 809 | 24.4 | +1.7 | |
| Liberal Democrat | Gulya Dixon | 489 | 14.7 | -0.2 | |
| BNP | Robert Fletcher | 308 | 9.3 | +0.6 | |
| Majority | 903 | 27.2 | -3.8 | ||
| Turnout | 3,318 | 38.0 | +0.3 | ||
| Conservative hold | Swing | ||||
| Party | Candidate | Votes | % | ± | |
|---|---|---|---|---|---|
| Labour | Tommy Foster | 1,376 | 52.8 | -13.2 | |
| BNP | John Humble | 350 | 13.4 | -2.2 | |
| Conservative | Clair Hall | 343 | 13.2 | +5.7 | |
| Independent | Ronald McQuillan | 264 | 10.1 | -0.8 | |
| Liberal Democrat | Jon Dewart | 182 | 7.0 | +7.0 | |
| The Left Party | Gary Duncan | 90 | 3.5 | +3.5 | |
| Majority | 1,026 | 39.4 | -11.1 | ||
| Turnout | 2,605 | 30.5 | +0.5 | ||
| Labour hold | Swing | ||||
| Party | Candidate | Votes | % | ± | |
|---|---|---|---|---|---|
| Independent | Derrick Smith | 1,487 | 45.6 | +2.7 | |
| Labour | Joan Carthy | 1,123 | 34.5 | -1.1 | |
| Conservative | George Brown | 451 | 13.8 | +2.7 | |
| BNP | Terence Woolford | 197 | 6.0 | +0.5 | |
| Majority | 364 | 11.2 | +3.9 | ||
| Turnout | 3,258 | 36.7 | +0.7 | ||
| Independent gain from Labour | Swing | ||||
| Party | Candidate | Votes | % | ± | |
|---|---|---|---|---|---|
| Conservative | Richard Vardy | 1,178 | 41.6 | +17.5 | |
| Labour | Linda Mitchell | 991 | 35.0 | -0.8 | |
| Liberal Democrat | Lewis Green | 371 | 13.1 | +13.1 | |
| BNP | Peter Swain | 292 | 10.3 | +1.9 | |
| Majority | 187 | 6.6 | |||
| Turnout | 2,832 | 35.7 | -0.5 | ||
| Conservative gain from Independent | Swing | ||||
| Party | Candidate | Votes | % | ± | |
|---|---|---|---|---|---|
| Conservative | Bob Francis | 2,092 | 53.2 | -0.7 | |
| Labour | Bob Price | 1,032 | 26.2 | +1.1 | |
| Liberal Democrat | Geoffrey Pryke | 459 | 11.7 | -1.4 | |
| BNP | Frederick Donkin | 352 | 8.9 | +1.0 | |
| Majority | 1,060 | 26.9 | -1.9 | ||
| Turnout | 3,935 | 43.5 | +0.8 | ||
| Conservative hold | Swing | ||||
| Party | Candidate | Votes | % | ± | |
|---|---|---|---|---|---|
| Labour | Michael Mordey | 874 | 36.4 | -6.6 | |
| Independent | Sammy Doran | 557 | 23.2 | +4.6 | |
| Conservative | Deborah Lorraine | 517 | 21.5 | +3.3 | |
| BNP | Ian Sayers | 234 | 9.7 | -5.2 | |
| Liberal Democrat | Nathan Hazlett | 219 | 9.1 | +9.1 | |
| Majority | 317 | 13.2 | -11.2 | ||
| Turnout | 2,401 | 29.5 | -0.7 | ||
| Labour gain from Independent | Swing | ||||
| Party | Candidate | Votes | % | ± | |
|---|---|---|---|---|---|
| Labour | Jim Blackburn | 1,843 | 69.2 | +13.9 | |
| Conservative | Douglas Middlemiss | 821 | 30.8 | +18.8 | |
| Majority | 1,022 | 38.4 | +1.1 | ||
| Turnout | 2,664 | 30.6 | -0.7 | ||
| Labour hold | Swing | ||||
| Party | Candidate | Votes | % | ± | |
|---|---|---|---|---|---|
| Independent | Sheila Ellis | 1,415 | 44.8 | +26.4 | |
| Labour | Joe Lawson | 1,168 | 37.0 | -13.7 | |
| Conservative | Edward Allen | 355 | 11.2 | -0.3 | |
| BNP | Kevin Robe | 219 | 6.9 | -1.4 | |
| Majority | 247 | 7.8 | |||
| Turnout | 3,157 | 35.8 | +2.0 | ||
| Independent gain from Labour | Swing | ||||
| Party | Candidate | Votes | % | ± | |
|---|---|---|---|---|---|
| Liberal Democrat | Paul Dixon | 1,059 | 46.0 | +15.5 | |
| Labour | Bob Bowman | 558 | 24.3 | -8.6 | |
| Conservative | Gwennyth Gibson | 346 | 15.0 | +1.6 | |
| BNP | Christopher Lathan | 179 | 7.8 | -0.9 | |
| Independent | Margaret Snaith | 84 | 3.7 | -3.6 | |
| UKIP | Pauline Featonby-Warren | 40 | 1.7 | -1.4 | |
| Independent | Gary Hollern | 35 | 1.5 | +1.5 | |
| Majority | 501 | 21.8 | |||
| Turnout | 2,301 | 32.3 | +0.5 | ||
| Liberal Democrat hold | Swing | ||||
| Party | Candidate | Votes | % | ± | |
|---|---|---|---|---|---|
| Labour | Amy Wilson | 1,055 | 44.3 | -0.4 | |
| Conservative | Michael Leadbitter | 645 | 27.1 | +8.4 | |
| BNP | Paul Humble | 377 | 15.8 | +4.1 | |
| Liberal Democrat | Sham Vedhara | 305 | 12.8 | +1.1 | |
| Majority | 410 | 17.2 | -8.7 | ||
| Turnout | 2,382 | 31.6 | +1.1 | ||
| Labour hold | Swing | ||||
| Party | Candidate | Votes | % | ± | |
|---|---|---|---|---|---|
| Labour | Bryan Charlton | 1,315 | 49.5 | -6.6 | |
| BNP | John Martin | 517 | 19.5 | -3.5 | |
| Independent | Ian Leadbitter | 359 | 13.5 | +6.6 | |
| Conservative | Martin Anderson | 279 | 10.5 | -0.3 | |
| Liberal Democrat | Rob Boyce | 185 | 7.0 | +7.0 | |
| Majority | 798 | 30.1 | -3.0 | ||
| Turnout | 2,655 | 31.0 | +1.1 | ||
| Labour hold | Swing | ||||
| Party | Candidate | Votes | % | ± | |
|---|---|---|---|---|---|
| Conservative | Christopher Fairs | 1,012 | 33.7 | +3.5 | |
| Labour | Ronald Bainbridge | 983 | 32.7 | -8.6 | |
| Independent | Patrick Lavelle | 509 | 16.9 | +1.6 | |
| BNP | Wayne Watts | 291 | 9.7 | -3.5 | |
| Liberal Democrat | David Slone | 209 | 7.0 | +7.0 | |
| Majority | 29 | 1.0 | |||
| Turnout | 3,004 | 37.3 | +1.2 | ||
| Conservative gain from Labour | Swing | ||||
| Party | Candidate | Votes | % | ± | |
|---|---|---|---|---|---|
| Labour | Jim Scott | 1,196 | 47.0 | -9.8 | |
| Conservative | Paula Wilkinson | 662 | 26.0 | -0.9 | |
| BNP | Carl Donkin | 358 | 14.1 | -2.2 | |
| Liberal Democrat | Robert Peel | 327 | 12.9 | +12.9 | |
| Majority | 534 | 21.0 | -8.8 | ||
| Turnout | 2,543 | 30.7 | +0.3 | ||
| Labour hold | Swing | ||||
| Party | Candidate | Votes | % | ± | |
|---|---|---|---|---|---|
| Labour | Anne Hall | 1,571 | 48.4 | -5.8 | |
| Conservative | Joyce Wake | 900 | 27.7 | +3.5 | |
| Liberal Democrat | Carol Attewell | 424 | 13.1 | +13.1 | |
| BNP | Ian Baillie | 350 | 10.8 | +0.7 | |
| Majority | 671 | 20.7 | -9.3 | ||
| Turnout | 3,245 | 33.4 | +1.7 | ||
| Labour hold | Swing | ||||
| Party | Candidate | Votes | % | ± | |
|---|---|---|---|---|---|
| Labour | Pat Smith | 1,503 | 49.3 | -6.0 | |
| Conservative | Patricia Francis | 866 | 28.4 | -3.0 | |
| BNP | Anthony James | 406 | 13.3 | +0.0 | |
| Liberal Democrat | Alf Fowler | 275 | 9.0 | +9.0 | |
| Majority | 637 | 20.9 | -3.0 | ||
| Turnout | 3,050 | 36.7 | +1.1 | ||
| Labour hold | Swing | ||||
| Party | Candidate | Votes | % | ± | |
|---|---|---|---|---|---|
| Labour | Rosalind Copeland | 1,151 | 43.5 | -1.3 | |
| Conservative | Terence Docherty | 702 | 26.5 | +6.2 | |
| BNP | Alan Brettwood | 530 | 20.0 | +2.6 | |
| Liberal Democrat | Anne Griffin | 263 | 9.9 | -0.5 | |
| Majority | 449 | 17.0 | -7.5 | ||
| Turnout | 2,646 | 32.7 | -0.2 | ||
| Labour hold | Swing | ||||
| Party | Candidate | Votes | % | ± | |
|---|---|---|---|---|---|
| Labour | Susan Watson | 1,089 | 45.3 | -5.1 | |
| Conservative | Shaun Cudworth | 528 | 22.0 | +4.8 | |
| BNP | Julie Potter | 415 | 17.3 | +6.1 | |
| Liberal Democrat | Simon Dawes | 371 | 15.4 | +5.2 | |
| Majority | 561 | 23.3 | -9.9 | ||
| Turnout | 2,403 | 29.5 | +0.5 | ||
| Labour hold | Swing | ||||
| Party | Candidate | Votes | % | ± | |
|---|---|---|---|---|---|
| Conservative | Alan Wright | 1,660 | 50.3 | +3.4 | |
| Labour | Darryl Dixon | 1,206 | 36.5 | -3.9 | |
| BNP | Lynne Hudson | 249 | 7.5 | +0.1 | |
| Liberal Democrat | Diana Lambton | 185 | 5.6 | +5.6 | |
| Majority | 454 | 13.8 | +7.4 | ||
| Turnout | 3,300 | 41.7 | -0.9 | ||
| Conservative gain from Labour | Swing | ||||
| Party | Candidate | Votes | % | ± | |
|---|---|---|---|---|---|
| Conservative | Margaret Forbes | 2,046 | 60.2 | +0.8 | |
| Labour | Lewis Atkinson | 797 | 23.4 | -2.1 | |
| Liberal Democrat | Les Wascoe | 342 | 10.1 | +10.1 | |
| BNP | Joanne Cruickshanks | 216 | 6.4 | +0.4 | |
| Majority | 1,249 | 36.7 | +2.8 | ||
| Turnout | 3,401 | 40.8 | +1.5 | ||
| Conservative hold | Swing | ||||
| Party | Candidate | Votes | % | ± | |
|---|---|---|---|---|---|
| Conservative | Lilian Walton | 1,501 | 47.8 | +4.0 | |
| Labour | Stephen Bonallie | 840 | 26.7 | -4.5 | |
| Liberal Democrat | Diana Matthew | 443 | 14.1 | +0.7 | |
| BNP | Derek Wright | 358 | 11.4 | +2.5 | |
| Majority | 661 | 21.0 | +8.4 | ||
| Turnout | 3,142 | 37.8 | +0.1 | ||
| Conservative hold | Swing | ||||
| Party | Candidate | Votes | % | ± | |
|---|---|---|---|---|---|
| Labour | Dianne Snowdon | 1,283 | 40.3 | -8.3 | |
| Conservative | Hilary Johnson | 833 | 26.2 | +3.0 | |
| Liberal Democrat | John Mclelland | 741 | 23.3 | +5.6 | |
| BNP | Clive Thompson | 328 | 10.3 | -0.2 | |
| Majority | 450 | 14.1 | -11.3 | ||
| Turnout | 3,185 | 36.3 | +0.6 | ||
| Labour hold | Swing | ||||
| Party | Candidate | Votes | % | ± | |
|---|---|---|---|---|---|
| Conservative | Ivan Richardson | 1,384 | 43.2 | +3.1 | |
| Labour | Neville Padgett | 1,291 | 40.3 | +1.0 | |
| Liberal Democrat | Malcolm Bannister | 401 | 12.5 | -1.7 | |
| BNP | Paul Masters | 130 | 4.1 | -2.2 | |
| Majority | 93 | 2.9 | +2.1 | ||
| Turnout | 3,206 | 37.1 | +1.2 | ||
| Conservative gain from Labour | Swing | ||||
| Party | Candidate | Votes | % | ± | |
|---|---|---|---|---|---|
| Labour | John Kelly | 1,490 | 53.0 | -5.0 | |
| Conservative | Kathleen Irvine | 625 | 22.2 | +5.9 | |
| Liberal Democrat | Steve Thomas | 365 | 13.0 | -3.3 | |
| BNP | Lynne Baillie | 329 | 11.7 | +2.3 | |
| Majority | 865 | 30.8 | -10.9 | ||
| Turnout | 2,809 | 32.3 | +1.0 | ||
| Labour hold | Swing | ||||
| Party | Candidate | Votes | % | ± | |
|---|---|---|---|---|---|
| Conservative | Eddie Wake | 1,326 | 42.5 | +5.4 | |
| Labour | Linda Williams | 1,173 | 37.6 | +2.2 | |
| Liberal Democrat | David Griffin | 390 | 12.5 | -2.9 | |
| BNP | Mildred Smart | 229 | 7.3 | -0.4 | |
| Majority | 153 | 4.9 | +3.3 | ||
| Turnout | 3,118 | 37.5 | +2.7 | ||
| Conservative gain from Labour | Swing | ||||
| Party | Candidate | Votes | % | ± | |
|---|---|---|---|---|---|
| Labour | Bernard Scaplehorn | 1,392 | 46.1 | -6.8 | |
| Conservative | Olwyn Bird | 763 | 25.3 | +7.8 | |
| Liberal Democrat | Irene Bannister | 538 | 17.8 | -0.4 | |
| BNP | Doreen Smart | 326 | 10.8 | +2.6 | |
| Majority | 629 | 20.8 | -13.9 | ||
| Turnout | 3,019 | 33.9 | +0.8 | ||
| Labour hold | Swing | ||||
References
- ↑ "Sunderland". BBC News Online. Retrieved 2010-12-29.
- ↑ "National: Full election results". The Guardian. 2008-05-03. p. 45.
- 1 2 "Postal voting hits record high in polls". Sunderland Echo. 2008-04-05. Retrieved 2010-12-30.
- ↑ Webster, Philip (2008-05-02). "Labour endures worst poll night for 30 years". The Times. p. 2.
- ↑ "Labour to control unitary council". BBC News Online. 2008-05-02. Retrieved 2010-12-30.
- 1 2 "Tory leader: We can go on to win Sunderland". Sunderland Echo. 2008-05-02. Retrieved 2010-12-30.
- 1 2 3 Young, Peter (2008-05-02). "Labour takes a real hammering". Evening Chronicle. p. 8.
- ↑ "All the results from Tyneside and Wearside's local councils". Evening Chronicle. 2010-05-08. p. 2.
- ↑ Pearson, Adrian (2008-05-02). "Even loyal areas punish Labour for national ills". The Journal. p. 5.
- ↑ "Sunderland Tories celebrate; local elections 2008". The Journal. 2008-05-02. Retrieved 2010-12-30.
- 1 2 3 4 5 6 7 8 9 10 11 12 13 14 15 16 17 18 19 20 21 22 23 24 25 26 "Results of Poll". Sunderland City Council. Retrieved 2010-12-29.
- ↑ "Results". The Times. 2008-05-03. p. 14.
- 1 2 3 4 5 6 7 8 9 10 11 12 13 14 15 16 17 18 19 20 21 22 23 24 25 "Labour down five seats + video". Sunderland Echo. 2008-05-02. Retrieved 2010-12-30.
| Preceded by Sunderland Council election, 2007 |
Sunderland local elections | Succeeded by Sunderland Council election, 2010 |