Structure of liquids and glasses
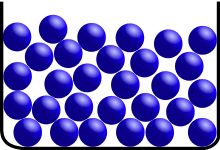
The structure of liquids, glasses and other non-crystalline solids is characterized by the absence of long-range order which defines crystalline materials. Liquids and amorphous solids do, however, possess a rich and varied array of short to medium range order, which originates from chemical bonding and related interactions. Metallic glasses, for example, are typically well described by the dense random packing of hard spheres, whereas covalent systems, such as silicate glasses, have sparsely packed, strongly bound, tetrahedral network structures. These very different structures result in materials with very different physical properties and applications.
The study of liquid and glass structure aims to gain insight into their behavior and physical properties, so that they can be understood, predicted and tailored for specific applications. Since the structure and resulting behavior of liquids and glasses is a complex many body problem, historically it has been too computationally intensive to solve using quantum mechanics directly. Instead, a variety of diffraction, NMR, Molecular dynamics, and Monte Carlo simulation techniques are most commonly used.
Pair distribution functions & Structure factors
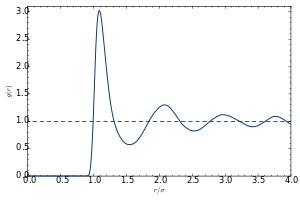
The pair distribution function (or pair correlation function) of a material describes the probability of finding an atom at a separation r from another atom.
A typical plot of g versus r of a liquid or glass shows a number of key features:
- At short separations (small r), g(r) = 0. This indicates the effective width of the atoms, which limits their distance of approach.
- A number of obvious peaks and troughs are present. These peaks indicate that the atoms pack around each other in 'shells' of nearest neighbors. Typically the 1st peak in g(r) is the strongest feature. This is due to the relatively strong chemical bonding and repulsion effects felt between neighboring atoms in the 1st shell.
- The attenuation of the peaks at increasing radial distances from the center indicates the decreasing degree of order from the center particle. This illustrates vividly the absence of "long-range order" in liquids and glasses.
- At long ranges, g(r) approaches a limiting value of 1, which corresponds to the macroscopic density of the material.
The static structure factor, S(q), which can be measured with diffraction techniques, is related to its corresponding g(r) by Fourier transformation
-
(1)
![S(q)-1={\frac {4\pi \rho }{q}}\int _{{0}}^{{\infty }}[g(r)-1]\sin {(qr)}{d}r](../I/m/49dc91ef87ba9b5e63cbca9c19de984eafc7d60b.svg)
where q is the magnitude of the momentum transfer vector, and ρ is the number density of the material. Like g(r), the S(q) patterns of liquids and glasses have a number of key features:
- For mono-atomic systems the S(q=0) limit is related to the isothermal compressibility. Also a rise at the low-q limit indicates the presence of small angle scattering, due to large scale structure or voids in the material.
- The sharpest peaks (or troughs) in S(q) typically occur in the q=1-3 Angstrom range. These normally indicate the presence of some medium range order corresponding to structure in the 2nd and higher coordination shells in g(r).
- At high-q the structure is typically a decaying sinusoidal oscillation, with a 2π/r1 wavelength where r1 is the 1st shell peak position in g(r).
- At very high-q the S(q) tends to 1, consistent with its definition.
Diffraction
The absence of long-range order in liquids and glasses is evidenced by the absence of Bragg peaks in X-ray and neutron diffraction. For these isotropic materials, the diffraction pattern has circular symmetry, and in the radial direction, the diffraction intensity has a smooth oscillatory shape. This diffracted intensity is usually analyzed to give the static structure factor, S(q), where q is given by q=4πsin(θ)/λ, where 2θ is the scattering angle (the angle between the incident and scattered quanta), and λ is the incident wavelength of the probe (photon or neutron). Typically diffraction measurements are performed at a single (monochromatic) λ, and diffracted intensity is measured over a range of 2θ angles, to give a wide range of q. Alternatively a range of λ, may be used, allowing the intensity measurements to be taken at a fixed or narrow range of 2θ. In x-ray diffraction, such measurements are typically called “energy dispersive”, whereas in neutron diffraction this is normally called “time-of-flight” reflecting the different detection methods used. Once obtained, an S(q) pattern can be Fourier transformed to provide a corresponding radial distribution function (or pair correlation function), denoted in this article as g(r). For an isotropic material, the relation between S(q) and its corresponding g(r) is
-
(2)
![g(r)-1={\frac {1}{2\pi \rho r}}\int _{{0}}^{{\infty }}[S(q)-1]\sin {(qr)}{d}q](../I/m/da6e47b9079a9c42c251bd87978d65002bc6130c.svg)
The g(r), which describes the probability of finding an atom at a separation r from another atom, provides a more intuitive description of the atomic structure. The g(r) pattern obtained from a diffraction measurement represents a spatial, and thermal average of all the pair correlations in the material, weighted by their coherent cross-sections with the incident beam.
Atomistic Simulation
By definition, g(r) is related to the average number of particles found within a given volume of shell located at a distance r from the center. The average density of atoms at a given radial distance from another atom is given by the formula:
-
(3)

where n(r) is the mean number of atoms in a shell of width Δr at distance r.[1] The g(r) of a simulation box can be calculated easily by histograming the particle separations using the following equation
-
(4)

where Na is the number of a particles, |rij| is the magnitude of the separation of the pair of particles i,j. Atomistic simulations can also be used in conjunction with interatomic pair potential functions in order to calculate macroscopic thermodynamic parameters such as the internal energy, Gibbs free energy, entropy and enthalpy of the system.
Other techniques
Other experimental techniques often employed to study the structure of glasses include Nuclear Magnetic Resonance (NMR), X-ray absorption fine structure (XAFS) and other spectroscopy methods including Raman spectroscopy. Experimental measurements can be combined with computer simulation methods, such as Reverse Monte Carlo (RMC) or molecular dynamics (MD) simulations, to obtain more complete and detailed description of the atomic structure.
Network glasses
Early theories relating to the structure of glass included the crystallite theory whereby glass is an aggregate of crystallites (extremely small crystals).[2] However, structural determinations of vitreous SiO2 and GeO2 made by Warren and co-workers in the 1930s using x-ray diffraction showed the structure of glass to be typical of an amorphous solid[3] In 1932 Zachariasen introduced the random network theory of glass in which the nature of bonding in the glass is the same as in the crystal but where the basic structural units in a glass are connected in a random manner in contrast to the periodic arrangement in a crystalline material. [4] Despite the lack of long range order, the structure of glass does exhibit a high degree of ordering on short length scales due to the chemical bonding constraints in local atomic polyhedra.[5] For example, the SiO4 tetrahedra that form the fundamental structural units in silica glass represent a high degree of order, i.e. every silicon atom is coordinated by 4 oxygen atoms and the nearest neighbour Si-O bond length exhibits only a narrow distribution throughout the structure.[2] The tetrahedra in silica also form a network of ring structures which leads to ordering on more intermediate length scales of up to approximately 10 Angstroms.
Alternative views of the structure of liquids and glasses include the interstitialcy model [6] and the model of string-like correlated motion.[7] Molecular dynamics computer simulations indicate these two models are closely connected [8]
As in other amorphous solids, the atomic structure of a glass lacks any long range translational periodicity. However, due to chemical bonding characteristics glasses do possess a high degree of short-range order with respect to local atomic polyhedra.[5]
It is deemed that the bonding structure of glasses, although disordered, has the same symmetry signature (Hausdorff-Besicovitch dimensionality) as for crystalline materials.[9]

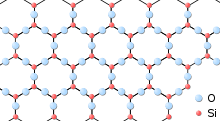
Crystalline SiO2
Silica (the chemical compound SiO2) has a number of distinct crystalline forms: quartz, tridymite, cistobalite, and others (including the high pressure polymorphs Stishovite and Coesite). Nearly all of them involve tetrahedral SiO4 units linked together by shared vertices in different arrangements. Si-O bond lengths vary between the different crystal forms. For example, in α-quartz the bond length is 161 pm, whereas in α-tridymite it ranges from 154–171 pm. The Si-O-Si bond angle also varies from 140° in α-tridymite to 144° in α-quartz to 180° in β-tridymite.
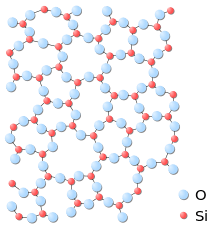
Glassy SiO2
In amorphous silica (fused quartz), the SiO4 tetrahedra form a network that does not exhibit any long-range order. However, the tetrahedra themselves represent a high degree of local ordering, i.e. every silicon atom is coordinated by 4 oxygen atoms and the nearest neighbour Si-O bond length exhibits only a narrow distribution throughout the structure.[2] If one consider the atomic network of silica as a mechanical truss, this structure is isostatic, in the sense that the number of constraints acting between the atoms equals the number of degrees of freedom of the latter. According to the rigidity theory, this allows this material to show a great forming ability.[10] Despite the lack of ordering on extended length scales, the tetrahedra also form a network of ring-like structures which lead to ordering on intermediate length scales (up to approximately 10 Angstroms or so).[2] Under the application of high pressure (approximately 40 GPa) silica glass undergoes a continuous polyamorphic phase transition into an octahedral form, i.e. the Si atoms are surrounded by 6 oxygen atoms instead of four in the ambient pressure tetrahedral glass.[11]
See also
Further reading
- Egelstaff, P.A. (1994). An Introduction to the Liquid State. Oxford University Press. ISBN 0198517505.
- Allen, M.P. & Tildersley, D.J. (1989). Computer Simulation of Liquids. Oxford University Press. ISBN 0198556454.
- Fischer, H.E., Barnes, A.C., and Salmon, P.S. (2006). "Neutron and x-ray diffraction studies of liquids and glasses". Rep. Prog. Phys. 69: 233–99. Bibcode:2006RPPh...69..233F. doi:10.1088/0034-4885/69/1/R05.
- Kawazoe,Y. and Waseda, Y. (2010). Structure and Properties of Aperiodic Materials. Springer. ISBN 3642056725.
- Santen, L. & Krauth W. (2000). "Absence of a Thermodynamic Phase Transition in a Model Glass Former". Nature. 405: 550. arXiv:cond-mat/9912182
 . Bibcode:2000Natur.405..550S. doi:10.1038/35014561.
External links
References
- ↑ McQuarrie, D.A., Statistical Mechanics (Harper Collins, 1976)
- 1 2 3 4 Adrian C Wright (1994). "Neutron scattering from vitreous silica. V. The structure of vitreous silica: What have we learned from 60 years of diffraction studies?". Journal of Non-Crystalline Solids. 179: 84–115. Bibcode:1994JNCS..179...84W. doi:10.1016/0022-3093(94)90687-4.
- ↑ B.E. Warren (1934). "The Diffraction of X-Rays in Glass". Physical Review. 45: 657. Bibcode:1934PhRv...45..657W. doi:10.1103/PhysRev.45.657.
- ↑ W.H. Zachariasen (1932). "The Atomic Arrangement in Glass". J. Amer. Chem. Soc. 54: 3841. doi:10.1021/ja01349a006.
- 1 2 P.S. Salmon (2002). "Order within disorder". Nature Materials. 1 (2): 87–8. doi:10.1038/nmat737. PMID 12618817.
- ↑ A. V. Granato. Interstitialcy model for condensed matter states of face-centered-cubic metals. Phys. Rev. Lett., 68(7):974, 1992.
- ↑ C. Donati, S. C. Glotzer, P. H. Poole, W. Kob, and S. J. Plimpton. Spatial correlations of mobility and immobility in a glass-forming Lennard-Jones liquid. Phys. Rev. E, 60(3):3107, 1999
- ↑ K. Nordlund, Y. Ashkenazy, R. S. Averback, and A. V. Granato. Strings and interstitials in liquids, glasses and crystals. Europhys. Lett., 71(4):625, 2005.
- ↑ M.I. Ojovan; W.E. Lee (2006). "Topologically disordered systems at the glass transition". J. Phys.: Condensed Matter. 18: 11507–11520. Bibcode:2006JPCM...1811507O. doi:10.1088/0953-8984/18/50/007.
- ↑ Phillips, J.C. (1979). "Topology of covalent non-crystalline solids I: Short-range order in chalcogenide alloys". Journal of Non-Crystalline Solids. 34 (2): 153. Bibcode:1979JNCS...34..153P. doi:10.1016/0022-3093(79)90033-4.
- ↑ C. J. Benmore; E. Soignard; S. A. Amin; M. Guthrie; S. D. Shastri; P. L. Lee & J. L. Yarger (2010). "Structural and topological changes in silica glass at pressure". Physical Review B. 81 (5): 054105. Bibcode:2010PhRvB..81e4105B. doi:10.1103/PhysRevB.81.054105.