Portugal (European Parliament constituency)
| Portugal | |
|---|---|
| European Parliament constituency | |
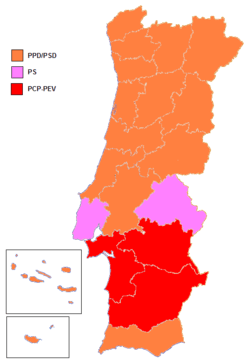
 Location among the 2014 constituencies | |
| Member state | Portugal |
| Created | 1987 |
| MEPs |
24 (1987 - 1994) 25 (1994 - 2004) 24 (2004 - 2009) 22 (2009 - 2014) 21 (2014 - present) |
| Sources | |
In European elections, Portugal is a constituency of the European Parliament, currently represented by twenty-one MEPs. It covers the member state of Portugal.
Current MEPs
As of September 2014
| Name | National Party | EP group |
|---|---|---|
| Francisco Assis | Partido Socialista | S&D |
| Maria João Rodrigues | Partido Socialista | S&D |
| Carlos Zorrinho | Partido Socialista | S&D |
| Elisa Ferreira | Partido Socialista | S&D |
| Ricardo Serrão Santos | Partido Socialista | S&D |
| Ana Gomes | Partido Socialista | S&D |
| Pedro da Silva Pereira | Partido Socialista | S&D |
| Liliana Rodrigues | Partido Socialista | S&D |
| Paulo Rangel | Aliança Portugal (PSD) | EPP |
| Fernando Ruas | Aliança Portugal (PSD) | EPP |
| Sofia Ribeiro | Aliança Portugal (PSD) | EPP |
| Nuno Melo | Aliança Portugal (CDS–PP) | EPP |
| Carlos Coelho | Aliança Portugal (PSD) | EPP |
| Cláudia Aguiar | Aliança Portugal (PSD) | EPP |
| José Manuel Fernandes | Aliança Portugal (PSD) | EPP |
| João Ferreira | Coligação Democrática Unitária | GUE–NGL |
| Inês Zuber | Coligação Democrática Unitária | GUE–NGL |
| Miguel Viegas | Coligação Democrática Unitária | GUE–NGL |
| Marisa Matias | Bloco de Esquerda | GUE–NGL |
| José Inácio Faria | Movimento Partido da Terra | ALDE |
| António Marinho e Pinto | Movimento Partido da Terra (Jun-Sep 2014) Partido Democrático Republicano (Sep 2014-) | ALDE |
1987

The first European election in Portugal was a by-election held after it joined the European Communities in 1987. The rest of the EC had voted in 1984.
| 1987 • 1989 → | ||||||||||
| National party | European party | Main candidate | Votes | % | +/– | Seats | +/– | |||
|---|---|---|---|---|---|---|---|---|---|---|
| Social Democratic Party (PSD) | LDR | Pedro Santana Lopes | 2,111,828 | 37.45 | — | 10 | — | |||
| Socialist Party (PS) | PES | Maria de Lourdes Pintasilgo | 1,267,672 | 22.48 | — | 6 | — | |||
| Democratic and Social Centre (CDS) | EPP | Francisco Lucas Pires | 868,718 | 15.40 | — | 4 | — | |||
| Democratic Unitarian Coalition (CDU) • Communist Party (PCP) • Ecologist Party (PEV) |
COM | Ângelo Veloso | 648,700 | 11.50 | — | 3 3 0 |
— — | |||
| Democratic Renewal Party (PRD) | EDA[1] | José Medeiros Ferreira | 250,158 | 4.44 | — | 1 | — | |||
| People's Monarchist Party (PPM) | None | 155,990 | 2.77 | — | 0 | — | ||||
| Others (parties and candidates that won less than 1% of the vote and no seats) | 193,869 | 3.44 | — | 0 | — | |||||
| Valid votes | 5,496,935 | 97.45 | ||||||||
| Blank and invalid votes | 142,985 | 2.54 | ||||||||
| Totals | 5,639,650 | 100.00 | — | 24 | — | |||||
| Electorate (eligible voters) and voter turnout | 7,787,603 | 72.42 | ||||||||
| Source: Comissão Nacional de Eleições | ||||||||||
1989

The 1989 European election was the third election to the European Parliament and the first time Portugal voted with the rest of the Community.
| ← 1987 • 1989 • 1994 → | ||||||||||
| National party | European party | Main candidate | Votes | % | +/– | Seats | +/– | |||
|---|---|---|---|---|---|---|---|---|---|---|
| Social Democratic Party (PSD) | LDR | António Capucho | 1,358,958 | 32.75 | 4.70 |
9 | 1 | |||
| Socialist Party (PS)* | PES | João Cravinho | 1,184,380 | 28.54 | 6.26 |
8 | 2 | |||
| Democratic Unitarian Coalition (CDU) • Communist Party (PCP) • Ecologist Party (PEV) |
LU | Carlos Carvalhas | 597,759 | 14.40 | 2.90 |
4 3 1 |
0 1 | |||
| Democratic and Social Centre (CDS) | EPP | Lucas Pires | 587,497 | 14.16 | 1.34 |
3 | 1 | |||
| People's Monarchist Party (PPM) | None | 84,272 | 2.03 | 0.74 |
0 | 0 | ||||
| Democratic Movement (MDP) | None | 56,900 | 1.37 | 0.88 |
0 | 0 | ||||
| People's Democratic Union (UDP) | None | 45,017 | 1.08 | 0.14 |
0 | 0 | ||||
| Others (parties or candidates that won less than 1% and no seats) | 107,217 | 2.58 | — | 0 | 1 | |||||
| Valid votes | 4,022,000 | 96.92 | ||||||||
| Blank and invalid votes | 127,756 | 3.08 | ||||||||
| Totals | 4,149,756 | 100.00 | — | 24 | 0 | |||||
| Electorate (eligible voters) and voter turnout | 8,121,564 | 51.10 | 21.32 |
|||||||
| Source: Comissão Nacional de Eleições * = The Socialist Party list included 1 MP elected by the Democratic Renewal Party. | ||||||||||
1994

The 1994 European election was the fourth election to the European Parliament and the third European election in Portugal.
| ← 1989 • 1994 • 1999 → | ||||||||||
| National party | European party | Main candidate | Votes | % | +/– | Seats | +/– | |||
|---|---|---|---|---|---|---|---|---|---|---|
| Socialist Party (PS) | PES | António Vitorino | 1,061,560 | 34.87 | 6.33 |
10 | 2 | |||
| Social Democratic Party (PSD) | EPP | Eurico de Melo | 1,046,918 | 34.39 | 1.64 |
9 | 0 | |||
| People's Party (CDS–PP) | EDA | Manuel Monteiro | 379,044 | 12.45 | 1.71 |
3 | 0 | |||
| Democratic Unitarian Coalition (CDU) • Communist Party (PCP) • Ecologist Party (PEV) |
GUE/NGL | Luis Manuel de Sá | 340,725 | 11.19 | 3.21 |
3 3 0 |
0 1 | |||
| Others (parties or candidates that won less than 1% of the vote and no seats) | 121,518 | 4.00 | — | 0 | 0 | |||||
| Valid votes | 2,949,765 | 96.90 | ||||||||
| Blank and invalid votes | 94,236 | 3.10 | ||||||||
| Totals | 3,044,001 | 100.00 | — | 25 | 1 | |||||
| Electorate (eligible voters) and voter turnout | 8,565,822 | 35.54 | 15.56 |
|||||||
| Source: Comissão Nacional de Eleições | ||||||||||
1999

The 1999 European election was the fifth election to the European Parliament.
| ← 1994 • 1999 • 2004 → | ||||||||||
| National party | European party | Main candidate | Votes | % | +/– | Seats | +/– | |||
|---|---|---|---|---|---|---|---|---|---|---|
| Socialist Party (PS) | PES | Mário Soares | 1,493,146 | 43.07 | 8.20 |
12 | 2 | |||
| Social Democratic Party (PSD) | EPP | José Pacheco Pereira | 1,078,528 | 31.11 | 3.28 |
9 | 0 | |||
| Democratic Unitarian Coalition (CDU) • Communist Party (PCP) • Ecologist Party (PEV) |
GUE/NGL | Ilda Figueiredo | 357,671 | 10.32 | 0.87 |
2 2 0 |
1 0 | |||
| People's Party (CDS–PP) | UFE | Paulo Portas | 283,067 | 8.16 | 4.29 |
2 | 1 | |||
| Left Bloc (BE) | None | Miguel Portas | 61,920 | 1.79 | new | 0 | new | |||
| Others (parties or candidates that won less than 1% of the vote and no seats) | 79,619 | 2.30 | — | 0 | 0 | |||||
| Valid votes | 3,353,951 | 96.74 | ||||||||
| Blank and invalid votes | 113,134 | 3.26 | ||||||||
| Totals | 3,467,085 | 100.00 | — | 25 | 0 | |||||
| Electorate (eligible voters) and voter turnout | 8,681,854 | 39.93 | 4.39 |
|||||||
| Source: Comissão Nacional de Eleições | ||||||||||
2004

The 2004 European election was the sixth election to the European Parliament.
| ← 1999 • 2004 • 2009 → | ||||||||||
| National party | European party | Main candidate | Votes | % | +/– | Seats | +/– | |||
|---|---|---|---|---|---|---|---|---|---|---|
| Socialist Party (PS) | PES | António Costa | 1,516,001 | 44.52 | 1.45 |
12 | 0 | |||
| Forward Portugal (FP) • Social Democratic Party (PSD) • People's Party (CDS–PP) |
EPP | João de Deus Pinheiro | 1,132,769 | 33.27 | [2] | 9 7 2 |
2 0 | |||
| Democratic Unitarian Coalition (CDU) • Communist Party (PCP) • Ecologist Party (PEV) |
GUE/NGL | Ilda Figueiredo | 309,401 | 9.09 | 1.23 |
2 2 0 |
0 0 | |||
| Left Bloc (BE) | EACL | Miguel Portas | 167,313 | 4.91 | 3.12 |
1 | 1 | |||
| Workers' Communist Party (PCTP/MRPP) | None | António Garcia Pereira | 36,294 | 1.07 | 0.19 |
0 | 0 | |||
| Others (parties or candidates that won less than 1% of the vote and no seats) | 108,338 | 3.18 | — | 0 | — | |||||
| Valid votes | 3,270,116 | 96.04 | ||||||||
| Blank and invalid votes | 134,666 | 3.96 | ||||||||
| Totals | 3,404,782 | 100.00 | — | 24 | 1 | |||||
| Electorate (eligible voters) and voter turnout | 8,821,456 | 38.60 | 1.33 |
|||||||
| Source: Comissão Nacional de Eleições | ||||||||||
2009
The 2009 European election was the seventh election to the European Parliament.
| ← 2004 • 2009 • 2014 → | ||||||||||
| National party | European party | Main candidate | Votes | % | +/– | Seats | +/– | |||
|---|---|---|---|---|---|---|---|---|---|---|
| Social Democratic Party (PSD) | EPP | Paulo Rangel | 1,131,744 | 31.71 | [3] | 8 | * 1 | |||
| Socialist Party (PS) | PES | Vital Moreira | 946,818 | 26.53 | 17.99 |
7 | 5 | |||
| Left Bloc (BE) | EACL / PEL | Miguel Portas | 382,667 | 10.72 | 5.81 |
3 | 2 | |||
| Democratic Unitarian Coalition (CDU) • Communist Party (PCP) • Ecologist Party (PEV) |
GUE/NGL | Ilda Figueiredo | 379,787 | 10.64 | 1.55 |
2 2 0 |
0 0 | |||
| People's Party (CDS–PP) | EPP | Nuno Melo | 298,423 | 8.36 | [4] | 2 | * 0 | |||
| Hope for Portugal Movement (MEP) | None | Laurinda Alves | 55,072 | 1.54 | new | 0 | 0 | |||
| Workers' Communist Party (PCTP/MRPP) | None | Orlando Alves | 42,940 | 1.20 | 0.13 |
0 | 0 | |||
| Others (parties or candidates that won less than 1% of the vote and no seats) | 95,744 | 2.69 | — | 0 | 0 | |||||
| Valid votes | 3,333,195 | 93.39 | ||||||||
| Blank and invalid votes | 235,748 | 6.61 | ||||||||
| Totals | 3,568,943 | 100.00 | — | 22 | 2 | |||||
| Electorate (eligible voters) and voter turnout | 9,704,559 | 36.78 | 1.82 |
|||||||
| Source: Comissão Nacional de Eleições | ||||||||||
2014

The 2014 European election was the eighth election to the European Parliament.
| ← 2009 • 2014 • 2019 → | ||||||||||
| National party | European party | Main candidate | Votes | % | +/– | Seats | +/– | |||
|---|---|---|---|---|---|---|---|---|---|---|
| Socialist Party (PS) | PES | Francisco Assis | 1,034,249 | 31.49 | 4.96 |
8 | 1 | |||
| Portugal Alliance (AP) • Social Democratic Party (PSD) • People's Party (CDS–PP) |
EPP | Paulo Rangel | 910,647 | 27.73 | * | 7 6 1 |
2 1 | |||
| Democratic Unitarian Coalition (CDU) • Communist Party (PCP) • Ecologist Party (PEV) |
EGP / PEL | João Ferreira | 416,925 | 12.69 | 2.05 |
3 3 0 |
1 0 | |||
| Earth Party (MPT) | ALDE | Marinho e Pinto | 234,788 | 7.15 | 6.48 |
2 | 2 | |||
| Left Bloc (B.E.) | PEL / EACL | Marisa Matias | 149,764 | 4.56 | 6.16 |
1 | 2 | |||
| LIVRE (L) | Rui Tavares | 71,495 | 2.18 | new | 0 | new | ||||
| Party for Animals and Nature (PAN) | EUL-NGL | Orlando Figueiredo | 56,431 | 1.72 | new | 0 | new | |||
| Workers' Communist Party (PCTP/MRPP) | None | Leopoldo Mesquita | 54,708 | 1.67 | 0.47 |
0 | 0 | |||
| Others (parties or candidates that won less than 1% of the vote and no seats) | 111,765 | 3.40 | — | 0 | 0 | |||||
| Valid votes | 3,040,771 | 92.58 | ||||||||
| Blank and invalid votes | 243,681 | 7.42 | ||||||||
| Totals | 3,284,452 | 100.00 | — | 21 | 1 | |||||
| Electorate (eligible voters) and voter turnout | 9,753,568 | 33.67 | 3.11 |
|||||||
| Source: Comissão Nacional de Eleições * = The Social Democratic Party and the People's Party contested separately the 2009 election. | ||||||||||
References
- ↑ Boissieu, Laurent de. "Élections européennes Portugal". Europe Politique (in French). Retrieved 9 April 2014.
- ↑ The Social Democratic Party (PSD) and the People's Party (CDS–PP) contested separately the 1999 election.
- ↑ The Social Democratic Party and the People's Party contested, together, the 2004 election in a coalition (Forward Portugal).
- ↑ The Social Democratic Party and the People's Party contested, together, the 2004 election in a coalition (Forward Portugal).
External links
- European Election News by European Election Law Association (Eurela)
- List of MEPs europarl.europa.eu